

syahrir maulana/iStock via Getty Images
Investment Thesis
The Avantis U.S. Small Cap Value Fund (NYSEARCA:AVUV) is a relatively new actively managed ETF with stellar results. Since it launched in September 2019, AVUV has gained an annualized 23.04%, or about 8% more than the most popular passively managed funds offered by State Street and iShares. Fees are reasonable at just 0.25% and given most investors’ lack of expertise in the category, it’s one area where it makes sense to pay up.
This article will discuss AVUV’s fundamentals at the industry level, including expected volatility, valuation, growth, and profitability. I’ll also provide a listing of other small-cap value and small-cap blended ETFs for consideration. AVUV isn’t the right ETF for me primarily because of its high volatility. But if that doesn’t concern you, I think there’s a lot to like, and I hope you enjoy learning more about this impressive ETF.
ETF Overview
AVUV’s investment objective is to seek long-term price appreciation. In other words, dividends are secondary, as evidenced by its small 1.22% yield. Since it’s actively managed, you’ll have to rely on managers’ track records and investment philosophy, which is to focus on firms with high profitability ratios trading at low valuations. That’s music to my ears. Profitability is often poor in the small-cap space, so I’m excited to see the types of selections that currently qualify.
After reading the prospectus, I was pleasantly surprised to learn that AVUV’s portfolio turnover rate for the most recent year was only 22%. I’ve written about this several times, but value investing requires patience, and I don’t need a fund manager, active or passive, to constantly rotate in and out of stocks based on screens that may not even benefit me. Instead, I’d rather they do so selectively, and if that means waiting several years to realize a stock’s actual value, so be it. By comparison, the passively-managed SPDR S&P 600 Small Cap Value ETF (SLYV) has a portfolio turnover rate of 36%. Ironically, you’re paying more for Avantis not to trade so often.
Before moving on to the fund’s exposure areas, I’ve listed some additional statistics below that may be of interest.
- Current Price: $82.62
- Assets Under Management: $2.85 billion
- Shares Outstanding: 35.68 million
- Expense Ratio: 0.25%
- Launch Date: September 24, 2019
- Trailing Dividend Yield: 1.20%
- Dividend Frequency: Quarterly
- Number of Securities: 638
- Assets in Top Ten: 8.91%
- 30-Day Median Bid-Ask Spread: 0.05%
- Premium To NAV: 0.01%
Sector Exposures and Top Ten Holdings
Compared to the SPDR S&P 600 Small Cap Value ETF and the iShares Russell 2000 Value ETF (IWN), AVUV overweights the Energy sector by 10-13%. This exposure has undoubtedly been a reliable source of outperformance as oil and other commodity prices remain elevated. But the challenge will always be when to sell. AVUV’s actively-managed approach should allow managers to protect gains as market conditions change. In my view, that will be a crucial test I’m hoping these managers will pass.
Morningstar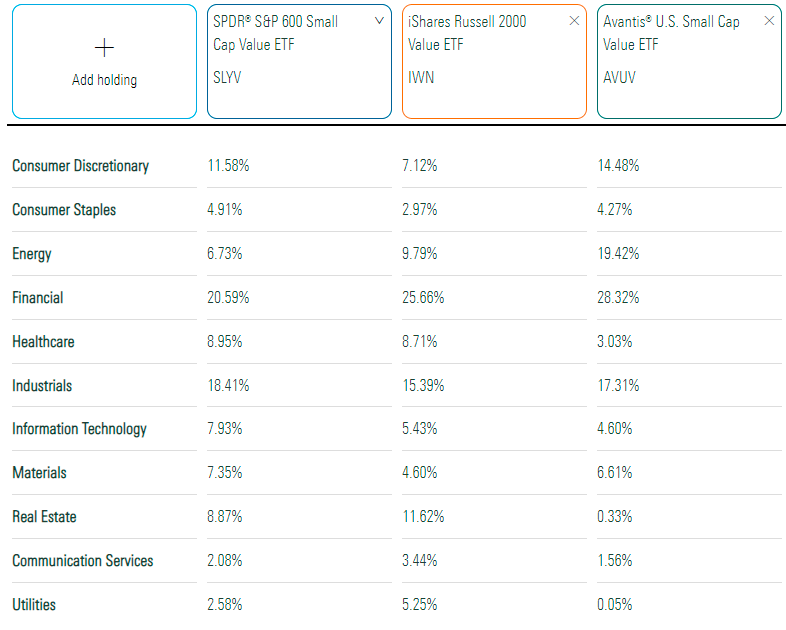
The other significant allocation difference is in Real Estate since AVUV’s exposure is only to five stocks with a combined 0.33% weight. Neither security is a REIT, and I couldn’t find anything in Avantis’ fact sheet or prospectus stating REITs were excluded.
Finally, I’ve listed the top ten holdings below, totaling 8.91%. Most of the leading names are Energy stocks.
Avantis Investors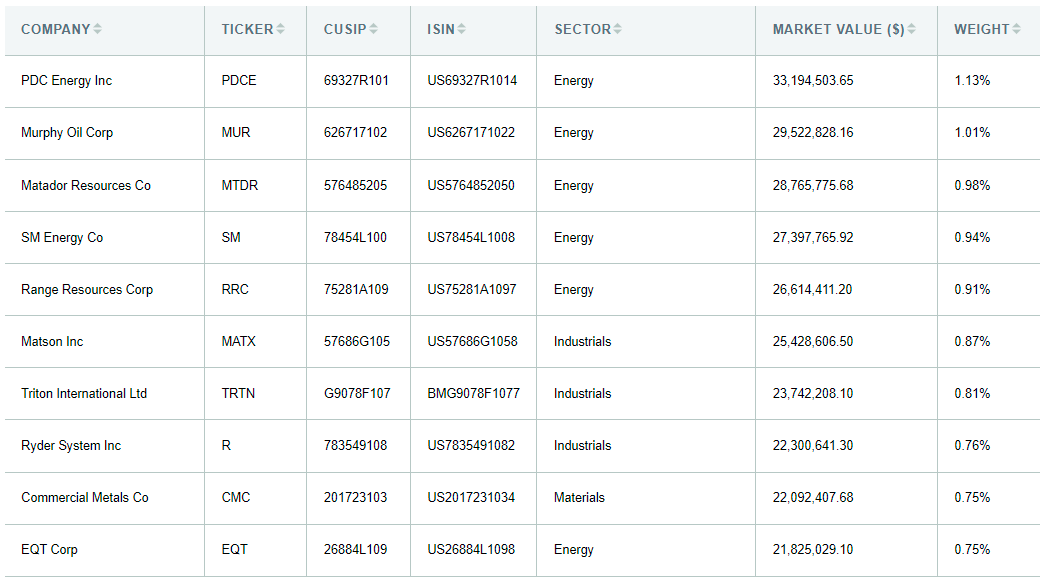
Performance Analysis
With actively managed ETFs like AVUV, having a good track record is essential. I don’t think it’s been tested enough yet, but as the saying goes, you can’t conquer what you don’t confront. Since its inception, AVUV has been one of the best small-cap value ETFs on the market, gaining an annualized 23.04% vs. 15.20% and 15.26% for SLYV and IWN. In the Q1 2020 crash, it had a more significant drawdown but was outpacing these peers by August.
Portfolio Visualizer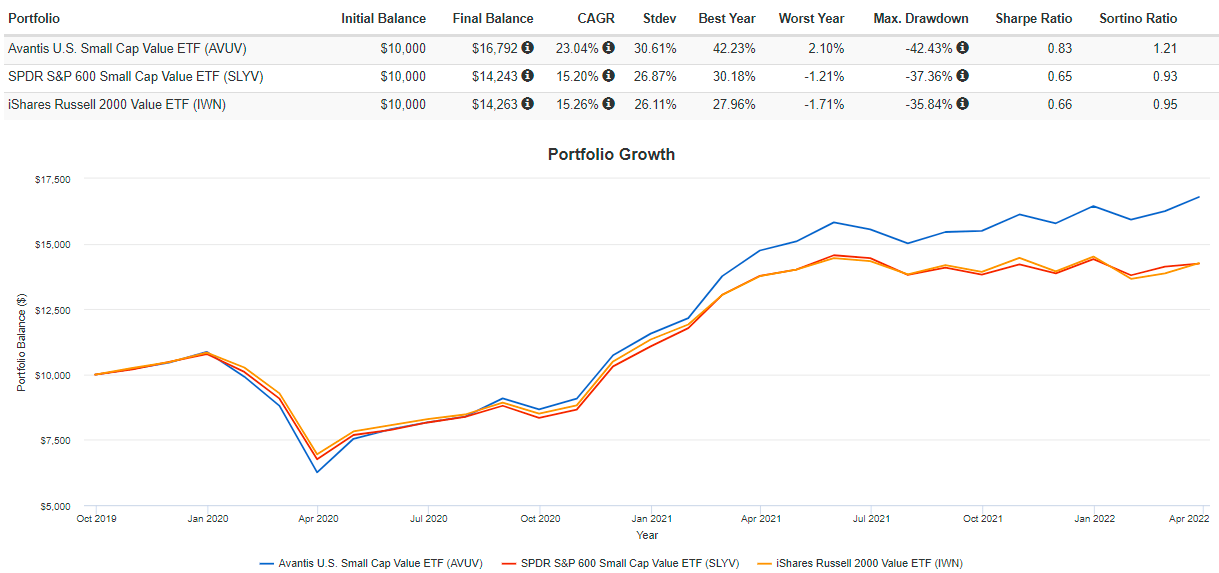
AVUV compares well against other peers in its category. Here is a list of 14 others, including two other actively managed ETFs: the Opus Small Cap Pure Value Plus ETF (OSCV) and the Dimensional U.S. Targeted Value ETF (DFAT). I welcome the addition of actively managed funds during uncertain times. It’s worth paying extra if managers can demonstrate knowledge of the small-cap space and take profits when appropriate.
Author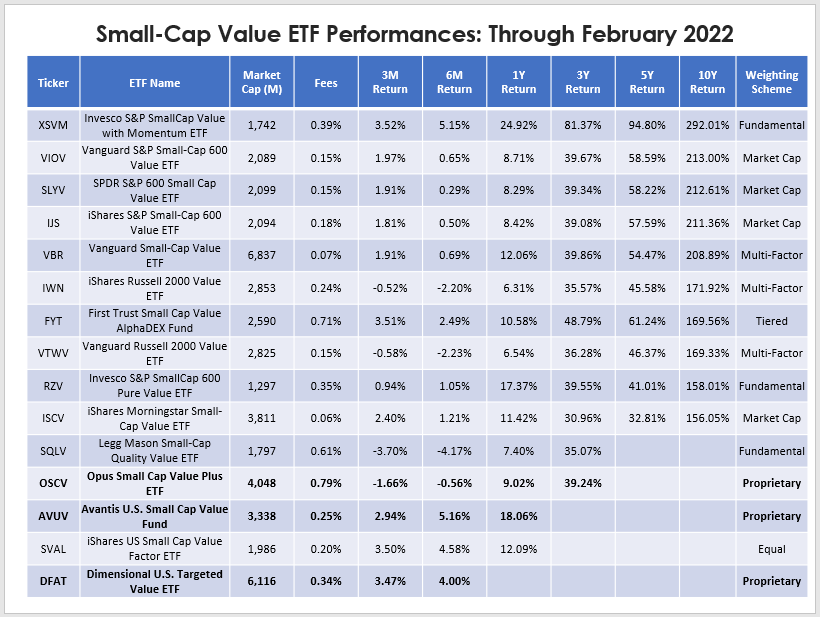
Fundamental Analysis
I want to highlight the key industries AVUV currently overweights and underweights relative to SLYV.
- Oil & Gas Exploration & Production: 10.89%
- Regional Banks: 5.26%
- Trading Companies & Distributors: 3.44%
- Industrial Machinery: (2.30%)
- Trucking: 2.30%
- Mortgage REITs: (2.23%)
- Thrifts & Mortgage Finance: 2.13%
- Oil & Gas Storage & Transportation: 2.12%
- Health Care Equipment: (1.96%)
- Retail REITs: (1.82%)
Overall, AVUV seems like an inflation-friendly fund, which helps explain its recent solid performance. Take oil and gas, for example. Climate change concerns notwithstanding, there’s a need for more oil production in the United States. After years of underinvestment and the Ukraine war, oil stocks are finally making up for lost ground. Talk of limiting profits will continue, like with the latest windfall tax proposal, but I consider that just noise best ignored. Regional banking stocks are also inflation-friendly since interest rates tend to rise to control them. However, the iShares U.S. Regional Banks ETF (IAT) chart shows the significant drawdowns to which the industry is vulnerable.
Portfolio Visualizer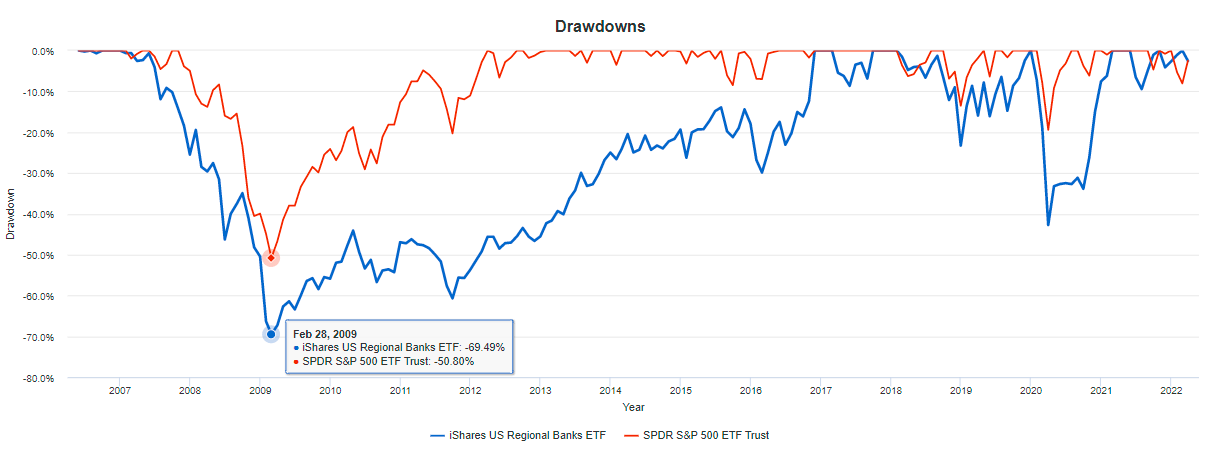
The elephant in the room is the Federal Reserve’s ability to execute a soft landing. A soft landing refers to delicately raising interest rates enough to drive down inflation but not too much so that it causes a recession. Unfortunately, the Fed’s track record isn’t great, with the last major success in 1994-95. One well-known indicator is the spread on ten- and two-year treasury yields. Currently, the spread is just 0.06%, and the curve is at risk of inverting. An inverted curve usually precedes recessions (shaded bars), so it’s crucial to AVUV investors since it’s a much more volatile ETF than other small-cap value funds.
St. Louis Federal Reserve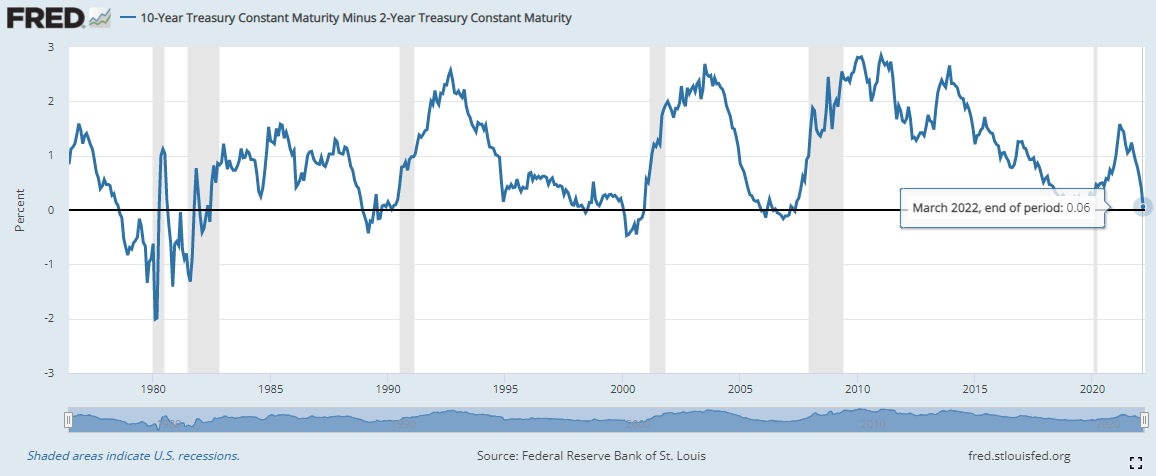
The good news is that AVUV’s fundamentals are excellent, and investors are taking notice. Shares outstanding grew from 20.80 million to 35.68 since August 31, 2021, per its latest annual report, and I have confirmed by calculating several metrics on AVUV’s top 20 industries.
Author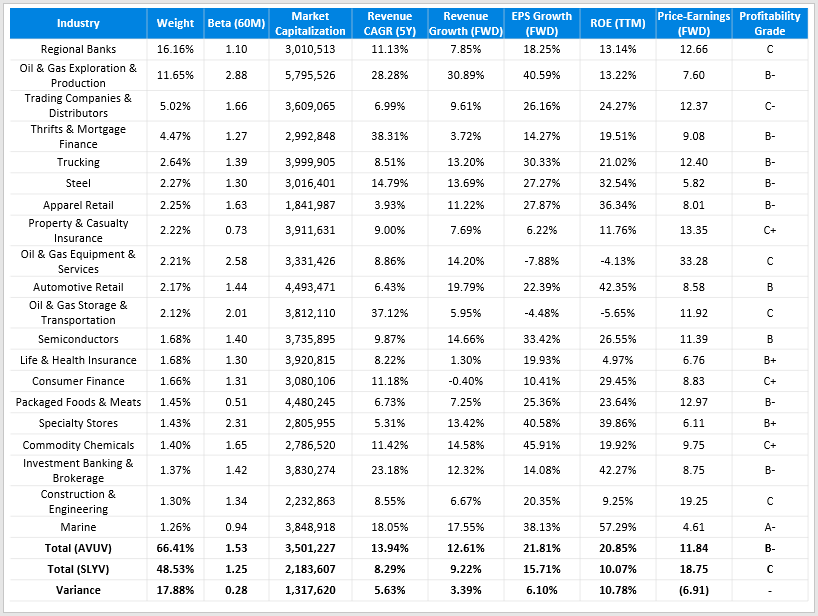
Compared with SLYV, AVUV is better in nearly all areas except for volatility. It’s a sticking point with me due to my recession concerns, but there’s no denying the following:
1. AVUV’s historical and forward revenue growth rates are better by five and three percent. However, much of that additional growth comes from oil stocks, and oil prices are difficult to predict. It’s a tough call for me. I think having about a 10-15% allocation in the Energy sector is appropriate, so I’d agree with adding AVUV to your portfolio if it helps you get there. E&P stocks are riskier than oil majors like Exxon Mobil (XOM) and Chevron (CVX), so it depends on your risk tolerance.
2. Estimated EPS growth is six percent higher than SLYV. Again, it’s oil and gas, with some related to AVUV’s additional exposure to regional banks. AVUV’s also overweight Trading Companies and Distributors like Triton International (TRTN), which should benefit shareholders should supply chain challenges continue.
3. AVUV is trading at a significant discount on forward earnings (11.84 vs. 18.75). According to my February analysis of all the small-cap value ETFs listed earlier, only the Invesco S&P SmallCap Value with Momentum ETF (XSVM) is cheaper. You can read my analysis of XSVM here.
4. AVUV has a higher weighted-average market capitalization figure than SLYV and most other small-cap value ETFs. I believe this relates to a higher profitability grade from Seeking Alpha (B- vs. C).
Investment Recommendation
My initial rating on AVUV was neutral, but I’ve decided to upgrade to a buy for the following reasons:
1. Its fundamentals are among the best in the category. Revenue and earnings growth rates are high, and its forward P/E is about two-thirds of SLYV. Profitability is better, too.
2. Inflation isn’t yet under control, so overweighting oil and gas and regional bank stocks makes sense. While an inverted curve typically precedes recessions, it doesn’t necessarily happen right away, so investors can potentially ride the inflation wave in the meantime.
3. AVUV’s track record is stellar. Only XSVM outperformed in the last year, but AVUV may have an advantage since it’s actively managed. If the Federal Reserve succeeds at executing a soft landing, I’ll expect the managers to adjust industry allocations accordingly. Other rules-based ETFs can’t do that.
While I can’t overlook the fund’s high volatility at the moment, there isn’t much else that I can say that’s negative. Therefore, AVUV is a buy, but carefully watch how the fund managers react to changing market conditions. It’s still relatively new, so be critical and objective until it’s tested more, and always be ready to sell if necessary.
Be the first to comment