

Ruslanshug/iStock via Getty Images
Editor’s note: Seeking Alpha is proud to welcome Daniel Kinskey-Lebeda as a new contributor. It’s easy to become a Seeking Alpha contributor and earn money for your best investment ideas. Active contributors also get free access to SA Premium. Click here to find out more »
Investment Thesis
Avantis U.S. Small Cap Value Fund (NYSEARCA:AVUV) is a compelling investment opportunity for those seeking inexpensive and profitable small-cap companies. With a robust, active rules-based methodology that considers multiple investment factors, AVUV has historically outperformed industry peers and its primary rival, Dimensional. Additionally, the fund is well-diversified across multiple metrics and managed by a highly experienced management team. All these aspects make AVUV a Strong Buy in my book for investors looking for small-cap value exposure, complete with a well-rounded approach to risk factors.
AVUV Strategy & Portfolio
AVUV jointly captures inexpensive and profitable small-cap companies. The fund has 699 holdings, a nice dividend yield of 1.69%, and an expense ratio of 0.25%. As the 6th largest holding, it makes up 5% of the Avantis All Equity Markets ETF (AVGE).
Combining aspects from Avantis Investors’ Scientific Approach to Investing whitepaper and the fund’s prospectus, the methodology can be summarized as follows: Avantis primarily applies an adjusted book-to-price ratio on the value side and an adjusted cash from operations to book value ratio on the profitability side. These two sides are then weighted equally. This allows them to consider both the balance sheet through book value and the flow of information from the balance sheet and income statement. Ultimately, they combine book equity/price with profits/book equity to determine discount rates of potential holdings.
This joint metric combines with screens for other factors such as momentum (past performance) and investment (degree of debt) exposure. At the same time, the portfolio management team, with over 90 combined years of experience under their belt, also considers other characteristics such as liquidity, trading costs, and taxes, to name a few.
In this analysis, I will compare AVUV to two small-cap value ETFs tracking passive indexes: the iShares Morningstar Small-Cap Value ETF (ISCV) and the Vanguard Small-Cap Value ETF (VBR), before comparing it to its closest competitor, the Dimensional US Small Cap Value ETF (DFSV).
The top 10 holdings, listed below with their weights, represent 8.26% of the total asset value. No holdings weigh more than 1%. The data shows that AVUV greatly minimizes the idiosyncratic risks of its individual holdings.
| Ryder System, Inc. | 0.96% |
| Triton International Ltd | 0.94% |
| Air Lease Corp. | 0.88% |
| Thor Industries, Inc. | 0.85% |
| Foot Locker, Inc. | 0.79% |
| Atkore Inc. | 0.79% |
| Louisiana-Pacific Corp. | 0.77% |
| GATX Corp. | 0.77% |
| Sanmina Corp. | 0.76% |
| Taylor Morrison Home Corp. | 0.75% |
| Total | 8.26% |
| # of Holdings | 699 |
*As of 2023-01-17, compiled by Author using data from the fund website.
I then compare AVUV to ISCV and VBR by sector weighting. As is common with Price/Book-centric valuation metrics, Financials and Industrials make up a significant portion of the fund. AVUV overweights energy, financials, basic materials, and consumer cyclical companies relative to other funds in our lineup. It underweights healthcare, technology, communication, and tends to ignore real estate and utilities. Over the past week or so, Basic Materials moved from an underweighting relative to other small-cap-value funds to an overweighting.
Chart; Canva, Data; AVUV, ISCV, and VBR fund websites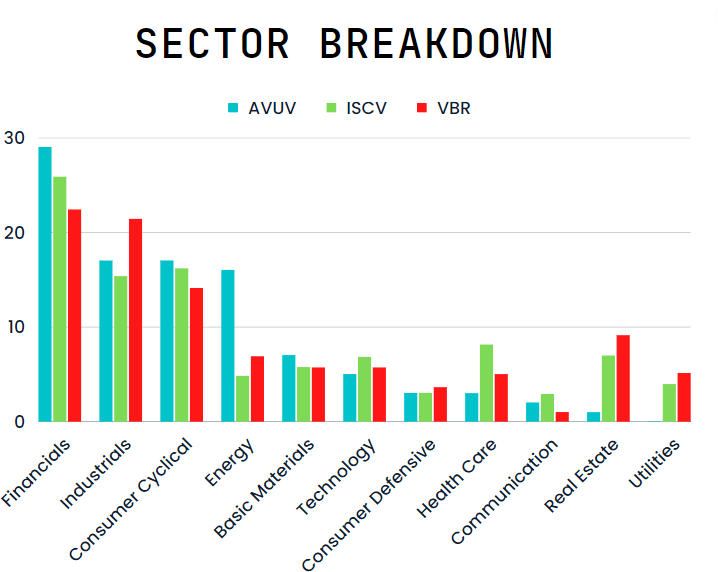
The Energy sector overweighting is consistent with the overall fund methodology as many Energy stocks have a combination of solid Value, Profitability, and Momentum characteristics. Three areas Avantis carefully considers in their process.
Avantis intentionally avoids Real Estate exposure in their equity funds, preferring their Avantis Real Estate ETF (AVRE)’s global real estate exposure. While some investors may find this undesirable, it is a deliberate decision by the fund company.
At the same time, as we will see, evaluating factor strategies requires a strong understanding of the methodology and fairly technical tools. In addition, investors who are most likely to have the financial knowledge required to examine it on their own are typically in the Financial sector. Those same investors may wish to avoid the fund’s overweighting of the financial sector to avoid overly correlated risk with their own human capital.
What is Factor Investing?
Factor investing dates back to Benjamin Graham’s books, Security Analysis and The Intelligent Investor, first published in 1934 and 1949. The books discuss how stocks that are inexpensive and highly profitable have an increased chance of improving a portfolio’s expected returns. Decades later, Eugene Fama and Ken French developed factor models using the following risk factors:
Market Beta (represented as RmF; Risk minus Free) – Stocks tend to have higher returns than risk-free assets.
Value (HmL; High minus Low) – Inexpensive stocks (high book-to-market) tend to outperform expensive stocks (low book-to-market).
Size (SmB; Small minus Big) – Small stocks tend to outperform large stocks.
Profitability (RmW; Robust minus Weak) – Companies with robust profitability tend to outperform companies with weak profitability.
Investment (CmA; Conservative minus Aggressive) – Companies that use debt conservatively outperform companies that use debt aggressively.
Momentum (WmL; Winners minus Losers) – The tendency for assets that have had positive, or negative, performance recently to continue performing similarly in the near future.
These risk factors are targeted in equity portfolios under a belief of long-term excess return and diversification benefits from dedicated exposure across them.
Performance
AVUV has outperformed ISCV and VBR since its inception in October 2019. However, factors are a ‘no pain, no premium’ strategy. Deeper factor exposure brings deeper drawdowns, higher volatility, and high tracking error – higher overall risk, in my view. Despite this, AVUV leads in historical risk-adjusted performance as well.
Note: Contrary to popular belief, risk/return metrics should be used sparingly.
| Since 10/1/19 | CAGR | 2022 Return | Max.Drawdown | Volatility | Sharpe |
| AVUV | 12.90% | -4.90% | -42.43% | 32.34% | 0.52 |
| ISCV | 5.21% | -10.56% | -39.92% | 30.29% | 0.39 |
| VBR | 7.11% | -9.36% | -34.98% | 26.86% | 0.36 |
Compiled by Author using data from Portfolio Visualizer
Based on a regression on the Fama-French 6-factor model below, it’s clear that AVUV’s deeper factor exposure to all six factors than its peers drove its outperformance during this period. Due to actively timing its trades based on Momentum, AVUV achieved a positive Momentum loading. In contrast, I believe its passive competitors were forced to match their indexes blindly, leading to lower performance. This was touched on by Avantis Investor’s Chief Investment Officer, Eduardo Repetto, in a recent Rational Reminder Podcast interview:
…So if you’re tracking an index, it’s very simple to monitor. The moment that you deviate, you have to understand the strategy, and you have to understand that this strategy is being managed in the way that you expect it. It’s a little bit more difficult. Some investors don’t want to do that. They want you tracking error. They don’t have to monitor anything and that’s fine. There is an opportunity costs for that, because indexing certainly suboptimal. But you know, everyone is free to decide what they want.
These aspects would explain the strong risk-adjusted outperformance over the period analyzed.
Portfolio Visualizer
Given this insignificant 3-year period, it’s important to check the factor characteristics of these funds’ holdings as seen in the following chart. When analyzing over periods shorter than multiple decades, the evidence indicates that characteristics tend to have stronger predictive power than factor loadings alone.
| Characteristics as of 2023-01-09 | Beta | Book/Price | Size (mm) | Gross Profit | Asset Growth | Momentum (2-12) |
| AVUV | 1.02 | 73.30% | 2,884 | 36.80% | 13.40% | 0.00% |
| ISCV | 1.01 | 62.40% | 3,683 | 26.60% | 10.10% | -11.60% |
| VBR | 0.95 | 54.30% | 6,392 | 25.20% | 8.20% | -2.90% |
Compiled by Author using data from Alpha Architect
AVUV has more exposure to cheaper, smaller, and more profitable stocks. There is also further confirmation that Avantis’ active Momentum-based trading is showing benefits in the data. Their current holdings are perfectly agnostic in their Momentum exposure. Their holdings also exhibit deep value, size, and profitability characteristics far and above the competition.
Due to taking on more significant exposure to these risk factors, AVUV has bested its passive competitors throughout every comparison, according to my calculations. So it’s high time we bring our active heavyweight into the ring.
Comparing AVUV with DFSV
DFSV, actively managed by Dimensional Fund Advisors (DFA), tends to capture smaller and less expensive value stocks than AVUV. DFSV has 971 holdings (Just over 28% more than AVUV), a paltry dividend yield of 0.85%, and a slightly higher expense ratio of 0.31%.
As former DFA employees founded Avantis, this resulted in a natural rivalry between the two firms. Each firm pursues remarkably similar approaches and believes in their respective methodologies over the others. So let’s see which wins out in a head-to-head comparison.
DFSV is a new ETF that only launched on February 23, 2022; however, it has a mutual fund equivalent in DFA U.S. Small Cap Value Portfolio Inst (DFSVX) we will use for its longer performance history.
DFSVX is the first competitor in this article to outperform AVUV in 2022. On the other hand, AVUV has outperformed DFSVX cumulatively since its inception in October 2019. AVUV leads in risk-adjusted performance again, despite exhibiting a deeper drawdown with more volatility.
| Since 10/19 | CAGR | 2022 Return | Max.Drawdown | Volatility | Sharpe |
| AVUV | 12.90% | -4.90% | -42.43% | 32.34% | 0.52 |
| DFSVX | 11.32% | -3.52% | -39.02% | 29.37% | 0.49 |
Compiled by Author using data from Portfolio Visualizer
While DFSV may include more micro stocks in its methodology than AVUV, it gives larger stocks relatively more weight. This is surprising given the higher profitability exposure of the Avantis fund. One would expect that more profitability would be captured through relatively overweighting larger stocks. Surprisingly, the opposite is reflected in my analysis of their holdings’ characteristics below.
In addition, Dimensional’s approach is trading extremely deep value exposure at the cost of a bet against other factors. It is slightly betting against Momentum and has lower profitability exposure. According to my findings, that is all in line with previous competitors.
| Characteristics as of 2023-01-09 | Beta | Book/Price | Size (mm) | Gross Profit | Asset Growth | Momentum (2-12) |
| AVUV | 1.02 | 73.30% | $2,884 | 36.80% | 13.40% | 0.03% |
| DFSV | 1.00 | 84.31% | $3,244 | 23.93% | 5.06% | -5.45% |
Compiled by Author using data from Alpha Architect
Notably, the Value and Asset Growth characteristics on DFSV are the best seen yet in my analysis, while Avantis’s Profitability and Momentum exposure remain exceptional relative to its peers.
Risks of the Deep Factor Bet
I believe the most significant rational risk to investors in all the funds we have looked at today is in the asset class name itself. ‘Small-Cap Value’ tends to expose investors to smaller, more volatile stocks with risks that result in inexpensive or ‘Value’ stocks. The risks get embedded in the price. Some of the risk factors we have looked at include the tendency for these stocks to be less profitable (lower Gross Profits), more over-leveraged (higher Asset Growth), and exhibit weaker past performance (low or negative Momentum).
Unfortunately, Avantis does have a higher Asset Growth characteristic than all its peers according to my analysis. Asset Growth is a broad measure of the relationship between investment and expected returns. Unlike many others, Beta, Size, and Asset Growth are each factor characteristics where lower values are more desirable from an expected returns perspective. Lower beta values are often associated with lower volatility, and this comparison offers no exception. This is further reflected in the Risk Grade for Avantis’ Standard Deviation, as shown below.
Seeking Alpha
One of the core drawbacks of adding additional risk factors to a portfolio is that the risk factors may take a long time to pay off. I believe this has been true historically. The 5-year annualized rolling return chart below demonstrates how Small Cap Value (represented by DFSVX) can underperform significantly for full decades at a time.
Portfolio Visualizer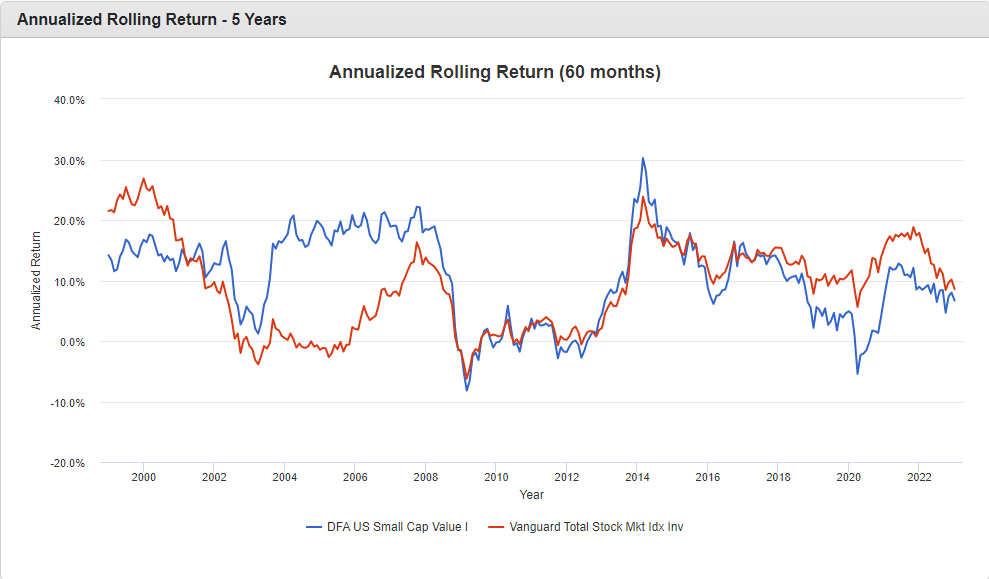
This experience is not unique to Small Cap Value. Historically, the market’s risk premium has suffered similarly prolonged droughts of relative underperformance. This can be seen in the decade preceding 2009. Such is the case for every risk premium. While not necessarily a rational reason to avoid small-cap value stocks entirely, I believe it is a serious psychological challenge to overcome. This is also why factor investors may wish to diversify the strategy globally. That can ensure they sufficiently capture the risk premiums regardless of where in the world it decides to reward investors. Although, even that comes with high differentiation from the standard market fund.
In addition, Value tends to perform well coming out of recessions during early recovery periods. This could help explain the sharp spikes of outperformance seen in the rolling return chart above. If one compares everything against the S&P 500 and distrusts the strategy during such a relative drought, one may be wise to stay far away from AVUV and its peers. Some of these risks were only obvious after deeper analysis.
Despite these risks, the strategy successfully harnesses long-only factor premiums via holdings of small, cheap, profitable stocks. They even capture non-negative Momentum through their active trading methodology. This robust approach leads my rating to a Strong Buy.
Takeaway
AVUV is an attractive opportunity for investors seeking small-cap value and profitability exposure. According to my analysis, the strategy improves upon Dimensional’s equivalent, outclasses passive peers, and captures everything die-hard factor investors prioritize. Small, cheap, profitable stocks with non-negative Momentum. It’s hard for me to make a case against Avantis’ methodology.
However, factor investing does require prospective investors to withstand the risks associated, take the time to understand the fund thoroughly, and hold for the long run. As a result, any potential investor should familiarize themselves with factor investing at a deep level before investing in this fund, lest they capitulate.
The deep Value and Profitability exposure and smart, systematic management help the fund’s rating, which I assign a Strong Buy, but only for the long-term investor.
Be the first to comment