

http://www.fotogestoeber.de/iStock via Getty Images
A good example of the perils of investing in high growth, higher risk tech stocks that everyone is talking about nowadays is the ARK Innovation ETF (ARKK).
Relative Performance of ARKK, S&P 500 Low Volatility Total Return and S&P 500 Total Return (Price Action Lab Blog – Norgate Data)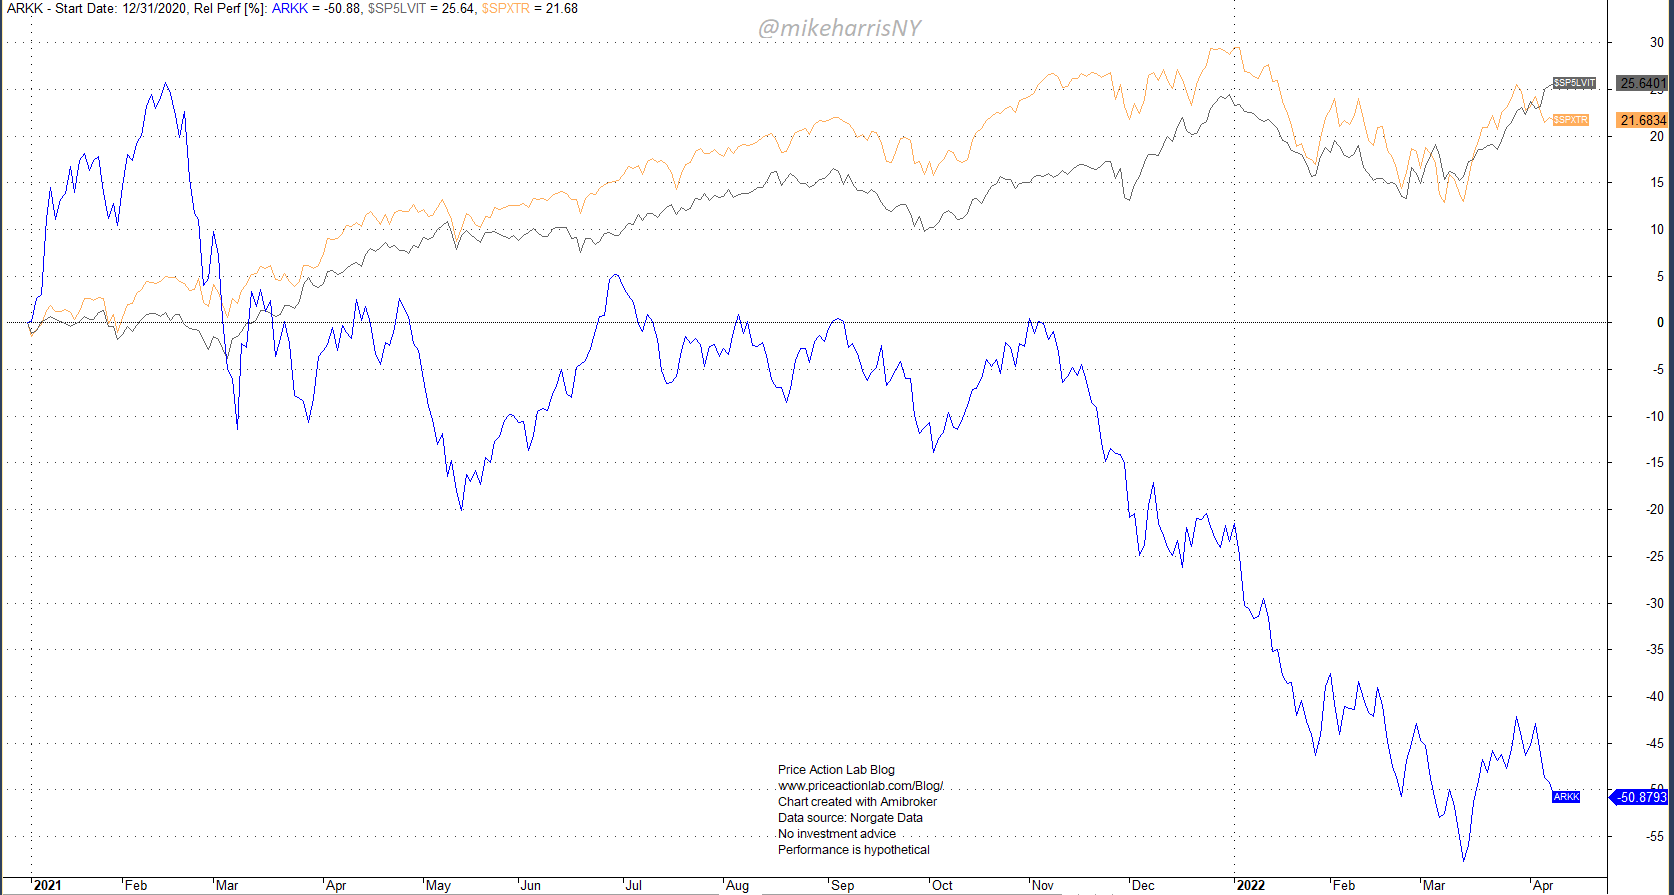
Since the start of 2021, ARKK is down about 51%, but the S&P 500 total return is up 21.7% and the Low Volatility S&P 500 total return is up 25.6%.
As people joke in social media posts, “there are many bagholders in the high-growth tech stock sector.” But this isn’t a new phenomenon.
As shown in the chart below, investors sold solid, lower-risk stocks long before the 2000 peak in order to invest in higher-risk stocks with the expectation of higher reward. As many of us who were active in the stock market during that time know, the shift to higher risk led to crowded trades and significant losses.
Relative Performance of S&P 500 Low Volatility Total Return, S&P 500 High Beta Total Return and S&P 500 Total Return (Price Action Lab Blog – Norgate Data)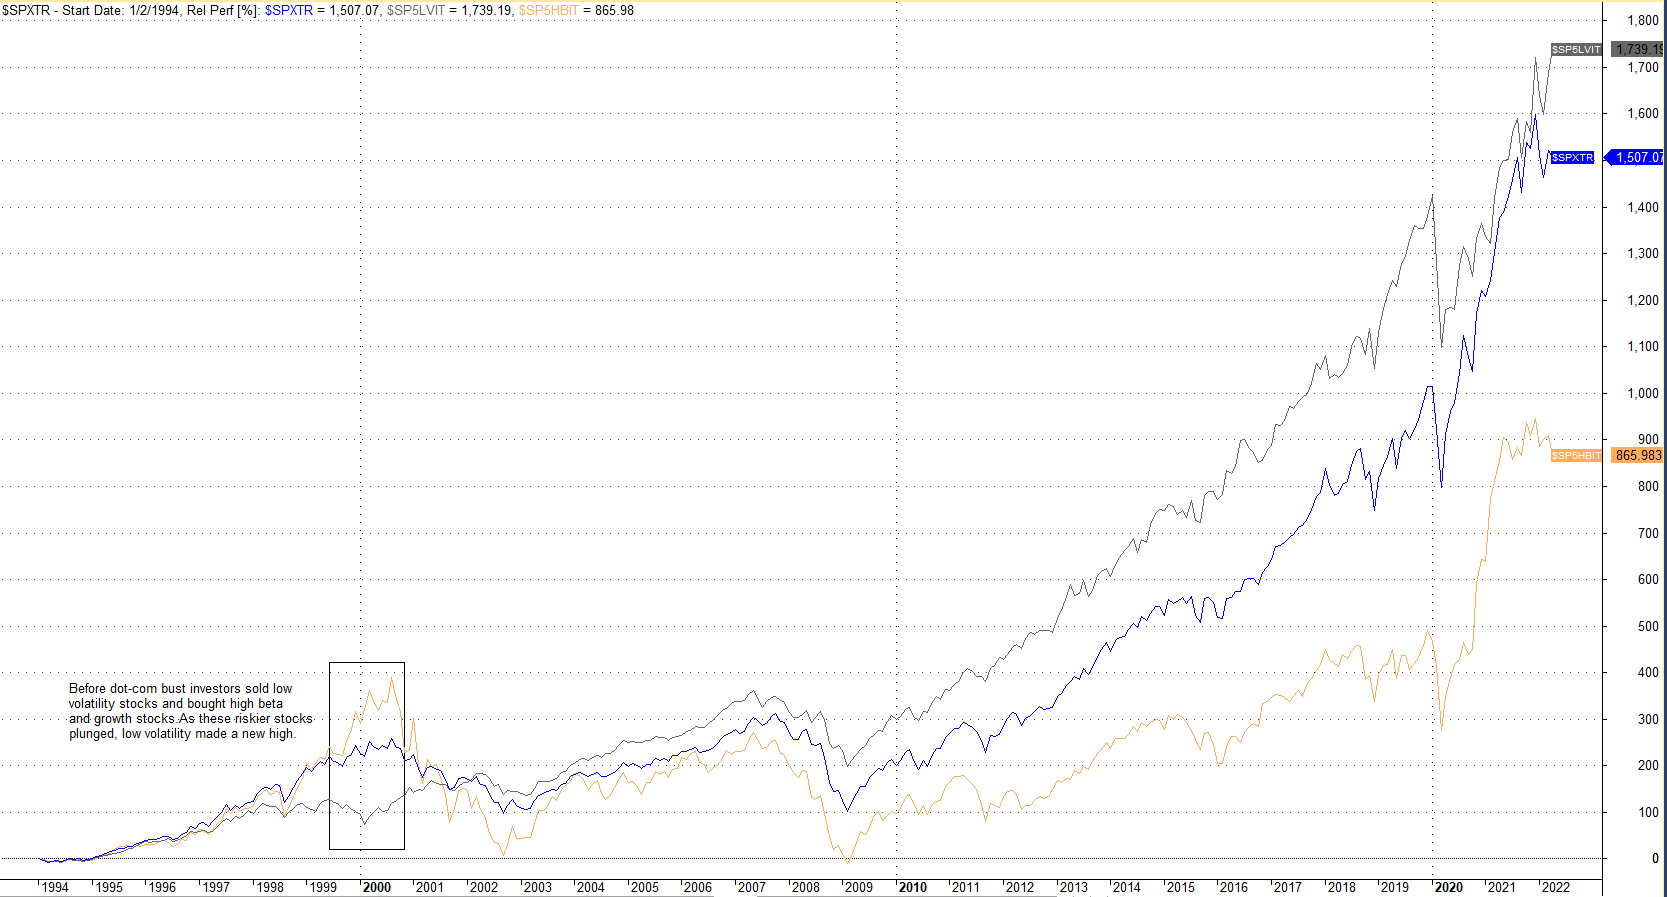
This is what happened, as depicted by the chart above: By June 1999, investors started selling low-volatility stocks for higher-risk ones. Low volatility large caps had fallen about 25% from their highs before even high beta large caps made a top. But then, investors started selling the higher-risk stocks, and the 2000 top was put in place. By November 2000, high beta stocks were in a bear market, but low volatility stocks had made new all-time highs!
Low volatility large caps continued to make new highs until mid-April 2020, while high beta large caps were getting crushed to the tune of -55%. At that point, there was spillover to the broader market due to panic and low volatility stocks fell, but the drawdown was about 20% by the bottom of 2003. To summarize, high growth and high beta investors faced large losses, but those who made the switch early managed to limit losses considerably.
A similar situation to that of the dotcom era appears to be developing at this point in time. It may be a pure coincidence, or a signal of a bear market.
Relative Performance of S&P 500 Low Volatility Total Return, S&P 500 High Beta Total Return and S&P 500 Total Return (Price Action Lab Blog – Norgate Data)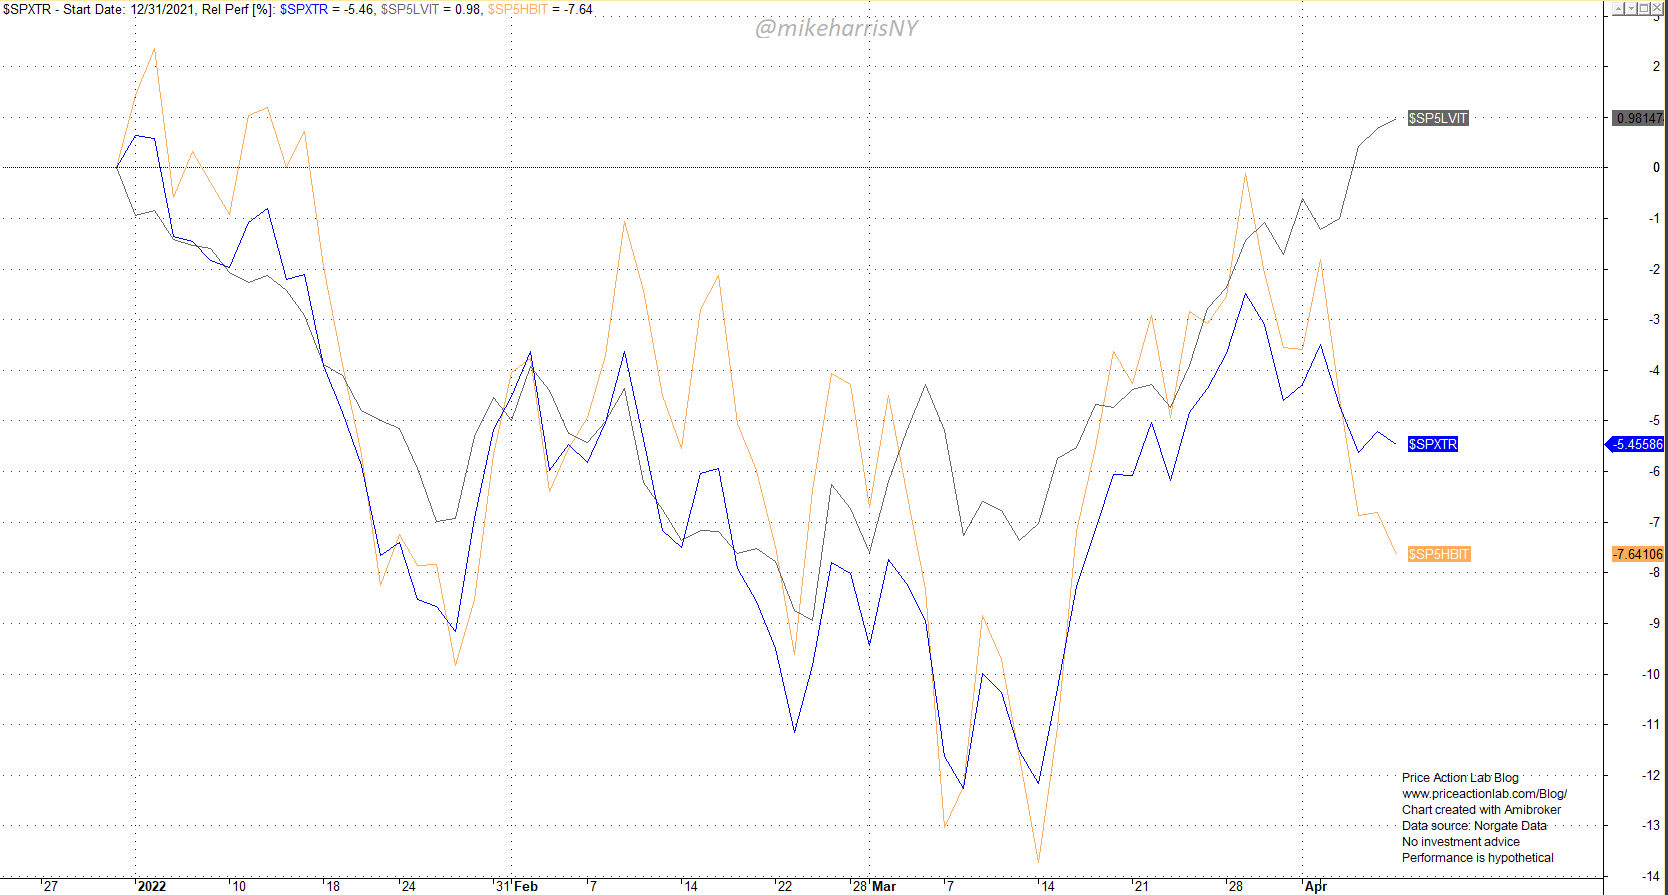
The low volatility S&P 500 reached new all-time highs last week, while the S&P 500 total return (SPX) is down 5.5% and the high beta S&P 500 total return is down 7.6%. This could be a signal of a bear market. Large equity funds never reduce their allocation to zero but instead sell higher-risk stocks, such as those held by the ARKK ETF, and buy solid names with lower volatility and risk. If, on top of this, the large funds decide to lower their allocation to stocks, or panic selling ensues, a bear market will develop, but the losses in their lower risk portfolios will be lower. At the bottom when it forms, these funds will buy cheap growth stocks with their cash while the sales will come mostly from retail, having reached an uncle point.
Investing only in low-risk stocks has worked well historically
The table below compares the buy and hold performance of the S&P 500 total return to that of the low volatility S&P 500 total return, as well as the performance of the 60/40 portfolio with annual rebalance, using either the S&P 500 total return or the low volatility S&P 500 total return. For bonds, we use the US Treasury Bond 20+ Year Total Return. The backtest period is from January 2, 1990 to April 8, 2022.
| SP 500 LV TR | SP 500 TR | 60/40 w/LV | 60/40 | |
| Annualized Return | 10.6% | 10.4% | 9.7% | 9.9% |
| Maximum Drawdown | -40.4% | -55.3% | -17.5% | -28.2% |
| Sharpe ratio | 0.76 | 0.57 | 1.13 | 0.96 |
| Equity Volatility | 14% | 18.1% | 8.6% | 10.3% |
SP 500 LV TR: Low Volatility S&P 500 Total Return SP 500 TR: S&P 500 Total Return 60/40 w/LV: 60/40 portfolio with the Low Volatility S&P 500 Total Return60/40: 60/40 portfolio with the S&P 500 Total Return
Buy and hold: low volatility has generated about the same annualized return as the total return index but at lower drawdown and volatility. As a result, Sharpe is significantly higher.
60/40 portfolio: The portfolio with the low volatility total return has generated a slightly lower annualized return in the period considered but significantly higher risk-adjusted returns. Due to the low drawdown, leveraged alpha could be extracted from this portfolio.
Conclusion
Large gains from high-risk stocks are probably “transitory”. Historically, investing in lower-risk stocks has provided solid performance at lower drawdown and has even offered the opportunity for “leveraged alpha.” New highs in low volatility stocks while high beta and growth are in the red could be a signal of a bear market based on what has occurred in the past. The past may be a guide for the future, but there is also high uncertainty due to changing market and economic conditions.
Be the first to comment