


William_Potter
AMT Q2 Recap and Thesis
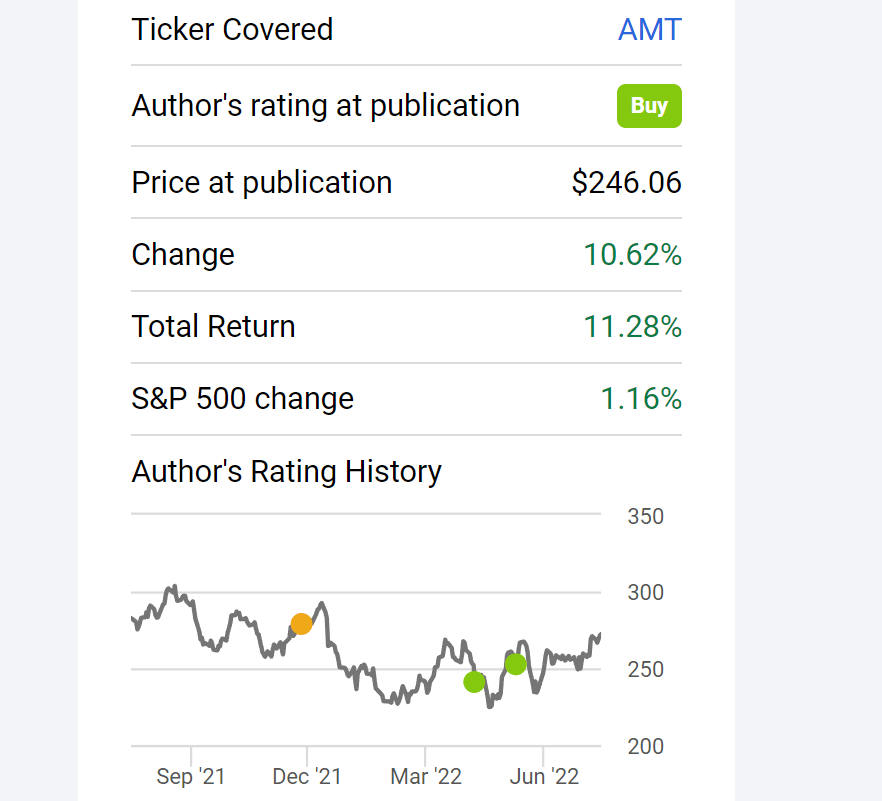
My last article on American Tower Corporation (NYSE:AMT) was published back in June 2022. In that article, I argued a bullish thesis. Specifically, I see such rapid expansion to continue in the future. The ramp-up of 5G provides an immediate catalyst. The stock price has indeed rallied by more than 11% since then, outpacing the S&P 500 by more than 10%.
Seeking Alpha
Today, I want to shift the focus to provide some comments on its Q2 earnings report, especially against the overall REIT sector represented by the Real Estate Select Sector SPDR ETF (NYSEARCA:XLRE). If you read our other recent articles, you would know that we are currently cautious with the overall REIT sector. As detailed in our recent article, we see several safe-haven sectors such as utilities and REITs are no longer “safe” because of the market uncertainties and rate hikes.
However, against this general backdrop, I do see several appealing features from AMT, the leader in the REIT sector. To start, it offers better resilience with its scale and strong business model. AMT reported strong and double-digit property revenue growth in Q2. A highlight was the performance of its recently acquired Telxius and CoreSite assets (to be elaborated on later). These factors led to much better performance even during extreme market turbulence as you can see from the chart below. To wit, AMT suffered a total loss of 5.87% YTD, while the overall sector (represented by XLRE) suffered a 14.5% loss YTD, almost 3x of AMT.
Next, we will see that despite XLRE’s larger price corrections, it is still a diversification compared to AMT.

Seeking Alpha
XLRE and AMT – basic information
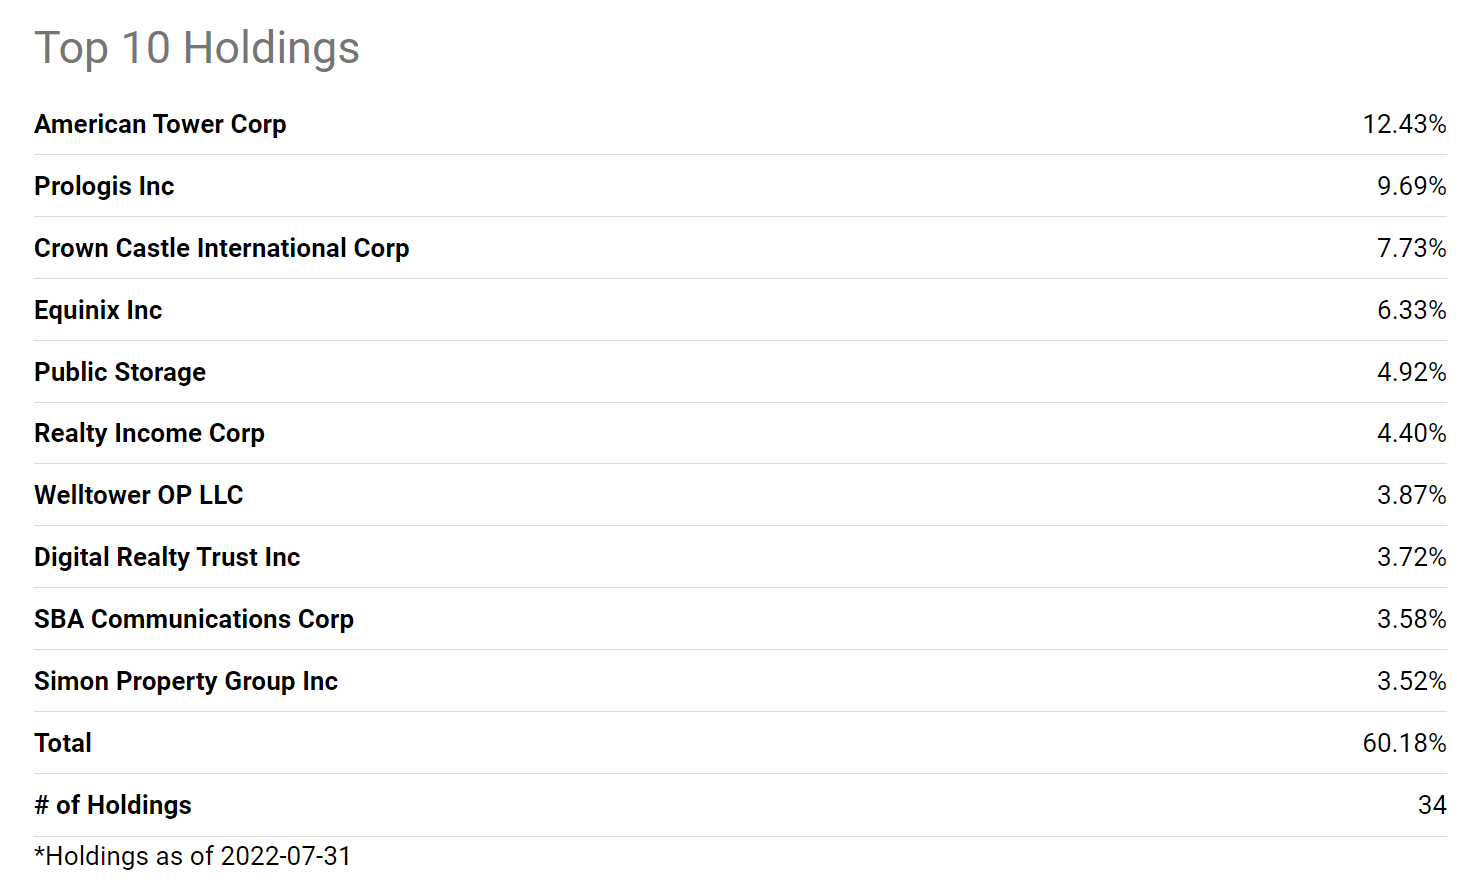
Just in case some readers are not familiar with XLRE yet, it is a fund in the popular SPDR fund family. Its AUM is about $5.5B currently. It charges a 0.1% expense ratio, and it provides a convenient and low-cost vehicle for investors to access the real estate sector of the S&P 500 Index. Note that the fund indexing excludes mortgage REITs (“mREITs”). Its top 10 holdings are listed below. Like any sector fund indexed by market cap, its holdings are dominated by a handful of large caps. The top 10 holdings represent more than 60% of the total assets. AMT is its largest holding, representing more than 12% of its total assets.
Seeking Alpha
XLRE vs AMT: a closer comparison
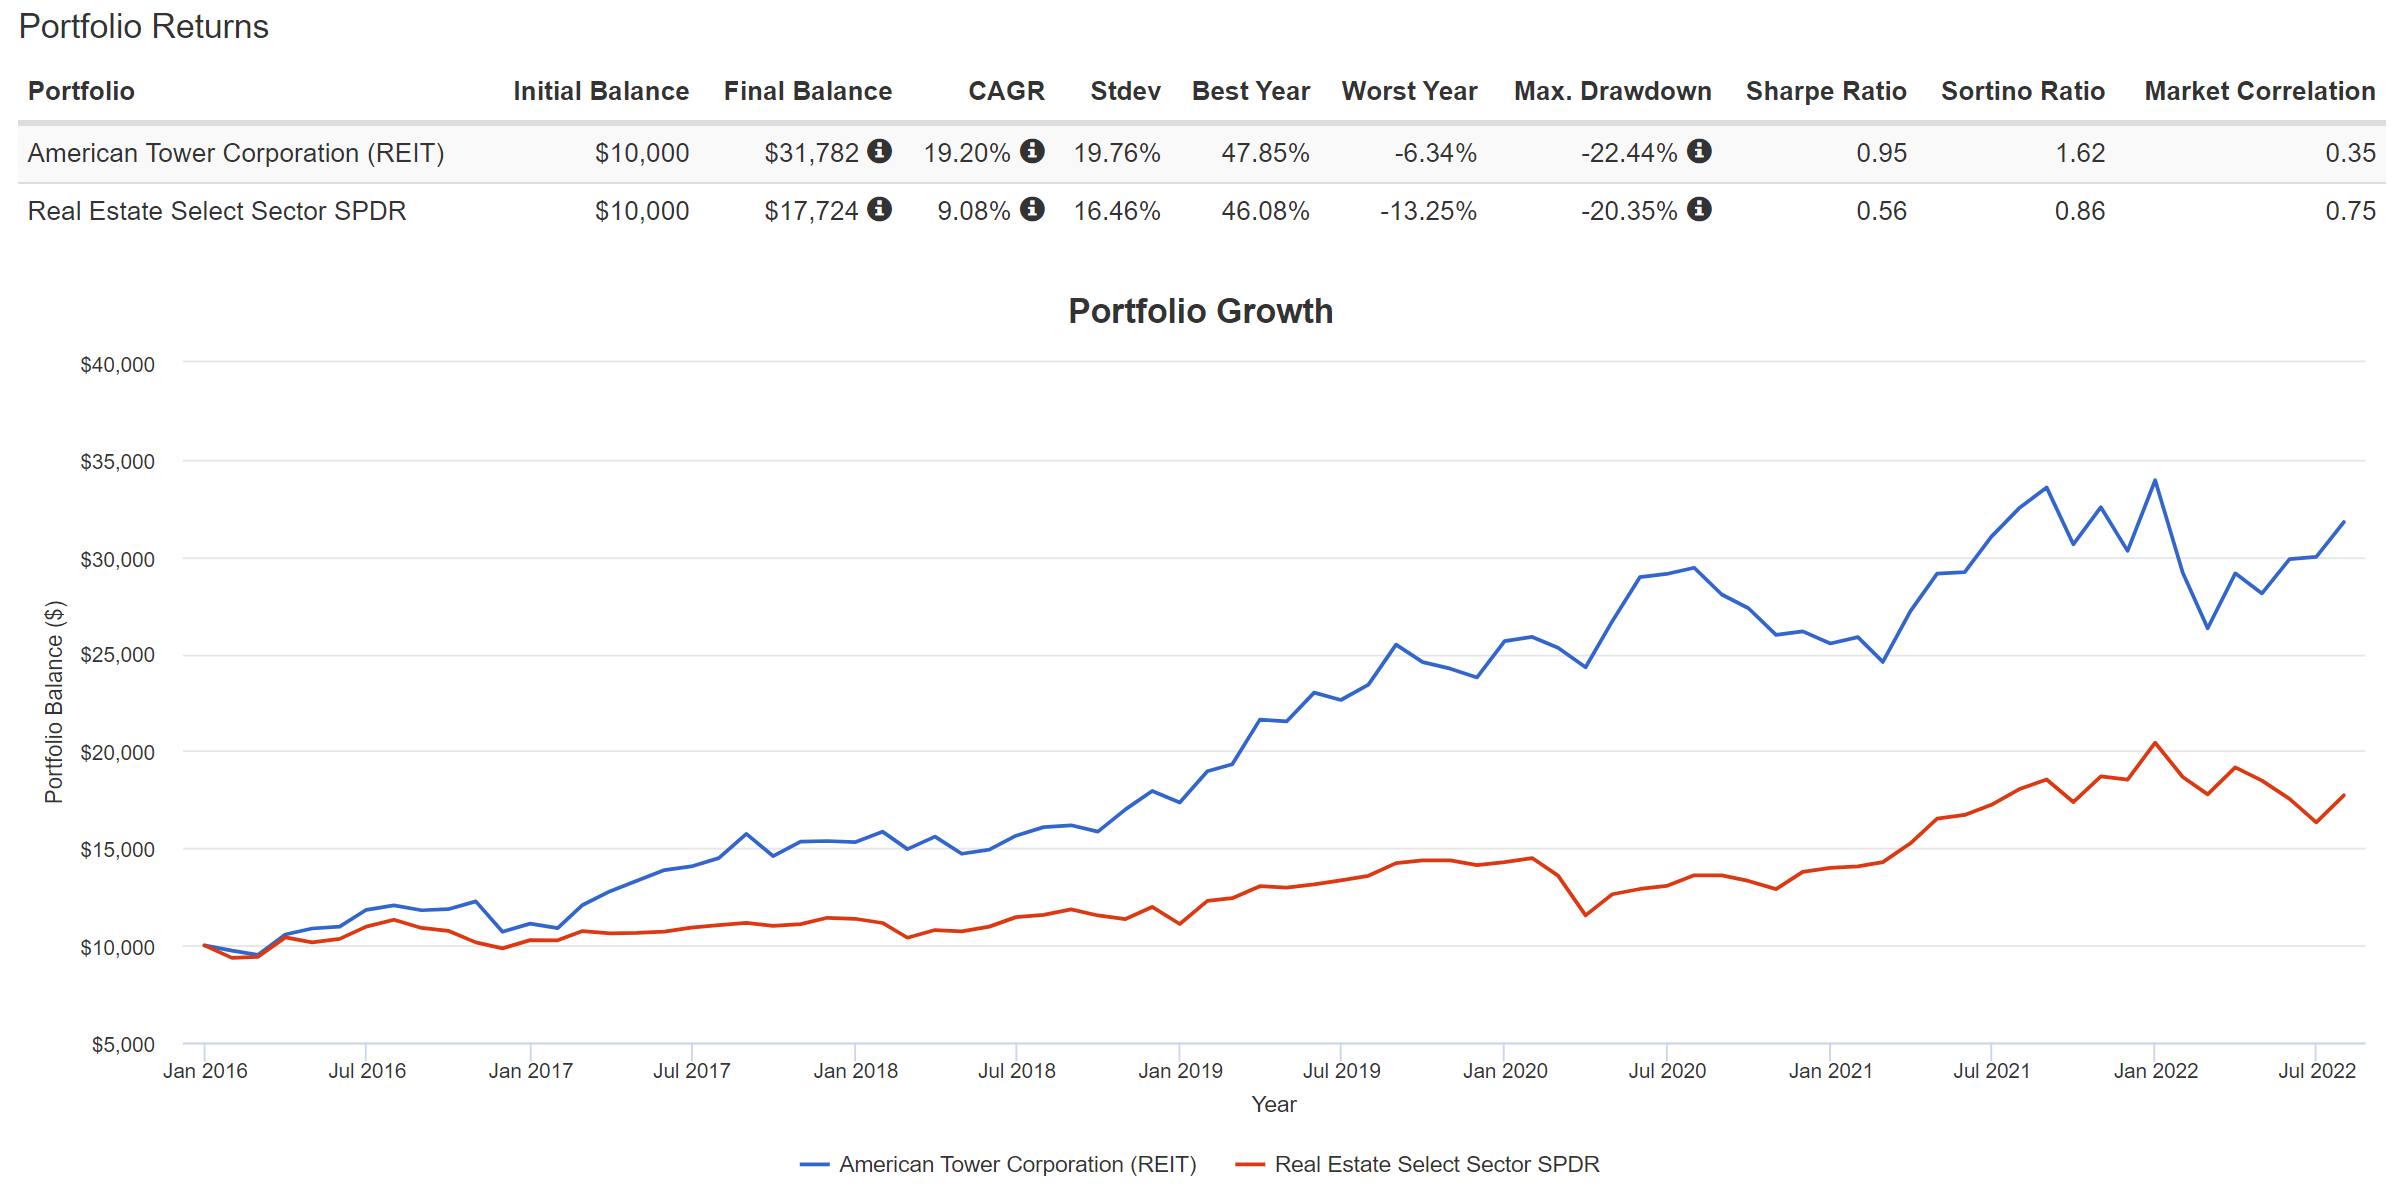
In my view, compared to AMT, XLRE is a diworsification as you can see from the next two charts. Note the second chart is based on data provided either from Yahoo Finance or Seeking Alpha after market close on Aug 5, 2022.
AMT provided superior profitability, growth, consistency, and total shareholder returns in the past. Since 2016 (when XLRE was launched), AMT provided an annual return of over 19%, a far more superior performance compared to XLRE’s 9.08% CAGR. The alpha is almost a whole 10% per year. When compounded over a few years, such an alpha has accumulated into a sizable difference of more than 140% in total return (317% vs 177%).
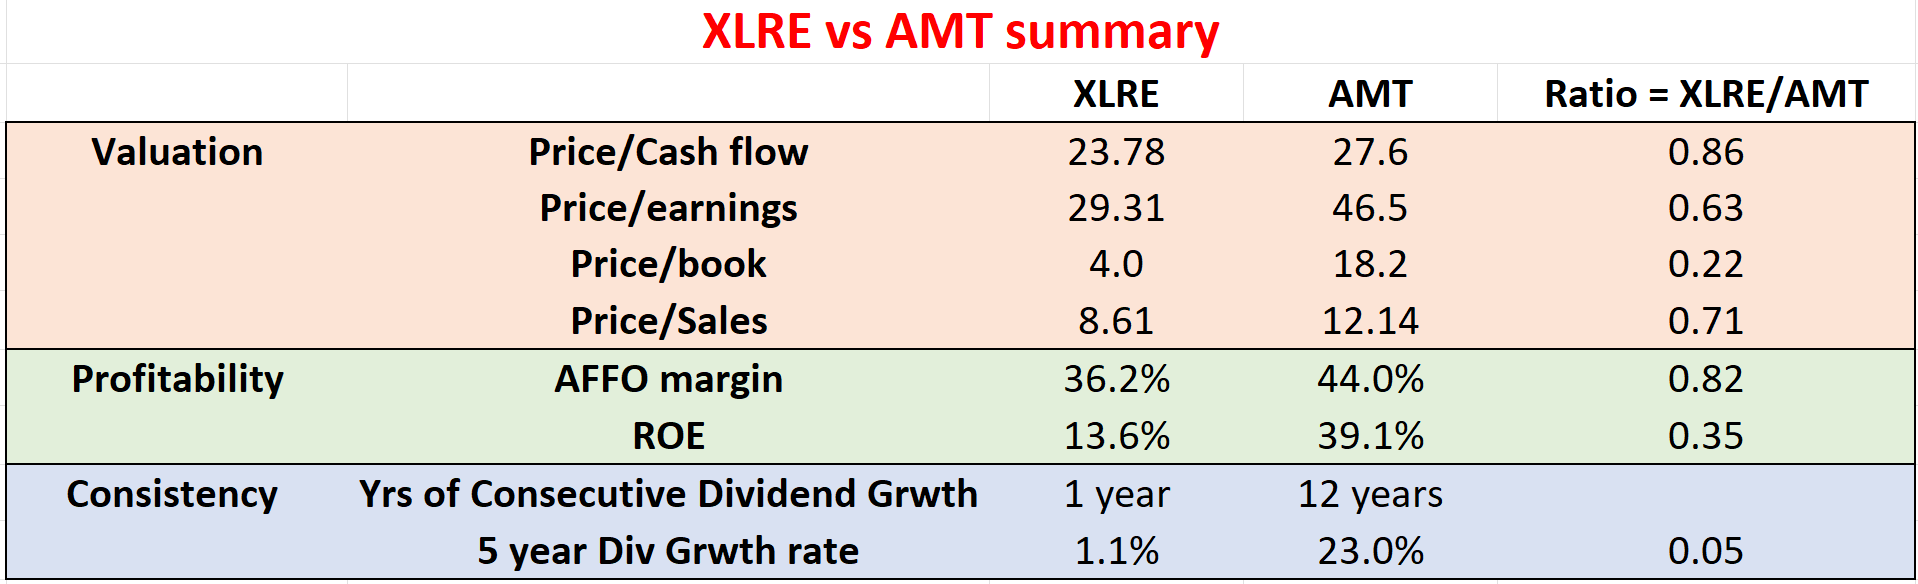
And given the current profitability conditions and valuation metrics as shown in chart 2, I see very favorable odds for the past performance to continue. First, readers should ignore the price-to-earnings ratio for REIT valuations. The price-to-cash flow ratio is more meaningful. It is 23.8x XLRE, below AMT’s 27.6x only by about 14%. However, AMT just offers so much better profitability and growth potential. As seen, XLRE’s AFFO margin is 18% below AMT, and ROE is almost only 1/3 of AMT.
And looking forward, we see much better growth prospects for AMT thanks to its capital allocation and premium assets, as detailed below.
Portfolio Visualizer
Author based on Yahoo and Seeking Alpha data
AMT: capital allocation and premium assets
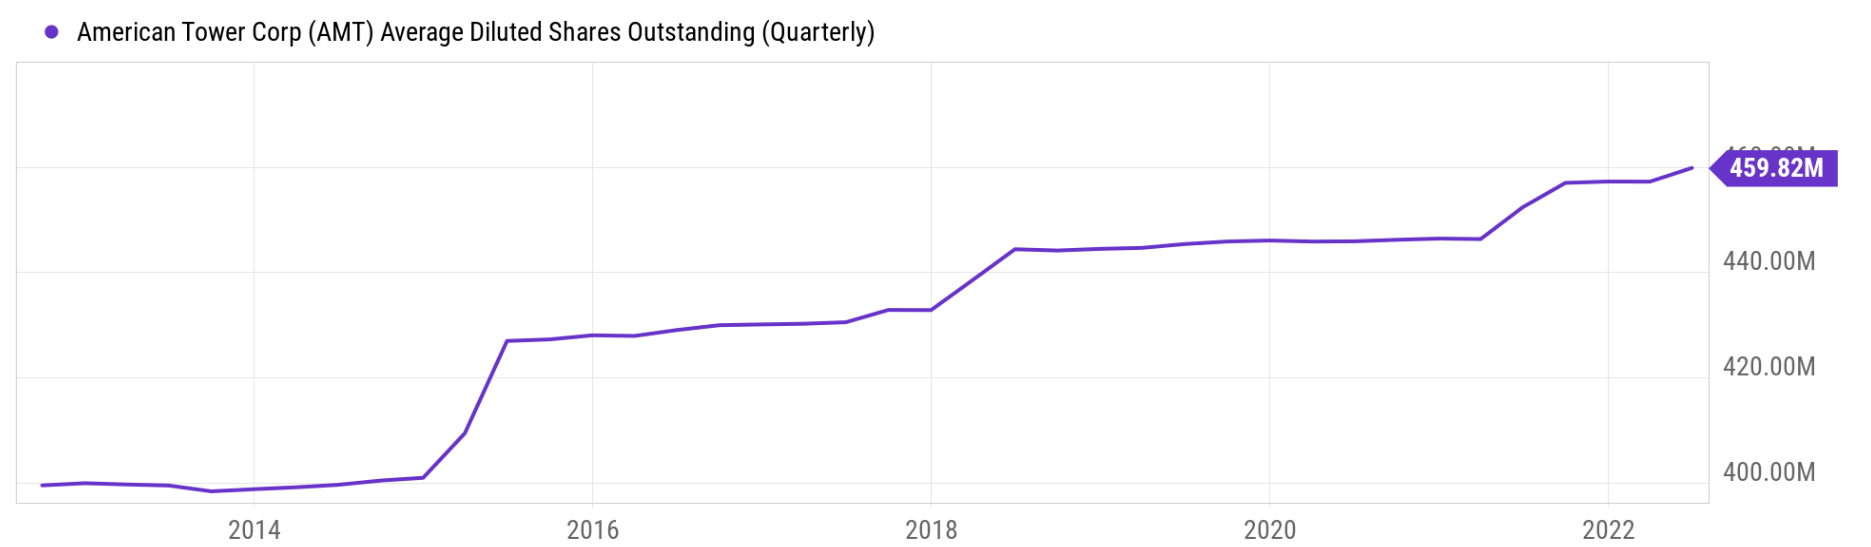
AMT has been following a very disciplined capital allocation approach. As you can see from the following chart, it only issued about 57M new shares in the past decade. Its share counts started at 399M 10 years ago, and now it has only 457 million shares outstanding. This translates into only a 1.3% share dilution per year.
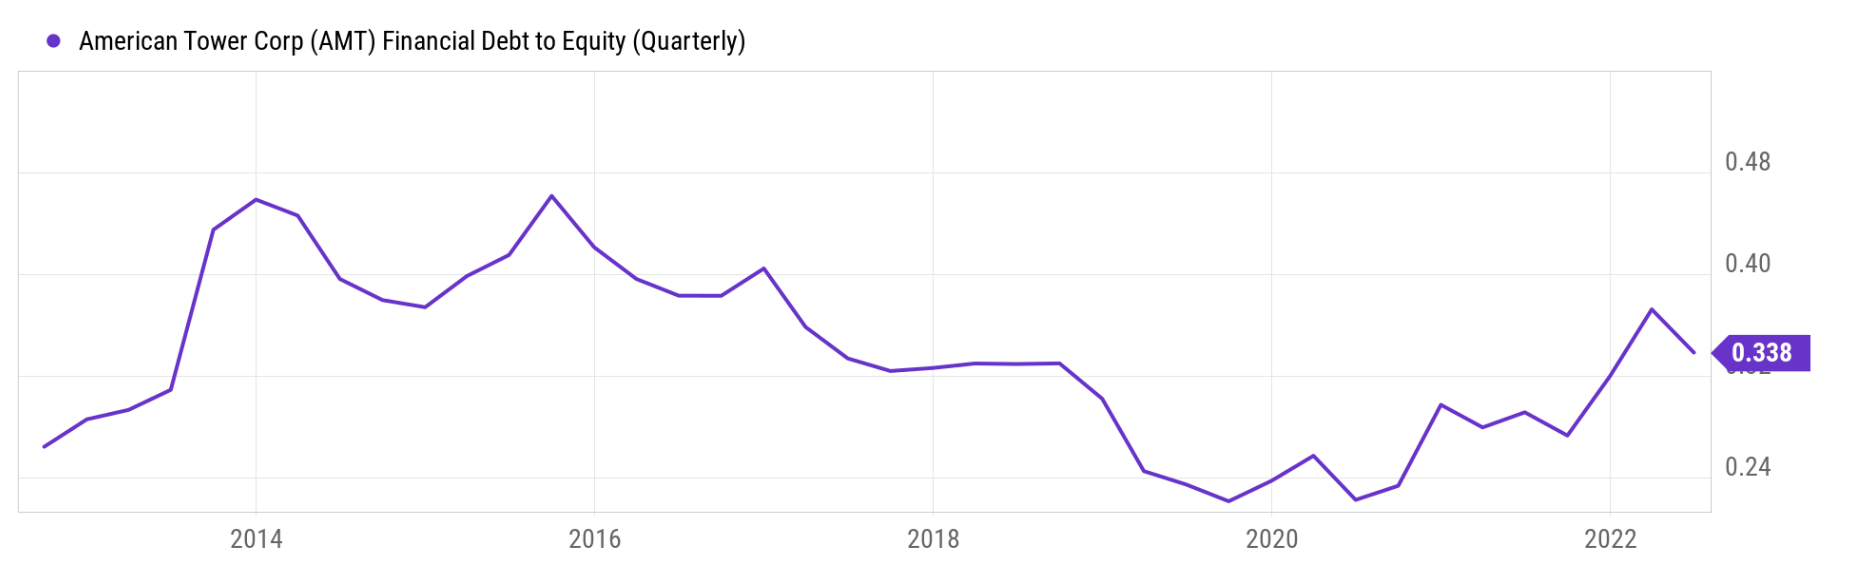
In terms of debt financing, admittedly, long-term debt expanded from about $14.4B in 2013 to the current level of $37B. However, once put under the context of this growing earnings and equity base, it’s in a strong financial position. Its debt-to-equity ratio is only 0.33 currently. As seen in the chart below, its debt-to-equity ratio has been quite stable and fluctuated in a narrow range between about 0.23x and 0.46x with an average of 0.32. And its current ratio of 0.33 is essentially at its long-term average.
Seeking Alpha
Seeking Alpha
The management is very shrewd at allocating capital. And its disciplined approach has been very successful at picking premium assets. A recent example involved the Telxius tower portfolio as CEO Tom Bartlett commented (abridged and emphases added by me)
From a timing perspective, we couldn’t be happier with our acquisition of the Telxius tower portfolio, across Germany and Spain, we’ve seen several quarters of accelerating activity as carriers begin lighting up low and mid-band spectrum with new 5G equipment… At the same time, in Germany, new entrant 1&1 is rolling out a Greenfield 5G network and we believe our portfolio of nearly 15,000 sites, primarily located in urban centers across the country is in a strong position to support their network bill.
Looking forward, I see these premium assets, combined with effective capital allocation, to keep driving double-digit growth.

AMT Q2 ER
AMT: margin expansion likely to continue
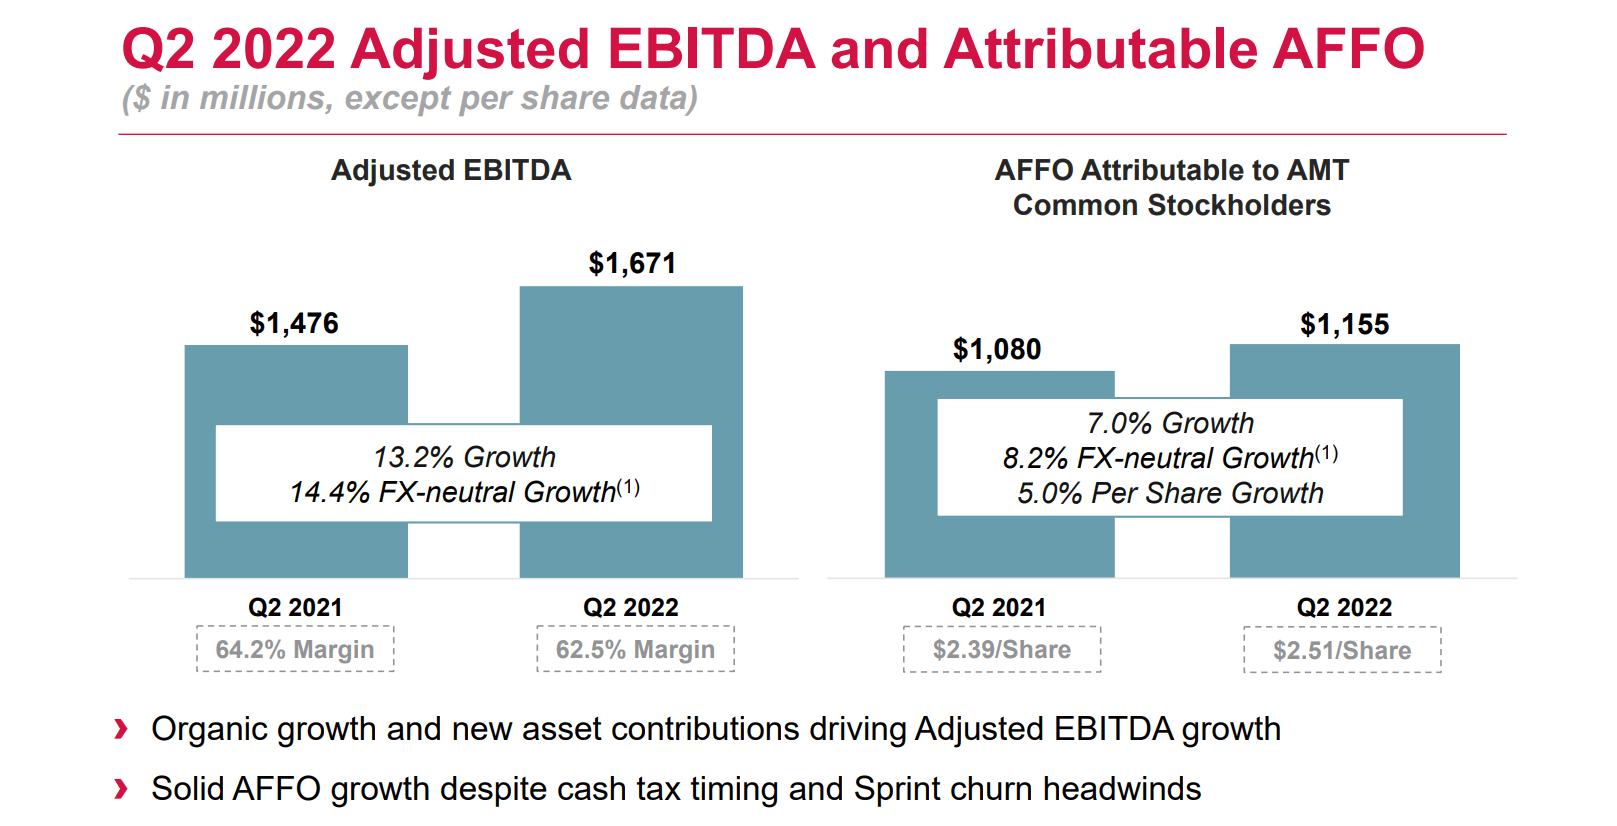
Thanks to its strong portfolio of assets, the business has been expanding its margin consistently. Adjusted EBITDA profit came in at $1.67B during Q2, a 13.2% growth YOY. And the EBITDA margin was 62.5%. Even though there is some margin pressure in the near term as commented by CFO Rod Smith (abridged and emphases added by me), its current margin is near a peak level in a decade as seen in the chart below.
Turning to slide seven, our second quarter adjusted EBITDA grew just over 13% or over 14% on an FX neutral basis to approximately $1.7 billion. Adjusted EBITDA margin was 62.5%, down 170 basis points over the prior year, driven by the lower margin profile of newly acquired assets, the conversion impacts of commenced sprint churn along with higher pasture revenue, resulting from rising fuel costs.
The second chart below puts the 62.5% EBITDA margin under perspective. As seen, the profit margin for AMT has fluctuated between about 52% and 60% with an average of 56% until 2021. Since 2021, its margins have broken out of that range and expanded to the 66% level. Despite the various near-term headwinds, the current EBITDA margin of 62.5% is actually near a peak level in the past 10 years.
AMT Q2 ER

Seeking Alpha
XLRE vs AMT: Dividend yield and earning yield
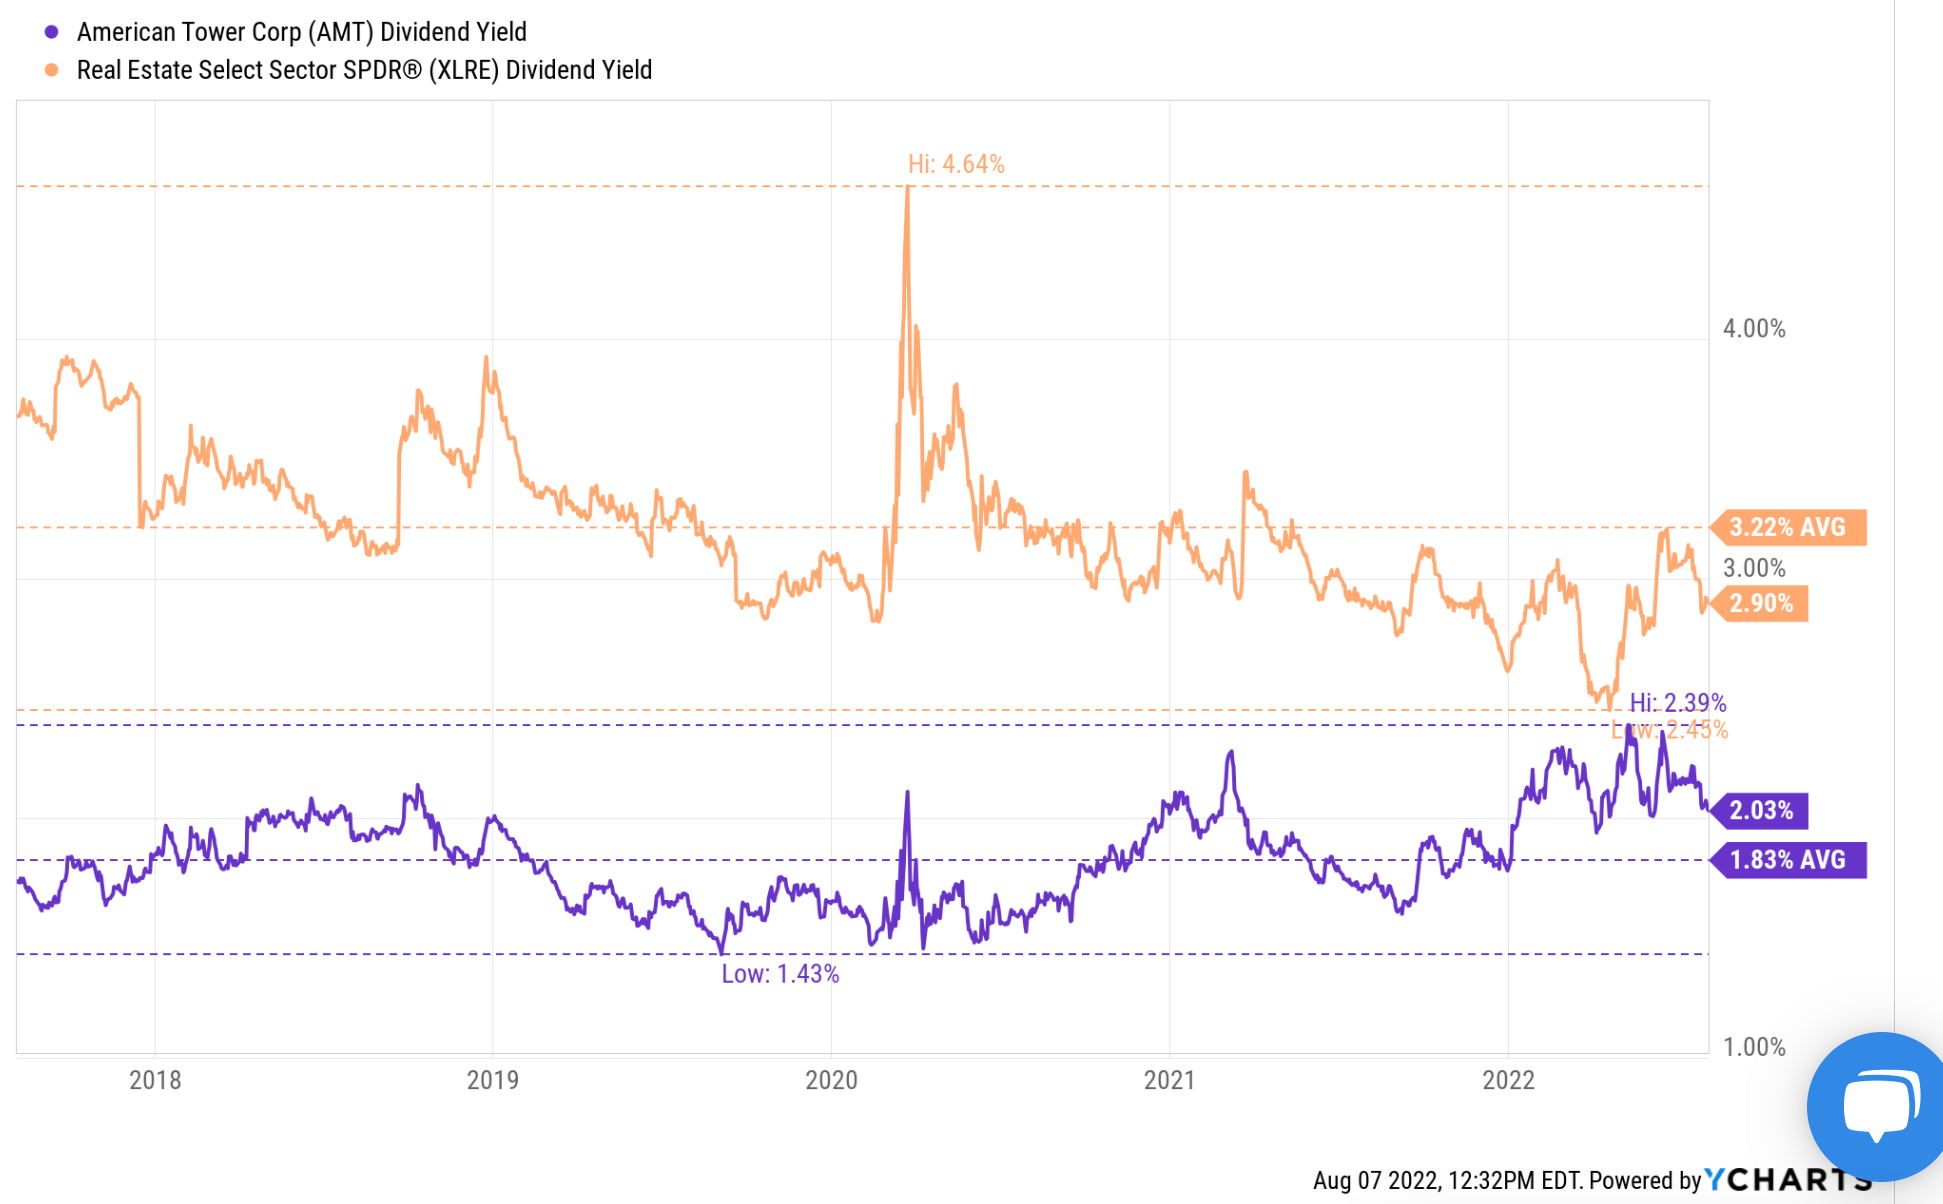
One downside for AMT is its lower dividend yield compared to XLRE as you can see from the chart below. Many investors only consider dividend yield as “yield” – for good reasons. And AMT’s current yield is only 2.03%, far below XLRE’s 2.9% (by almost 30% in relative terms). Admittedly, for investors who seek current income, only a cash dividend matters.
However, here I wanted to bring two observations for long-term investors.
First, in the long-term, earning yield is what really matters. And as aforementioned, measured by cash flow, AMT’s price-to-cash flow multiple is about 27.6x, translating into an earning yield of 3.62%. XLRE’s price-to-cash flow multiple is about 23.8x, translating into an earning yield of 4.20%. The difference is much smaller than the current dividend yields.
Second, XLRE is currently yielding lower than its historical average. As you can see from the following chart, XLRE’s current dividend yield of 2.9% is lower than its historical average of 3.22% by about 11%, signaling an 11% overvaluation. In contrast, AMT’s current dividend yield of 2.03% is higher than its historical average of 1.83% by about 10%, signaling a 10% undervaluation.
Seeking Alpha
Final thoughts and risks
To summarize, we are currently cautious with the overall REIT sector. To us, the sector (for example represented by XLRE) currently has a large valuation risk according to our market sector dashboard. Although we do maintain our bullish rating on AMT. As the sector leader, we see stronger profitability and financial strength. We also see strong growth catalysts both in the near-term (for example, the Telxius acquisition) and in also long-term (ramp up of 5G). At the same time, AMT’s valuation is only about 14% above XLRE in terms of price-to-cash flow ratio. When compared to their historical record, AMT’s current dividend yield is actually 10% higher than its historical average, while XLRE is about 11% lower instead.
Finally, risks. Both AMT and the REIT sector heavily depend on leveraging and are therefore sensitive to interest rate change. In particular for AMT, as aforementioned, there are few headwinds in the new term ranging from the sprint churn and inflation (especially rising fuel costs). Also, as a global business, the business is also sensitive to foreign exchange rates. It is expecting some currency headwinds as commented by CFO Rod Smith (abridged and emphases added by me):
… we have revised our FX assumptions using our standard methodology, which has resulted in … outlook headwinds of approximately 100 million, nearly 50 million, 40 million and roughly $0.08 for property revenue, adjusted EBITDA, consolidated AFFO, and AFFO per share, respectively.
Be the first to comment