

BlackJack3D/iStock via Getty Images
Investment Summary
After a lengthy debate comparing Avanos Medical, Inc. (NYSE:AVNS) [and its recent acquisition of the TriVisc portfolio] to that of Bioventus, Inc. (BVS), we remain neutral on the former.
There are numerous supportive factors within the investment debate for AVNS. However, the stock is trading at 52-week lows and I estimate the alpha opportunity requires a number of moving parts to come together well in order for the market to correct any potential mispricing. Still, there’s plenty to like about in the name, and we are keeping a close eye on the company here at HB Insights. I rate AVNS a hold with a $32 price target.
OrthogenRx acquisition: Hyaluronic acid exposure
One key upside catalyst to AVNS’ share price looking ahead is its recent OrthogenRx acquisition. More on this later. What’s important to note first, is that the acquisition gives AVNS extended exposure to the hyaluronic acid (“HA”) injection segment of the osteoarthritis (“OA”) treatment market. I’ve discussed this market at a high level previously here [see: Exhibit 2; and associated commentary]. This is a relatively concentrated space that has distinct and dominant protocols in situ. With respect to TriVisc, AVNS have confirmed there’s no major differentiators in terms of pharmacology or chemistry within the TriVisc solution itself [it’s sodium hyaluronate].
However, key differentiators look to be centered around reimbursement for the segment, in that AVNS says it is in a better reimbursement position relative to peers.
Chief Executive, Joe Woody, was constructive on this when asked on this during the Q2 earnings call:
Well, primarily, it’s [the better reimbursement position] the way that we priced our product at the wholesale level, not a lot of specialty pharmacies kind of rebating in our business, and that strategically was a way that we focus the business. So we ended up with more favorable reimbursement than all the other three injection products.
With respect to differentiators of the product, he said:
Ultimately, the differentiators are going to come around with servicing, really, we’ve got a portal that we talked about in the script and the way that we service customers and make it easier to do business. And then we have some technology that we’re working on in terms of the syringe that we think will be a differentiator as ultimately, over time, you have to differentiate that way as much of the reimbursement later on in about a year from now will be very similar.
With that, I’ve made some important comparisons between the TriVisc 3 and 5-shot and another holding in our portfolio: Durolane from Bioventus Inc. (“BVS”). There exists an opportunity cost in allocating to both names in order to gain exposure to the same corner of the market.
From previous reports on BVS [see: here and here; Rate buy; PT $9.35], note the following points taken directly from the analyses:
- “Durolane, combined with the Gelsyn protocol, holds >c.20% of the single and 3-injection knee osteoarthritis (“OA”) treatment markets.”
- “As a second-line defence, Durolane could be embedded into the standard of care, vs. directly competing.”
- “Duralone is effective in providing patient analgesia that holds up to 6 months post injection.”
- “[Durolane] is well positioned to capitalise on industry-tailwinds advocating a pivot shift towards single-three injection treatments for OA-related pain.”
- “As a key differentiator, Duralone has the longest residual time in situ (in the joint space of the knee) due to it having the highest molecular weight of any single-injection protocol.”
Durolane is also well researched with numerous publications citing the label in comparative and analytical studies. TriVisc has been available outside of the US since 1995 and commercially in the US since 2019. It too is a high-molecular weight solution of sodium hyaluronate. After its US launch, OrthogenRx noted safety and efficacy was established for the injection via three clinical trials. The first 2 establishing safety were the AMELIA and Young Ping studies, where “the frequency of adverse events was 2.9% which was identical to the frequency in the saline-control group”.
Third was the efficacy study that was established by demonstrating equivalence to VISCO-3. The conclusion from OrthogenRx noted that, the “non-inferiority study served to demonstrate that the magnitude of the treatment effect for VISCO-3 was statistically and clinically comparable to that of the commercially available hyaluronan approved for the same indication for use.”
AVNS begun to book revenues from the segment in June and it will be an interesting set of numbers to follow looking ahead to examine if it is able to steal market share from BVS. The OA injection market is quite lucrative, as mentioned, and is backed by patient age-demographic statistics that look set to continue widening the total addressable market moving forwards.
The company made the acquisition of OrthogenRx on an initial valuation of $130mm less adjustments for working capital. There’s also an additional cash consideration embedded into the deal based on the acquired company’s growth in net sales for FY22 and FY23. It financed the transaction with available cash on the balance sheet and an incremental $125mm tranche on its already existing term loan. Net-net, the purchase resulted in an allocation of $116mm in net assets acquired, consisting of $153mm in identified intangibles and $24mm in goodwill.
Disconnect in fundamentals to price
With that, there’s some important findings to discuss following deeper examination of AVNS’ financials. As seen in Exhibit 1, the company has generated substantial return on its invested capital (“ROIC”) on a sequential basis, over the period from FY19 to date. Here I checked how much net operating profit after tax (“NOPAT”) AVNS has generated from the previous period’s invested capital. On a TTM basis, the company’s ROIC has stretched up ~3.5 percentage points from 10% in Q3 FY19 to 13.6% in Q2 FY22. Meanwhile, quarterly ROIC trends have remained steady over the past 12 months to date.
However, during the same time, the company’s market capitalization has narrowed in from highs seen in FY18, to the current cap observed today, also seen in Exhibit 1 below. This has created a divergence in growth of the company’s bottom-line fundamentals and profitability to where investors have marked its share price. Question is, does this create a potential for correction in the company’s corporate value to the market value prescribed by investors.
Exhibit 1. ROIC trends are favorable for AVNS. There’s a notable divergence between the trajectory of market capitalization and ROIC from FY18-date.
- The question really becomes if the market will recognize this and close this gap.
- The TTM ROIC for last quarter came in at 2.1 turns above the WACC hurdle and compensates for lumpy FCF.
- Whilst profitability continued to stretch up YoY into last quarter, debt also increased ~54% YoY as well.
- However, reduction in capital spend / invested capital sequentially since FY19 with lifting ROIC suggests a lightening capital intensity for AVNS.
Note: All figures are in $mm or [%]. Market Capitalization recorded at end of each period. Return on invested capital calculated using GAAP earnings with no reconciliations. Invested capital represented as quarterly output. Intangible investment exclusive of goodwill. The carrying gross amount of intangibles total is $558.9mm, and it booked $264mm in net intangibles on the balance sheet in the quarter, with $825mm in goodwill. (Image: HB Insights. Data: AVNS SEC Filings)
AVNS earnings shift to pain management
Second quarter earnings reveal interesting trends in the company’s revenue mix. Revenue came in ~890bps higher YoY with a $203mm clip. Chronic care sales narrowed to $112mm, whereas the digestive health business grew c.350bps over the same period last year. Meanwhile, the company booked a 10% YoY compression in its respiratory health segment as its distributors sold down their own stockpiles of inventory during the quarter versus repurchasing through AVNS.
The pain management business was down $1mm YoY, however, at $69mm of sales. Management report “positive contributions” from OrthogenRx through the TriVisc offering. As seen in Exhibit 2, the sales mix has begun to shift towards pain management since FY22, with a higher allocation of both turnover and gross margin. These trends have accompanied a gradual downshift in chronic care margin since FY20. This does provide a favourable earnings tailwind for AVNS looking ahead, should it add additional sales through TriVisc. A summary of chronic care sales is observed in Exhibit 3.
Exhibit 2. Pain management gross margin curled up in FY22 in continuation of long-term trends. The segment continues to advance and could form a solid bedrock for integration of the TriVisc segment.
- Gradual upturn in pain management sales since FY20, large upshift since acquisition of OrthogenRx.
- Gross margin contribution from chronic care continues to narrow alongside this.
Note: Segment sales calculated at quarter’s end using data obtained from AVNS SEC filings. Note, segment gross margin defined as segment sales as percentage of total revenue. Pain management segment includes OrthogenRx contribution since acquisition on 20 January 2022 (Image: HB Insights. Data: AVNS SEC Filings)
Exhibit 3. AVNS Chronic care Q2 FY22 segment sales summary
Image & Data: AVNS Investor presentation Q2 FY22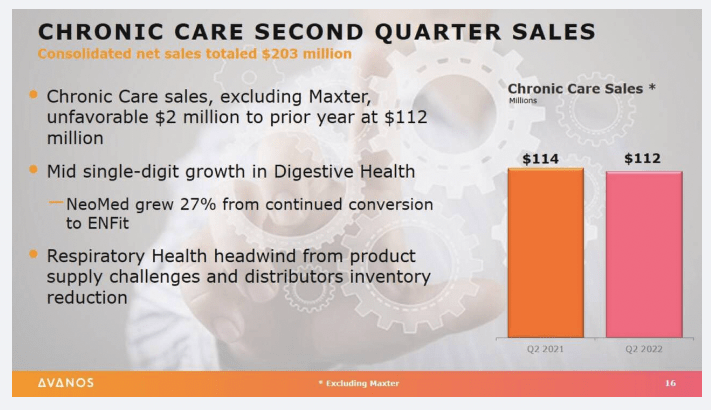
Valuation and conclusion
Shares are currently trading at a discount to book value at a 0.93x P/Book multiple, and are priced at ~1.6x sales, as seen below. Relative to the GICS health care industry peer median, these are at respectable discounts. In addition, the market has priced AVNS at a 21x forward P/E, below the median, implying investors are expecting an above market result from the company in the coming 12 months. Consensus estimates have AVNS to print $825mm in revenue, bringing this down to $127mm in EBITDA and $72mm in net income or $1.53 in EPS. At 21x this estimate this sets a price target of $32.13, around 26% return potential at the time of writing.
Exhibit 4. Multiples and comps analysis.
Note: Earnings and balance sheet data from GICS health care equipment and services industry sourced from Refinitiv Datastream. Est. EPS as consensus of analyst EPS estimates. (Image: HB Insights. Data: HB Insights, Refinitiv Datastream)
There’s a lot to like about in AVNS when performing a deeper dive into its financials to ascertain how much investment it makes, the return on this investment and the earnings tied to the same. What I’ve found is the market is under appreciating the company’s profitability and ability to generate cash from its invested capital. Recent acquisitions and a shift of turnover to the higher revenue pain management segment / OA injection market could be inflected positively in the share price on this basis. Moreover, shares look attractively priced at current multiples, and could potentially offer some upside capture at a $32 price target.
However, the market’s psychology around the stock is low, and we’ve debated at lengths if this is a contrarian indicator or something to stay well clear of. Buying AVNS near its 52-week lows would in fact be going against a heavy downtrend that’s been in situ since March, after the stock tested a flat top of resistance 2x previous to this. For now, I’d like more data on how the company integrates the TriVisc segment into operations and sit on the sidelines with the one for now, seeing as we are holders of a competitor within the same universe.
Be the first to comment