

JHVEPhoto
Automatic Data Processing (NASDAQ:ADP) is the leader in global payroll and human resources outsourcing. ADP has shown strong growth in clients despite the rough times of the last few years. Their client count has risen from 810k+ in FY 2019 to 990k at the end of FY 2022.
ADP provides solutions for just about every kind of back-office roles that a business has. Those solutions allow businesses to focus on what matters most, improving their actual business’ competitive positioning and growth opportunities, while outsourcing the more mundane, although still critical, things such as payroll.
ADP’s solutions run the gamut of a business profile from support for freelancers and small businesses up to Fortune 100 companies. ADP also maintains a global presence with operations in 140 countries around the globe. That additional complexity to navigate multiple geographical jurisdictions gives ADP an advantage compared to smaller operations. That gives ADP a truly global opportunity set.
Their end market is very fragmented between companies doing it on their own as well as smaller competitors. ADP’s previously mentioned scale and years of experience allow ADP to continue to thrive.
ADP’s business is built around client satisfaction and once a client is onboarded they are likely to remain as evidenced by their 92%+ client retention rate for FY 2022. Those relationships are built on quality and consistency of service. As long as ADP performs to satisfactory levels they are likely to retain their clients over time while being able to pass along incremental prices increases as the switching costs to a competitor are quite high. One quick way to anger your entire employee base is to mess up their paychecks.
Dividend History
Dividend growth investing is the strategy that I gravitated towards when I first began investing in individual companies. The strategy is pretty straight-forward: identify businesses that have a history of paying and raising their dividend over time and look for opportunities to purchase shares at attractive valuations.
ADP Dividend History (ADP Investor Relations)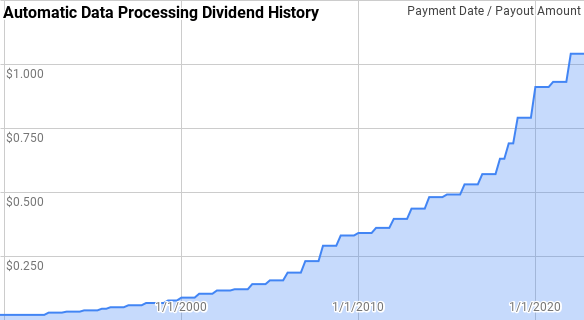
According to the CCC list, ADP has increased dividend for 47 consecutive years. That’s mighty impressive considering that most businesses don’t survive that long; yet, ADP has paid higher dividends every year for nearly half a century.
Dating back to 1990, ADP has given year over year dividend growth spanning from 4.0% to 25.7% with an average of 12.9% and a median of 13.4%.
There’s been 28 rolling 5-year periods since then with annualized dividend growth ranging between 7.6% to 18.8% with an average of 13.0% and a median of 13.4%.
Likewise there’s been 23 rolling 10-year periods with ADP’s annualized dividend growth coming in between 8.6% and 16.2% with an average of 12.9% and a median of 13.6%.
The rolling 1-, 3-, 5-, and 10-year annualized dividend growth rates from ADP since 1990 can be found in the following table.
| Year | Annual Dividend | 1 Year DGR | 3 Year DGR | 5 Year DGR | 10 Year DGR |
| 1990 | $0.0856 | ||||
| 1991 | $0.0969 | 13.1% | |||
| 1992 | $0.1113 | 14.8% | |||
| 1993 | $0.1263 | 13.5% | 13.8% | ||
| 1994 | $0.1450 | 14.9% | 14.4% | ||
| 1995 | $0.1688 | 16.4% | 14.9% | 14.5% | |
| 1996 | $0.1938 | 14.8% | 15.3% | 14.9% | |
| 1997 | $0.2225 | 14.8% | 15.3% | 14.9% | |
| 1998 | $0.2564 | 15.2% | 15.0% | 15.2% | |
| 1999 | $0.2852 | 11.2% | 13.8% | 14.5% | |
| 2000 | $0.3388 | 18.8% | 15.0% | 15.0% | 14.7% |
| 2001 | $0.3950 | 16.6% | 15.5% | 15.3% | 15.1% |
| 2002 | $0.4475 | 13.3% | 16.2% | 15.0% | 14.9% |
| 2003 | $0.4750 | 6.1% | 11.9% | 13.1% | 14.2% |
| 2004 | $0.5400 | 13.7% | 11.0% | 13.6% | 14.1% |
| 2005 | $0.6050 | 12.0% | 10.6% | 12.3% | 13.6% |
| 2006 | $0.7100 | 17.4% | 14.3% | 12.4% | 13.9% |
| 2007 | $0.8750 | 23.2% | 17.5% | 14.4% | 14.7% |
| 2008 | $1.1000 | 25.7% | 22.1% | 18.3% | 15.7% |
| 2009 | $1.2800 | 16.4% | 21.7% | 18.8% | 16.2% |
| 2010 | $1.3500 | 5.5% | 15.6% | 17.4% | 14.8% |
| 2011 | $1.4200 | 5.2% | 8.9% | 14.9% | 13.6% |
| 2012 | $1.5450 | 8.8% | 6.5% | 12.0% | 13.2% |
| 2013 | $1.7000 | 10.0% | 8.0% | 9.1% | 13.6% |
| 2014 | $1.8750 | 10.3% | 9.7% | 7.9% | 13.3% |
| 2015 | $1.9500 | 4.0% | 8.1% | 7.6% | 12.4% |
| 2016 | $2.0800 | 6.7% | 7.0% | 7.9% | 11.3% |
| 2017 | $2.2400 | 7.7% | 6.1% | 7.7% | 9.9% |
| 2018 | $2.5200 | 12.5% | 8.9% | 8.2% | 8.6% |
| 2019 | $3.0600 | 21.4% | 13.7% | 10.3% | 9.1% |
| 2020 | $3.5200 | 15.0% | 16.3% | 12.5% | 10.1% |
| 2021 | $3.7000 | 5.1% | 13.7% | 12.2% | 10.1% |
| 2022 | $4.0500 | 9.5% | 9.8% | 12.6% | 10.1% |
Source: Author; Data Source: ADP Investor Relations
When implementing a dividend growth strategy the safety of the dividend becomes very important. As such I want to see strong dividend growth in conjunction with a stable payout ratio versus earnings or free cash flow.
ADP Dividend Payout Ratios (ADP SEC filings)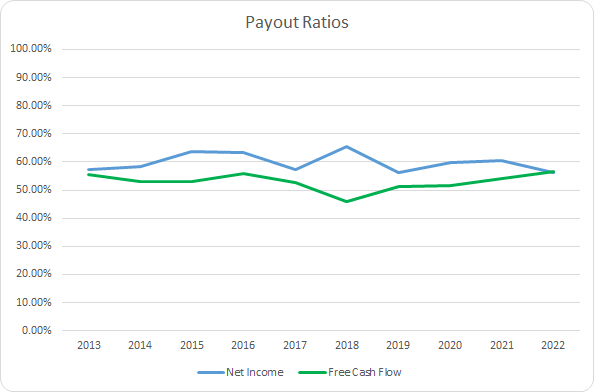
ADP’s net income payout ratio has averaged 59.9% for the last 10 years and 59.7% for the most recent 5 years. Meanwhile ADP’s average free cash flow payout ratios are 53.0% and 51.9%, respectively. ADP has managed to have very strong dividend growth over the last decade with what amounts to a flat payout ratio suggesting the growth has been fully supported by growth in the business.
Quantitative Quality
When adopting long-term investment strategy such as dividend growth investing, the quality of the business is the primary concern. In order to gauge the quality of an enterprise I examine a variety of financial metrics to get an understanding of the strength of the business.
ADP Revenue Profits and Cash Flow (ADP SEC filings)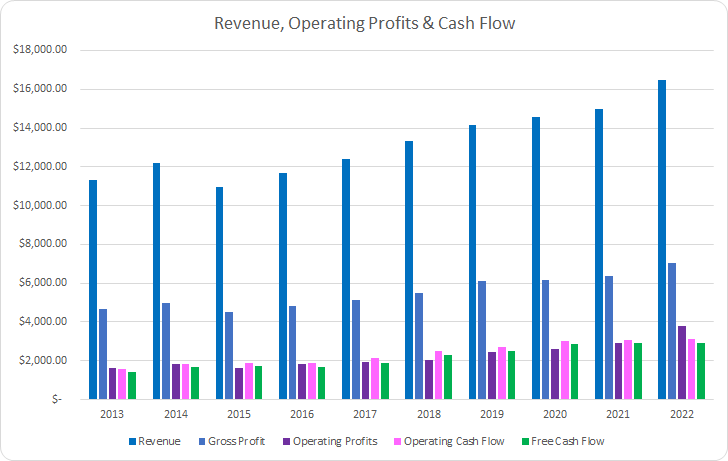
ADP has shown solid revenue growth in light of the fact that they spun-off CDK Global in 2015. From FY 2013 through FY 2022 revenues grew 45.9% in total or 4.3% annualized. Since 2015 the average year over year revenue growth has been 6.1%.
Gross profits rose in similar fashion rising 51.0% in total or 4.7% annualized. Operating profits soared rising 135.0% in total over the last decade or 10.0% annualized.
Meanwhile, operating cash flow rose 96.5% or 7.8% annualized with free cash flow increasing by 102.2% in total or 8.1% annualized.
Good businesses should be able to at least maintain their margins over time and will likely be able to improve them. I prefer to see a free cash flow margin of at least 10% as a sign of a business that is a strong cash generator.
ADP Margins (ADP SEC filings)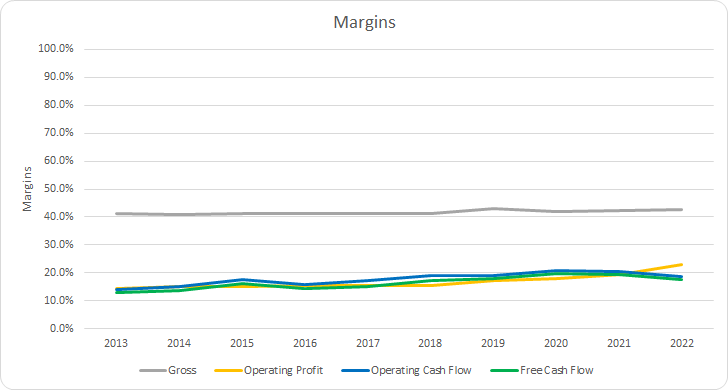
Gross margins for ADP have improved slightly during the last decade; however, for the most part they’ve been stable. The 10-year average gross margin comes to 41.7% with the 5-year average at 42.3%.
With ADP’s free cash flow strongly outgrowing revenue growth over that time it should come as no surprise that free cash flow margins have been on the rise. The 10-year average FCF margin for ADP is 16.4% with the 5-year average coming to 18.4%.
Additionally, I want to find businesses that are able to generate strong free cash flow compared to various measures of capital. My primary focus is on the free cash flow return on invested capital which measures the amount of free cash flow that ADP produces versus the capital invested in the business. Similar to margins, I expect good businesses to at least defend their FCF ROICs and preferably will show rising FCF ROICs over time.
ADP Free Cash Flow Returns (ADP SEC filings)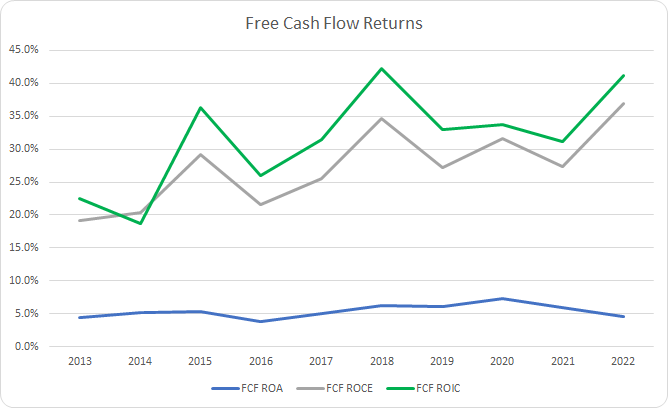
ADP’s FCF ROA is pretty lackluster; however, it’s important to note that includes the large chunk of client cash held on their books in order to perform their duties.
ADP’s FCF ROIC has averaged 31.6% for the last decade with a 36.3% FCF ROIC for the most recent 5 year period. ADP has shown solid improvement in FCF ROIC during the last decade.
To understand how ADP uses its free cash flow I calculate three variations of the metric, defined below:
- Free Cash Flow, FCF: Operating cash flow less capital expenditures
- Free Cash Flow after Dividend, FCFaD: FCF less total cash dividend payments
- Free Cash Flow after Dividend and Buybacks, FCFaDB: FCFaD less net cash used on share issuance/repurchase
ADP Free Cash Flows (ADP SEC filings)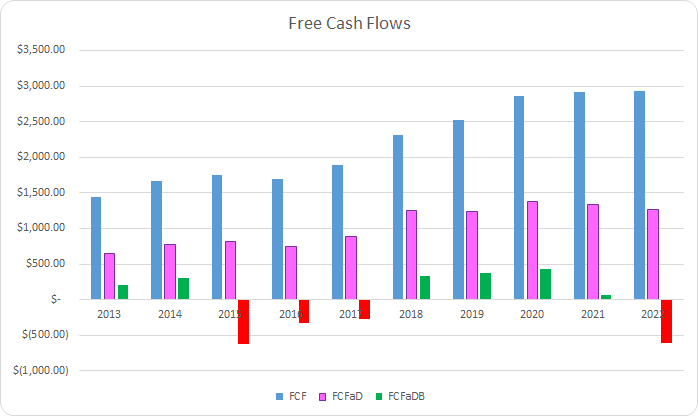
During the last decade ADP has done a solid job growing their FCF and has generated a total of $22.0 B in FCF over that time. ADP paid out a total of $11.6 B to shareholders through dividend payments which puts the cumulative FCFaD for the prior decade at $10.3 B.
ADP has additionally used a large amount of annual FCFaD for repurchase activity. In total ADP has spent a net $10.5 B on buybacks which brings the cumulative FCFaDB to -$0.1 B over that time.
From FY 2013 through FY 2022 ADP has slightly favored dividends compared to repurchases as a means to return excess cash to shareholders. Cumulatively, ADP has return roughly $1.11 via dividends for every net $1.00 for buybacks.
Share buybacks, when done for less than intrinsic value, can be a great boon for remaining shareholders as they reap the benefits of a lower share count as well as the return to intrinsic value.
ADP Shares Outstanding (ADP SEC filings)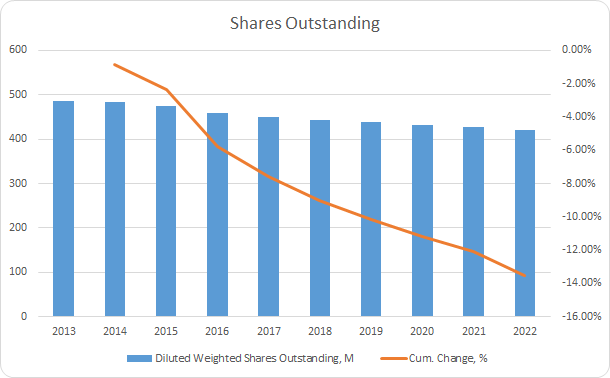
Over the last decade the share count has fallen by 13.6% in total due to the buybacks from ADP. That works out to roughly a 1.6% annual reduction.
Since my goal is to own my stake in a business for the long-term the balance sheet and leverage that a business carries is an important factor in that decision.
ADP Debt to Capitalization (ADP SEC filings)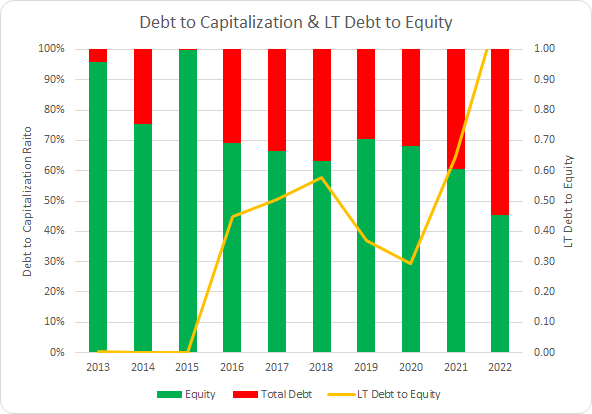
Overall, ADP’s debt-to-capitalization ratio has remained strong; although it has been drifting higher from time. Considering the persistently low interest rates of the prior decade, it was likely a prudent decision to lever up modestly. The 10-year average debt-to-capitalization ratio for ADP is 29% with the 5-year average at 38%.
Additionally, I believe the net debt ratios give a better clue as to the leverage placed on the future earnings or cash flows of a business. The net debt ratios compare the total debt less cash versus a measure of profits or cash flow and let you know how quickly the business could de-lever.
ADP Debt Ratios (ADP SEC filings)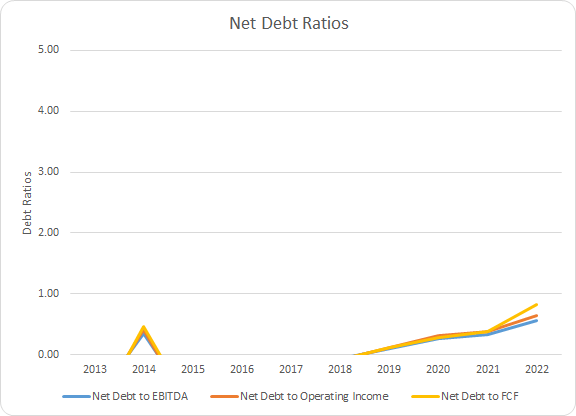
ADP had carried a net cash position in 5 of the last 10 years; although, they have been at a net debt level for the most recent 4 years. The 4-year average net debt-to-EBITA, net debt-to-operating income, and net debt-to-FCF ratios for ADP are 0.3x, 0.4x, and 0.4x. ADP’s debt appears very manageable compared to historic profitability of the business.
How Did We Get Here?
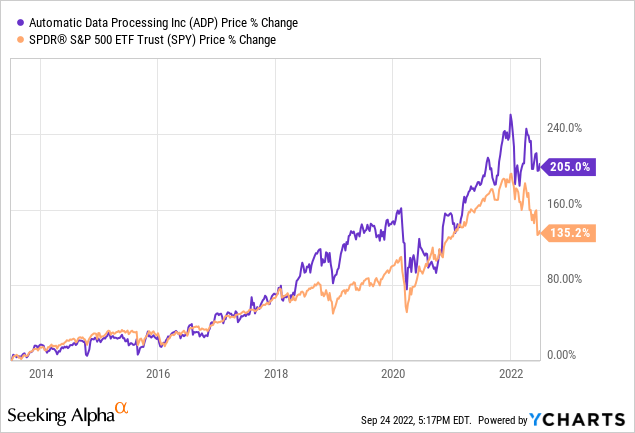
ADP has handily outperformed the S&P 500, via the SPDR S&P 500 ETF (SPY) over the last 9 years. Prior to early 2018 ADP largely tracked along with the SPY; however, since then ADP has generated essentially all of the outperformance. Over that time ADP’s share price has risen by 205.0% or ~11.8% annualized. Add in the 2.5% initial dividend yield and the CAGR was roughly 14.3% annualized for ADP.
While ADP has bested SPY over that time, that doesn’t mean that all of the returns were warranted. As such I try to distill the returns into business performance, capital allocation, and sentiment change.
- Business Returns: Measured by revenue growth and change in net profit margin
- Capital Allocation Returns: Measured by dividend yield and share repurchases
- Sentiment Returns: Measured by the change in starting and ending TTM P/E multiple
From the end of FY 2013 through the end of FY 2022, ADP’s revenue grew by 45.9% which contributed approximately 4.1% to the returns earned over that time. Net profit margin rose markedly from 12.4% to 17.9% which equates to a 43.8% improvement and was accounted for a +3.9% contribution to returns. That brings the total annualized business performance over that time to +8.0%.
For the capital allocation returns the initial dividend yield was 2.5%. As we saw earlier, the share count fell by 13.5% due to the repurchases ADP has made over that time. Share repurchases then accounted for a +1.5% annual return. In total the capital allocation returns work out to 3.9% annually.
Sentiment change is the least sustainable source of returns. ADP’s multiple at the beginning of the period was 23.9x and by June 30, 2022 it had risen to 30.0x. That’s a 25.7% increase in the multiple and brings the sentiment change return contribution to +2.2% annually.
| Annualized Returns | % of Returns | |
| Business Returns | 8.0% | 57% |
| Capital Allocation Returns | 3.9% | 28% |
| Sentiment Change | 2.2% | 16% |
| Total Annualized Returns | 14.2% |
Source: Author
Combined the business and capital allocation returns accounted for an 11.9% annualized return over that time which is 84% of the returns investors earned. That leaves the remaining 2.2% annualized returns from sentiment change which accounts for around 16% of investors’ returns.
ADP Return Breakdown (ADP SEC filings and Google Finance)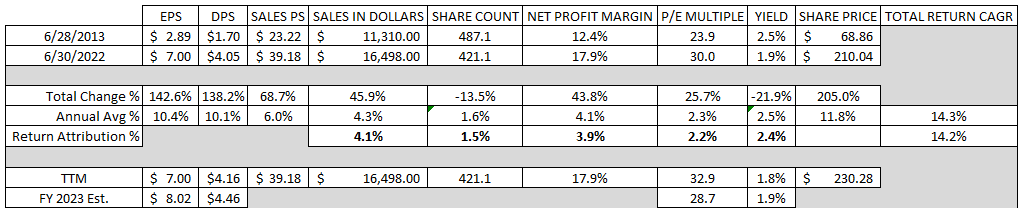
Valuation
ADP is a quality company that I’m glad I own a stake in. With hopes of increasing my position I primarily use three valuation methods to try and home in on a fair value range. The methods that I use are dividend yield theory, a reverse discounted cash flow analysis, and a minimum acceptable rate of return, “MARR”, analysis.
Dividend yield theory is a valuation method built on reversion to the mean and operates under the assumption that over time investors will value the business around a normal dividend yield. For ADP I’ll use the 3-year average forward dividend yield as a proxy for fair value.
Automatic Data Processing Dividend Yield Theory (ADP Investor Relations and Google Finance)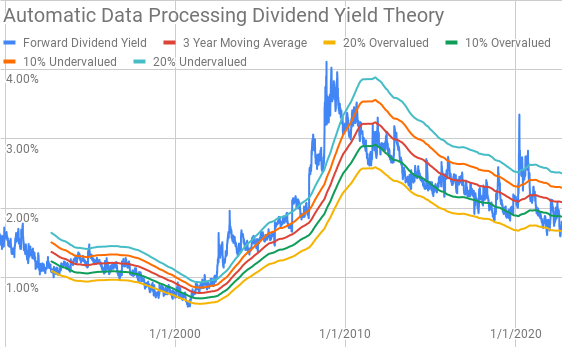
Surprisingly ADP has rarely approached the 20% undervalued yield band. Over the prior decade it’s only reached that level during the worst of the 2020 selloff and prior to that it nearly got there during the early 2019 pullback.
ADP currently offers a forward dividend yield of 1.81% compared to the 3-year average forward dividend yield of 2.09%.
A reverse discounted cash flow analysis can be used to decipher what kind of expectations are built into the current market valuation. In other words you can use the model to figure out what kind of growth and margins that a business must have going forward in order to generate the returns that you seek for your investments.
I use a simplified DCF model built on revenue growth, an initial FCF margin of 17.7% that increases to 20.0% during the forecast period. The terminal growth rate is estimated at 2.5%.
To determine the discount rate I’ve used an estimated after tax cost of debt of 2.9% with a cost of equity of 10% and 8%. That gives a discount rate of 9.7% and 7.8%, respectively.
Under those assumptions, ADP needs to grow revenues 13.7% annually during the forecast period in order to generate the cash flows that would justify a 10% return target or a 9.7% discount rate. With the 8% cost of equity/7.8% discount rate scenario the required revenue growth drops to 8.4% annually over that time.
A MARR analysis requires you to estimate the future earnings and dividends that a business will generate across a given time period. You then apply a reasonable and conservative estimated terminal multiple to establish a potential future share price. Afterwards you calculate the expected return that the business will provide and if it’s higher than your threshold for investment you can feel free to invest in said business.
Analysts expect ADP to have $8.02 in EPS for FY 2023 and $8.93 in EPS for FY 2024. They also expect ADP to be able to show 8.75% annual EPS growth over the next 5 years. I then assumed that EPS growth would slow to 5.0% annually for the following 5 years. Dividends are assumed to target a 55% payout ratio.
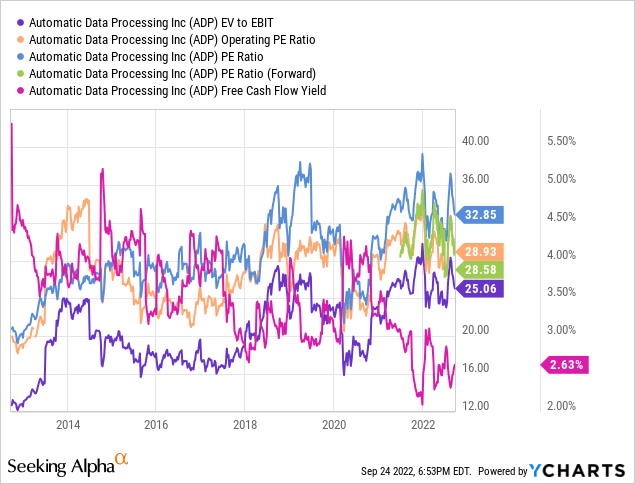
For the expected future multiple I like to see how investors, collectively, have valued ADP over time. Over the last 10 years ADP has typically been valued between ~20x and ~30x TTM EPS.
The following table shows the potential internal rates of return that an investment in ADP could generate if the assumptions laid out above prove to be reasonable estimates of ADP’s future path. Returns assume that dividends are taken in cash and that ADP follows with its historic pay and raise timeline. Shares are assumed to be purchased at $230.28, Friday’s closing price.
| IRR | ||
| P/E Level | 5 Year | 10 Year |
| 30 | 11.0% | 9.1% |
| 25 | 7.4% | 7.4% |
| 22.5 | 5.4% | 6.4% |
| 20 | 3.2% | 5.3% |
| 17.5 | 0.8% | 4.2% |
| 15 | -1.9% | 2.8% |
Source: Author
Alternatively I use the MARR analysis framework to determine what price I could pay for shares today in order to generate the returns that I desire from my investments. My standard hurdle rate is a 10% IRR and for ADP I’ll also examine 12% and 8% return thresholds.
| Purchase Price Targets | ||||||
| 10% Return Target | 12% Return Target | 8% Return Target | ||||
| P/E Level | 5 Year | 10 Year | 5 Year | 10 Year | 5 Year | 10 Year |
| 30 | $246 | $218 | $225 | $185 | $269 | $257 |
| 25 | $209 | $188 | $191 | $160 | $228 | $222 |
| 22.5 | $190 | $173 | $174 | $148 | $207 | $204 |
| 20 | $171 | $159 | $157 | $136 | $187 | $186 |
| 17.5 | $153 | $144 | $140 | $124 | $167 | $169 |
| 15 | $134 | $129 | $124 | $111 | $146 | $151 |
Source: Author
Conclusion
ADP is a great business and one that I’m glad I purchased when I did, although it was unfortunately not in enough size. ADP has shown solid growth with revenues climbing over 4% annually despite a spinoff during that time as well. Since the spinoff average annual revenue growth has been around 6%.
That growth from ADP has also come with improving cash generation which has been a boon to shareholders. Free cash flow margins rose from 12.8% for FY 2013 up to 17.7% for FY 2022. Additionally, ADP’s FCF ROIC has been improving as well hitting greater than 40% for FY 2022.
Dividend yield theory suggests a fair value range for ADP between $182 and $221. However, ADP should announce an increase in November for their January payment. I’m expecting a nearly 10% increase to $1.14 per share which would increase the fair value range to $199 to $243.
The reverse DCF model shows that 10% returns are not likely from the current market valuation as the required growth rate is quite ambitious. Even the 8% return target appears to be pretty optimistic in terms of growth assumptions and the current valuation looks to be around fair value at best.
One thing to note about the reverse DCF model is that they do not account for share repurchases which are likely to continue in the future. Based on the 3-year average FCFaD, ADP could repurchase roughly 1.4% of outstanding shares which subsequently reduces the growth requirements accordingly.
The MARR analysis implies that returns from a purchase at current prices are likely to disappoint unless you expect faster earnings growth and a terminal multiple on the higher side of ADP’s range from the last decade. While I believe that ADP is deserving of a premium multiple it appears risky to me considering that the previous decade had high multiples with what was effectively no interest rates.
Based on a 10% return target 5 years out with a terminal multiple between 17.5x and 22.5x the fair value range for ADP comes to $153 to $190. Reducing the return target to 8% pushes the fair value range higher to between $167 and $207. However, raising it to 12% to give a margin of safety considering the current trajectory of interest rates lowers the fair value range to between $140 and $174.
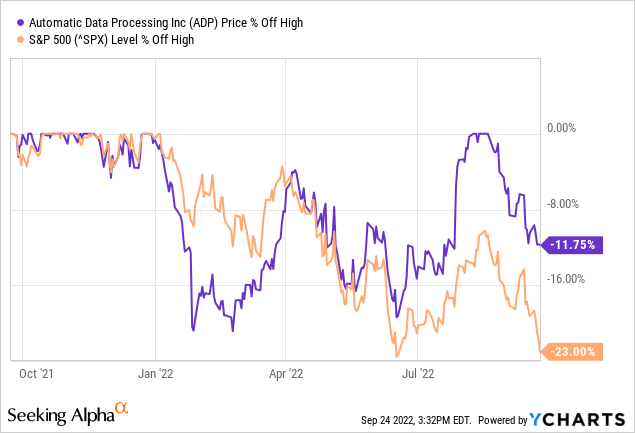
ADP’s share price is currently down roughly 11.8% from its high which surprisingly was reached during the rebound that ended in mid-August. Compared to the S&P 500 which sits at a 23.0% drawdown from the high reached in early 2022.
Given the macro headwinds and calls for recession ADP’s share price has held up surprisingly well. If I had to venture a guess it’s likely because they benefit to some degree from higher rates as they can invest client funds, which act as a float, and higher rates lead to higher interest on those funds.
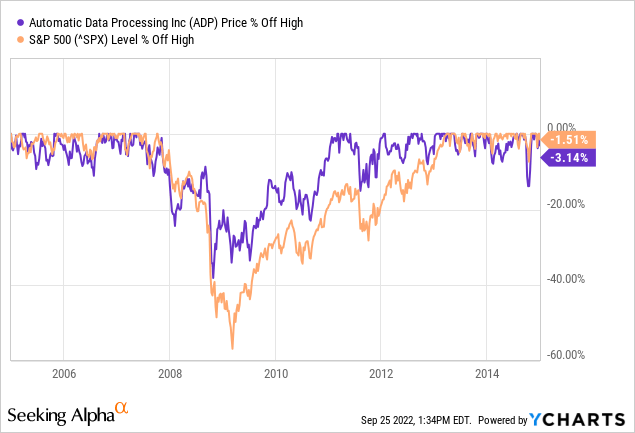
However, looking back the financial crisis of 2007/9, ADP showed pretty strong outperformance compared to the S&P 500 as well. It was still ugly for ADP with nearly a 40% decline in share price; although, the S&P 500 saw a decline closer to 55%. ADP also hit its ultimate low for the period well before the S&P 500.
The opportunity for ADP is big though. For FY 2021 ADP had revenues of $15 B with an estimated TAM of $150 B in HR/outsourcing/payroll…potential. That’s a huge runway for continued growth for ADP even as the largest player in the sector.
Given what I believe is a stretched valuation ADP in conjunction with the macro headwinds and potential recession, ADP is a hold at best. ADP will likely still do fine over time; however, the risk appears to be elevated at this time. Even if a recession with large layoffs is avoided ADP still appears to offer lackluster returns. If ADP pulled back to around $200 or below I believe it would offer a much better opportunity.
Be the first to comment