

Australian Dollar, AUD/USD, China, US Dollar, USD/CNY – Talking Points
- China’s industrial production and retail sales missed forecasts
- The PBOC have a number policy options to offset Covid-19 restrictions
- If the Yuan is allowed to weaken further, what will it mean for AUD/USD?
The Australian Dollar sunk further after a series of Chinese economic activity data crossed the wires earlier today, missing expectations.
Industrial production came in at -2.9% year-over-year to the end of April against 0.5% forecast and March’s print of 5.0%. Retail Sales came in at -11.1%, instead of -6.6% expected and -3.5% previously.
Today’s activity data comes on the back of slowing loan growth data released on Friday. That led to some market participants looking for a modest reduction in the 1-year medium term lending facility rate today.
The Peoples Bank of China (PBOC) left them disappointed, leaving the rate at 2.85%. Over the weekend the PBOC had eased interest rates for first home buyers by 20 basis points to 4.4%.
With strict Covid-19 lockdowns remaining in place for the world’s second largest economy, the growth outlook for China remains a concern for global trade.
The Australian Dollar is vulnerable to these sways in perception of China’s prospects. Shifting risk sentiment had seen a volatile few days for the Aussie and today’s figures appear likely to add to the uncertain outlook.
Prior to the data, markets had been in a risk on mode with equities having started the week on firmer footing.
USD/CNY continues to move higher and is near the top end of the trading band as it flirts with 6.8000. A weakening Yuan will have ramifications for currencies throughout the region, further undermining AUD/USD.
AUD/USD 1 MINUTE CHART
AUD/USD TECHNICAL ANALYSIS
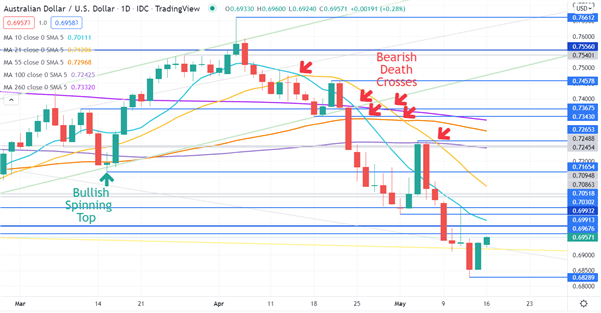
AUD/USD continued to recover on Monday after las week’s sell-off. A series of Death Crosses emerged over several weeks and reveal bearish momentum had been unfolding for a while.
Nearby resistance might be at January’s low of 0.6976 and then further up at the November 2020 low of 0.6992. A further resistance zone could be at 0.7030 – 0.7050, just above the 10-day simple moving average (SMA).
On the downside, support could be at last week’s low of 0.6829.
— Written by Daniel McCarthy, Strategist for DailyFX.com
To contact Daniel, use the comments section below or @DanMcCathyFX on Twitter
Be the first to comment