

Australian Dollar Talking Points
AUD/USD remains within the confines of a head-and-shoulders formation as it retains the opening range for April, but fresh data prints coming out of Australia may sway the near-term outlook for the exchange rate as employment is expected to increase for the sixth consecutive month.
AUD/USD April Opening Range Intact Ahead of Australia Employment Data
The near-term outlook for AUD/USD is clouded with mixed signals as the exchange rate appears to be stuck in a narrow range following the string of failed attempts to close below the neckline, while the Relative Strength Index (RSI) points to a larger rebound in the Australian Dollar as the indicator breaks out of the downward trend from earlier this year.
The update to Australia’s Employment report is anticipated to show the economy adding 35K jobs in March, and the ongoing improvement in the labor market may generate a bullish reaction in AUD/USD as it encourages the Reserve Bank of Australia (RBA) to adopt an improve outlook as “the economic recovery in Australia is well under way and is stronger than had been expected.”
However, an unexpected contraction in job growth may drag on AUD/USD as it puts pressure on the RBA to further support the economy, and Governor Philip Lowe and Co. may continue to endorse a dovish forward guidance as “Board is committed to maintaining highly supportive monetary conditions until its goals are achieved.”
Until then, AUD/USD may continue to consolidate below the 50-Day SMA (0.7713) as it tracks the opening range for April, and it remains to be seen if the decline from the February high (0.8007) will turn out to be a correction in the broader trend or a change in AUD/USD behavior as the recent flip in retail sentiment appears to be dissipating like the activity seen in 2020.

The IG Client Sentiment report shows 53.03% of traders are currently net-long AUD/USD, with the ratio of traders long to short standing at 1.13 to 1.
The number of traders net-long is 6.03% higher than yesterday and 5.43% higher from last week, while the number of traders net-short is 3.13% higher than yesterday and 0.87% higher from last week. Despite the rise in net-long interest, the IG Client Sentiment ratio has narrowed from 1.20 to 1.13 as 54.49% of traders were net-long AUD/USD last week, while the rise in net-short position comes as the exchange rate continues to trade within the confines of a head-and-shoulders pattern.
With that said, AUD/USD may continue to track the monthly opening range ahead of Australia’s Employment report amid the string of failed attempts to close below the neckline,but the decline from the February high (0.8007) may end up being a correction in the broader trend rather than a change in behavior as the RSI breaks out of a downward trend to show the bearish momentum abating.

Recommended by David Song
Learn More About the IG Client Sentiment Report
AUD/USD Rate Daily Chart
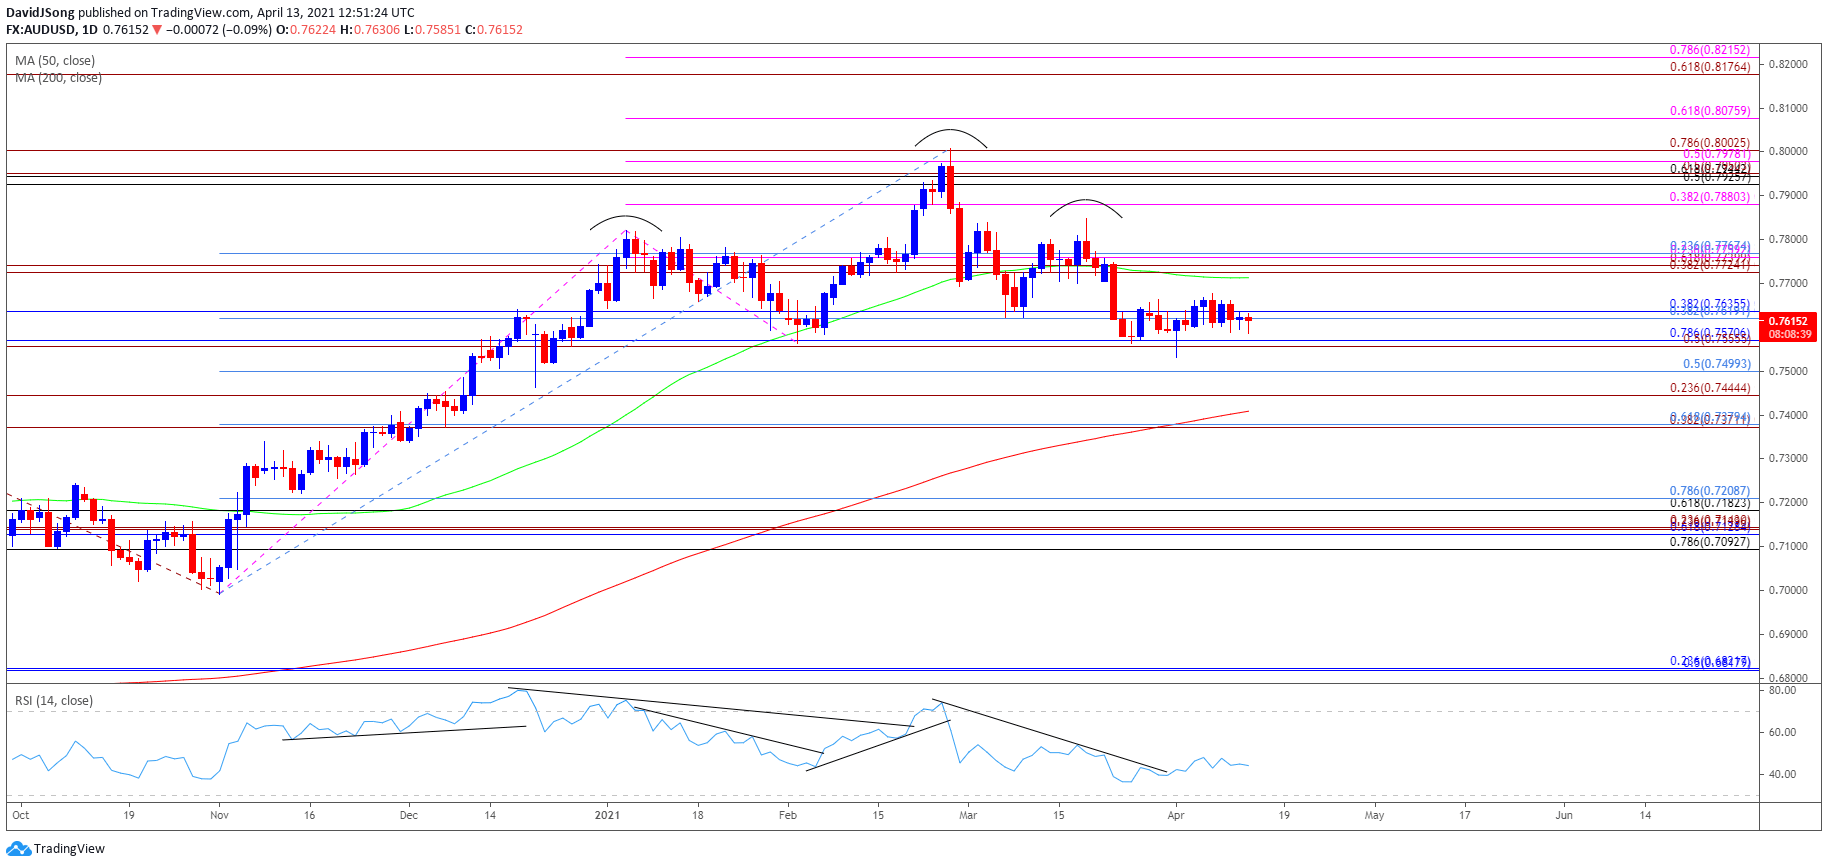
Source: Trading View
- A head-and-shoulders formation has taken shape as AUD/USD trades to a fresh yearly low (0.7532) in April, but need a close below the neckline around 0.7560 (50% expansion) to 0.7570 (78.6% retracement) to open up the downside targets.
- A measured move of the key reversal pattern brings the 0.7440 (23.6% expansion) to 0.7500 (50% retracement) zone within reach, with the next region of interest coming in around 0.7370 (38.2% expansion) to 0.7380 (61.8% retracement) followed by 0.7180 (61.8% retracement) to 0.7210 (78.6% retracement) area.
- However, lack of momentum to close below the neckline may keep AUD/USD within the opening range for April as it attempts to push back above the Fibonacci overlap around 0.7620 (38.2% retracement) to 0.7640 (38.2% retracement),with the next hurdle coming in around 0.7720 (38.2% expansion) to 0.7760 (23.6% expansion), which largely lines up with the 50-Day SMA (0.7713).
- The Relative Strength Index (RSI) highlight similar dynamic as the oscillator reverses course ahead of oversold territory to break out of the downward trend from earlier this year.

Recommended by David Song
Traits of Successful Traders
— Written by David Song, Currency Strategist
Follow me on Twitter at @DavidJSong
Be the first to comment