

AUD/USD is correcting gains from the 0.7150 resistance zone. NZD/USD is also declining and reaching an important support at 0.6450.
Important Takeaways for AUD/USD and NZD/USD
· The Aussie Dollar started a fresh decline from the 0.7150 resistance against the US Dollar.
· There was a break below a key bullish trend line with support near 0.7080 on the hourly chart of AUD/USD.
· NZD/USD also started a downside correction after it failed to clear 0.6540.
· There is a connecting bullish trend line forming with support near 0.6440 on the hourly chart of NZD/USD.
AUD/USD Technical Analysis
The Aussie Dollar gained pace above the 0.7100 resistance zone against the US Dollar. The AUD/USD pair even spiked above the 0.7150 level before the bears appeared.
The pair traded as high as 0.7157 on FXOpen and started a fresh downside correction. There was a clear move below the 0.7120 and 0.7100 support levels. The pair declined below the 50% Fib retracement level of the upward move from the 0.6983 swing low to 0.7157 high.
Besides, there was a break below a key bullish trend line with support near 0.7080 on the hourly chart of AUD/USD. The pair is now trading below 0.7080 and the 50 hourly simple moving average.
On the downside, an initial support is near the 0.7050 level. It is near the 61.8% Fib retracement level of the upward move from the 0.6983 swing low to 0.7157 high. The next support could be the 0.7000 level. If there is a downside break below the 0.7000 support, the pair could extend its decline towards the 0.6940 level.
On the upside, the AUD/USD pair is facing resistance near the 0.7080 level. The next major resistance is near the 0.7100 level.
A close above the 0.7100 level could start another steady increase in the near term. The next major resistance could be 0.7150.
NZD/USD Technical Analysis
The New Zealand Dollar also followed a similar path from the 0.6540 resistance zone against the US Dollar. The NZD/USD pair declined below the 0.6500 support zone.
The bears even pushed the pair below the 0.6480 level and the 50 hourly simple moving average. There was a clear move below the 50% Fib retracement level of the upward move from the 0.6417 swing low to 0.6538 high.
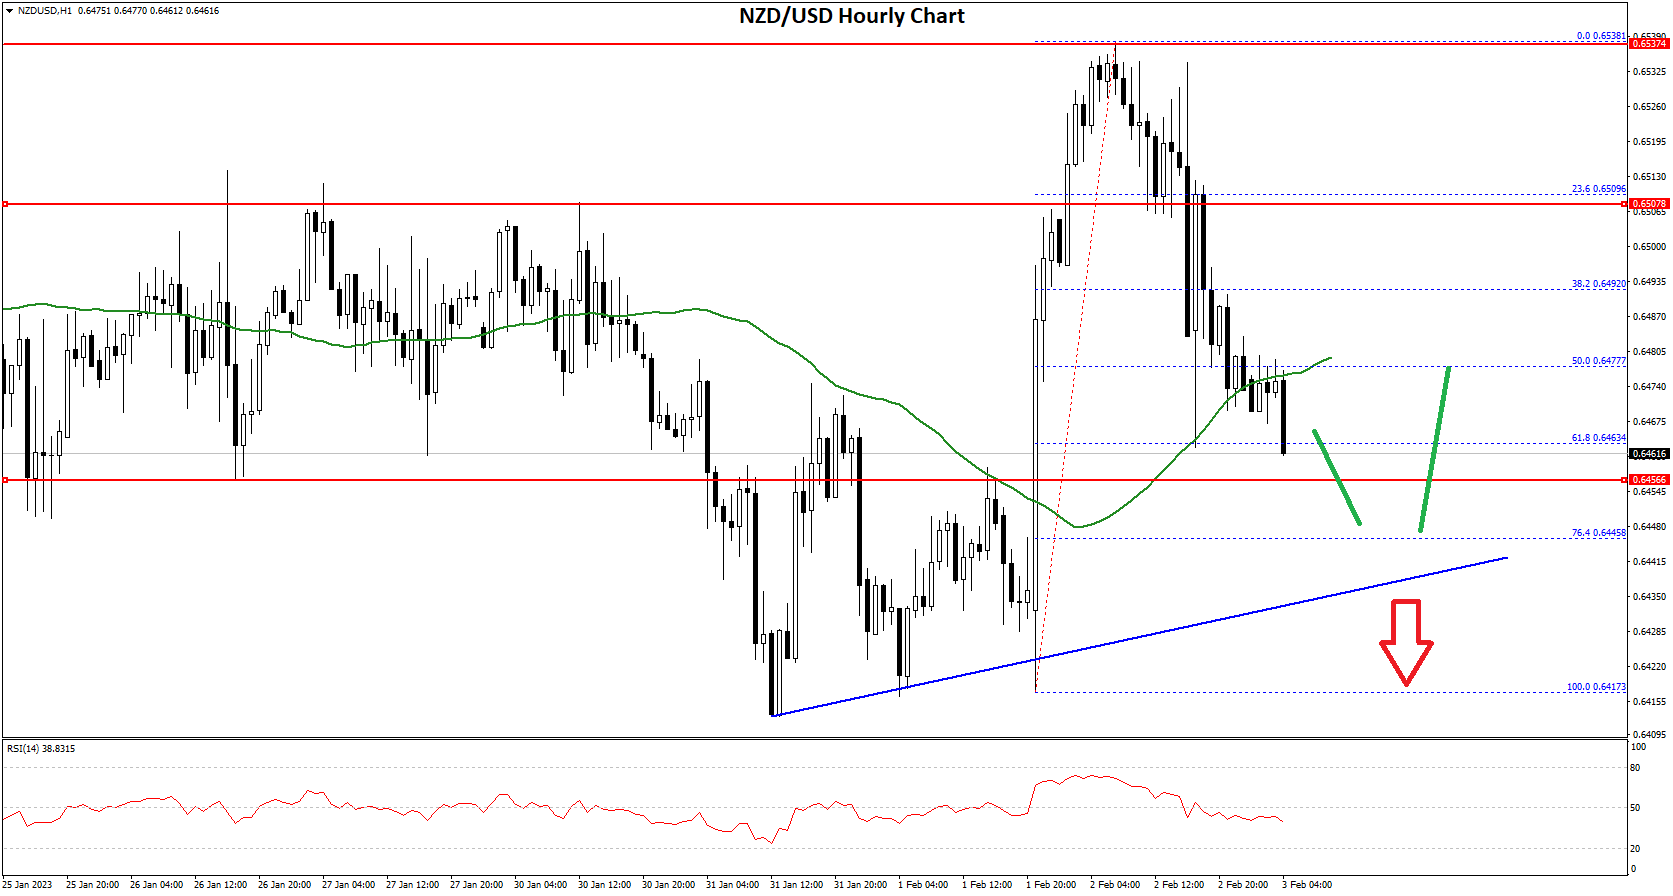
It is now consolidating near the 61.8% Fib retracement level of the upward move from the 0.6417 swing low to 0.6538 high. An immediate support is near the 0.6455 level.
The first major support is near the 0.6440 zone. There is also a connecting bullish trend line forming with support near 0.6440 on the hourly chart of NZD/USD. The next support could be the 0.6420 zone. If there is a downside break below the 0.6420 support, the pair could extend its decline towards the 0.6350 level.
On the upside, an initial resistance is near the 0.6480 level and the 50 hourly simple moving average. The next major resistance is near the 0.6500 level. A clear move above the 0.6500 level might even push the pair towards the 0.6540 level.
Any more gains might open the doors for a move towards the 0.6600 resistance zone in the coming days.
This forecast represents FXOpen Companies opinion only, it should not be construed as an offer, invitation or recommendation in respect to FXOpen Companies products and services or as financial advice.
Trade global forex with the best ECN broker of 2021*.
Choose from 50+ forex markets 24/5.
Open your FXOpen account now or learn more about making your money go further with FXOpen.
* FXOpen International, best ECN broker of 2021, according to the IAFT

Be the first to comment