

AUD/USD gained pace after there was a clear move above 0.7200. NZD/USD is correcting gains, but dips might be limited below the 0.6750 support.
Important Takeaways for AUD/USD and NZD/USD
· The Aussie Dollar started a steady rise above the 0.7200 resistance against the US Dollar.
· There is a key bullish trend line forming with support near 0.7135 on the hourly chart of AUD/USD.
· NZD/USD rallied towards the 0.6840 level before there was a downside correction.
· There was a break above a major bearish trend line with resistance near 0.6765 on the hourly chart of NZD/USD.
AUD/USD Technical Analysis
The Aussie Dollar started a major increase after it formed a base above the 0.7100 level against the US Dollar. The AUD/USD pair gained pace for a move above the 0.7200 for sustained upward move.
The pair even broke the 0.7220 resistance zone and the 50 hourly simple moving average. It traded as high as 0.7223 on FXOpen before it started a downside correction. There was a move below the 0.7210 and 0.7200 levels.
The pair traded below the 23.6% Fib retracement level of the upward move from the 0.7093 swing low to 0.7223 high. The pair is now testing the 0.7155 level and the 50 hourly simple moving average.
It is finding bids near the 50% Fib retracement level of the upward move from the 0.7093 swing low to 0.7223 high. There is also a key bullish trend line forming with support near 0.7135 on the hourly chart of AUD/USD.
If there is a downside break below the 0.7135 support, the pair could extend its decline towards the 0.7100 level. On the upside, an immediate resistance is near the 0.7180 level.
The next major resistance is near the 0.7200 level. A close above the 0.7200 level could start a steady increase in the near term. The next major resistance could be 0.7250.
NZD/USD Technical Analysis
The New Zealand Dollar also followed a similar path from the 0.6700 zone against the US Dollar. The NZD/USD pair traded above the 0.6750 and 0.6760 resistance levels.
The pair even broke the 0.6800 barrier and the 50 hourly simple moving average. A high was formed near 0.6833 before there was a downside correction. There was a move below the 0.6810 and 0.6800 levels.
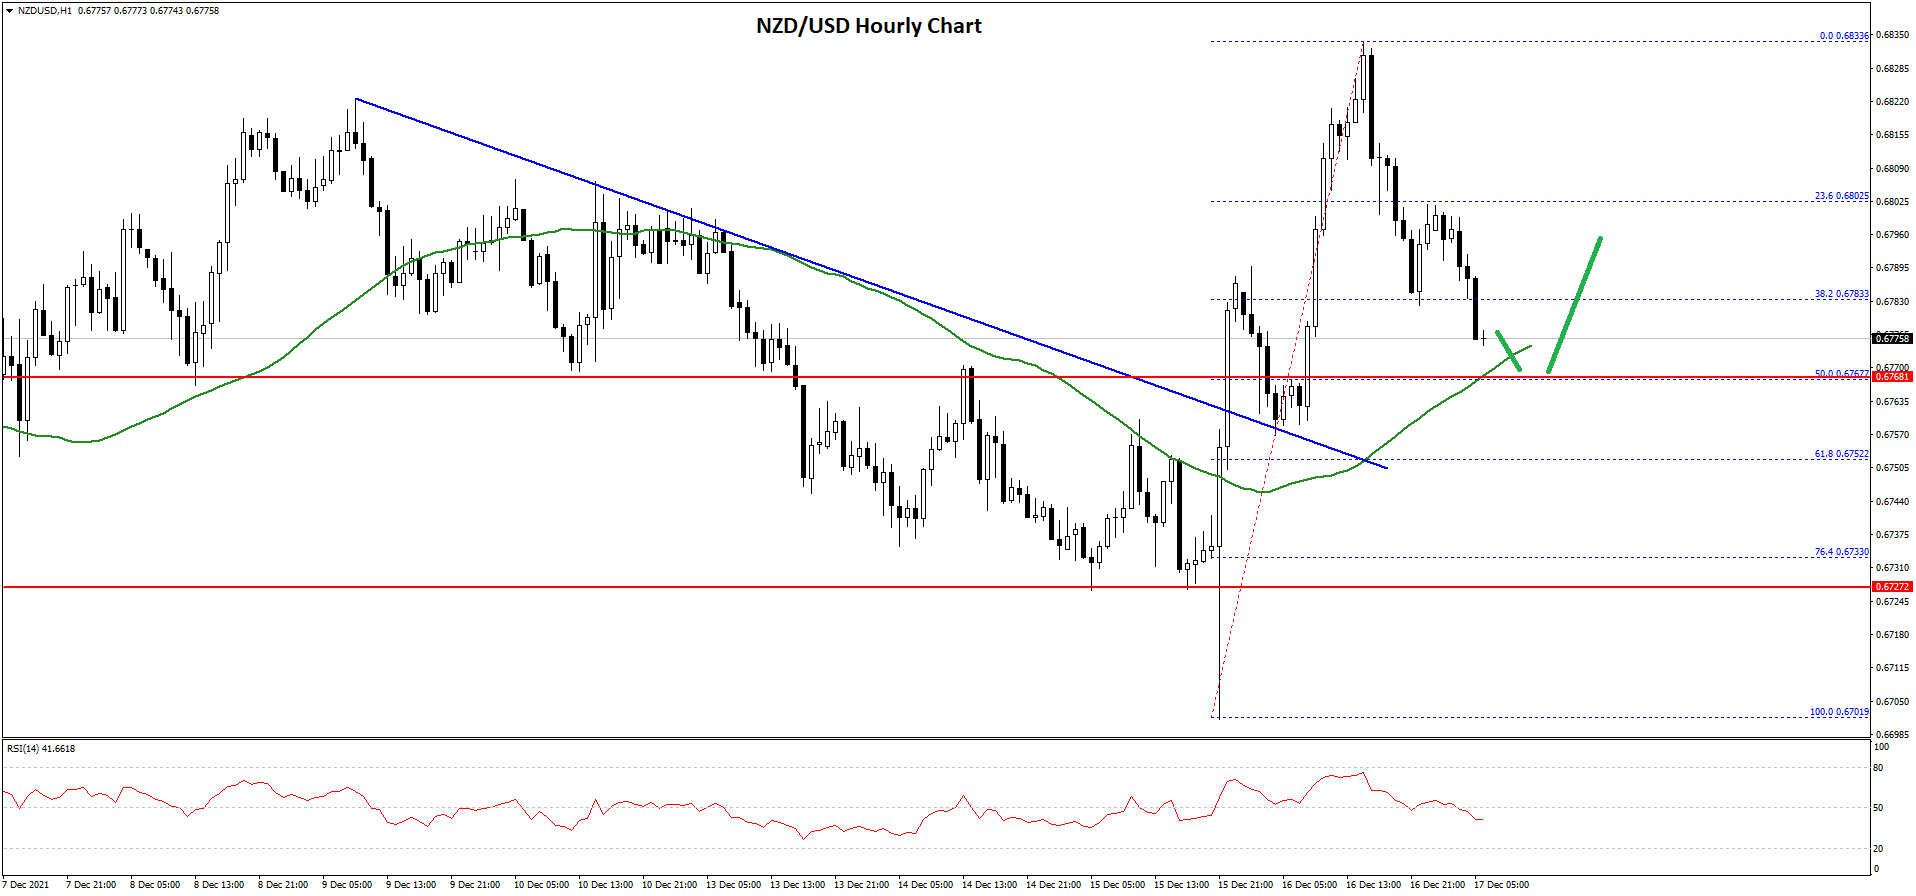
The pair traded below the 23.6% Fib retracement level of the upward move from the 0.6701 swing low to 0.6833 high. The pair is now testing the 0.6670 level and the 50 hourly simple moving average.
The first key support is near the 0.6765 level. It is near the 50% Fib retracement level of the upward move from the 0.6701 swing low to 0.6833 high. The next major support is near the 0.6750 level. If there is a downside break below the 0.6750 support, the pair could extend its decline towards the 0.6700 level.
On the upside, an immediate resistance is near the 0.6785 level. The next major resistance is near the 0.6800 level. A close above the 0.6800 level could start a steady increase in the near term. The next major resistance could be 0.6840, above which the pair could rise steadily towards the 0.6900 level in the near term.
This forecast represents FXOpen Markets Limited opinion only, it should not be construed as an offer, invitation or recommendation in respect to FXOpen Markets Limited products and services or as financial advice.

Be the first to comment