

Darren415
This article was first released to Systematic Income subscribers and free trials on Sep. 5.
It’s fair to say that one takeaway for income investors this year is that a lot of the bread-and-butter income sectors took significant losses. This even includes many of the higher-quality assets such as investment-grade bonds which normally outperform during market downturns.
In this article, we take a bird’s eye view of the income space to see how various sectors have performed year-to-date and what yields they are currently offering. We then focus specifically on sectors that have remained relatively resilient and offer attractive yields.
The key table that we will refer to in this article is the following. It comes from an unremarkable mortgage REIT Orchid Island (ORC). It shows a number of various income sectors, their total return over the first half of 2022 and their credit spreads.
Orchid Island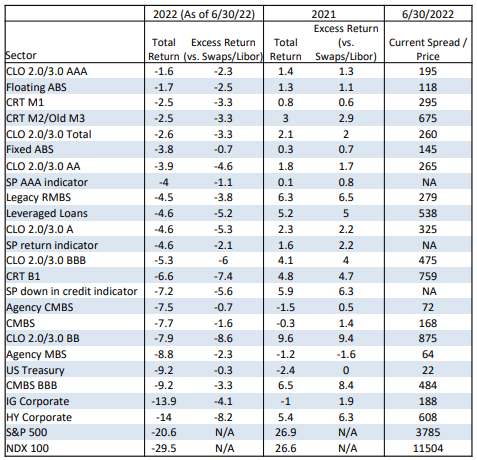
As we discuss below, there are probably quite a few sectors that income investors are ignoring which have been pretty resilient and which can also offer diversification in income portfolios. We focus specifically on a trio of these sectors.
Another key takeaway is that the relationship between sector yield and sector drawdown has not been linear – some sectors boast very attractive yields but have also outperformed this year. And while the future does not have to look exactly like the first 8 months of 2022, it is fair to say that the market remains under the same kind of pressure that we saw at the beginning of the year – an increasingly hawkish Fed, a persistently high level of inflation and a slowing macro picture. This suggests that the lessons of 2022 should not be dismissed for investors looking to build robust income portfolios.
A Focus On A Trio Of Sectors
In this section, we highlight three sectors that have caught our eye: CLO Debt, non-agency RMBS/CRT and ABS. We first quickly introduce these sectors as they are not quite household names for most income investors and we then place their performance and yields in a broader context using the data from Orchid Island.
CLO 2.0/3.0 are collateralized loan obligation securities which are basically pools of loans that are split into different slices with varying yields and levels of protection. More senior CLO tranches have lower yields and more protection and vice-versa with CLO Equity being the highest-yielding / riskiest piece. CLO Debt securities are floating-rate.
CLOs, which performed very well through the GFC (even the CLO Equity piece did well over the cycle), are often confused with CDOs which fared poorly so it makes sense to distinguish the two. This is a good introductory primer to the CLO structure. Although it sounds esoteric, it is fairly commonplace in family office investments and pension funds.
PineBridge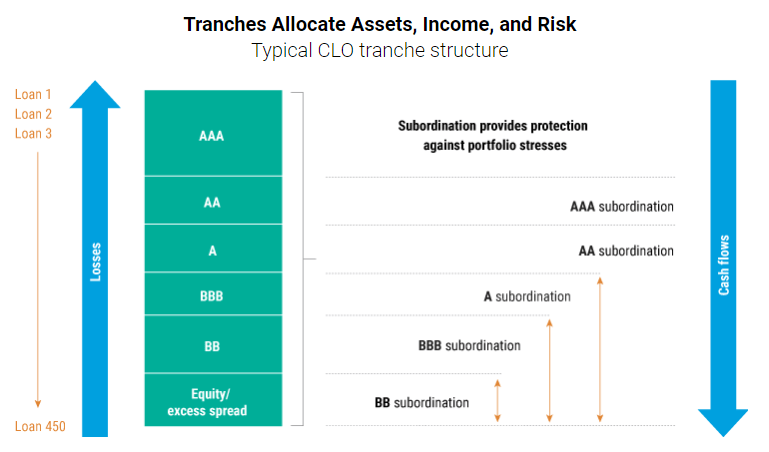
The 1.0 vs 2.0 vs 3.0 “versions” refer to different CLO types which carry higher levels of protection for the senior pieces, i.e. Debt, i.e. rated tranches. CLO 1.0 originated in the 1980s-90s and was the standard structure through the GFC. CLO 2.0 began after the GFC and strengthened some of the credit support of the structure. CLO 3.0 kicked off in 2014 and made a number of amendments such as eliminating high-yield bonds and adhering to the Volcker rule, among others. This vintage is now the standard in the market.
Historic performance of rated CLOs (i.e. those above the CLO Equity piece) has been strong. According to S&P, zero investment-grade CLO tranches have defaulted over the last decade. Out of the 1300 CLO tranches rated by the firm from 2010 to 2021, only 5 have defaulted – these were rated either BB or B.
It is true that some of the recent loan issuance has not been as strong. There are concerns about cov-lite documentation, more loan-only issuers (having less unsecured debt as shock absorbers), EBITDA add-backs which create aggressive leverage estimates, collateral stripping, incremental facilities and other pieces of financial engineering which have reduced the quality of the loan sector.
That said, loans underlying CLOs are higher-quality than the broader sector (due to the CCC-bucket test). Plus, CLOs are designed to be dynamic in responding to any deterioration in portfolio quality in order to protect the rated CLO Debt tranches.
There are not many funds that focus on the CLO Debt space. They are:
- Janus Henderson AAA CLO ETF (JAAA) is focused on the AAA or highest-rated CLO tranches. It has an SEC yield of 2.7% and a distribution yield of 1.3%
- VanEck CLO ETF (CLOI) allocated primarily to AA-rated CLOs. It has a SEC yield of 4.3% and a distribution yield of 3.6%.
- Janus Henderson B-BBB CLO ETF (JBBB) allocated primarily to BBB-rated CLOs. It has a SEC yield of 5.1% and a distribution yield of 3.1%.
- The Eagle Point Income Company (EIC) allocates mostly to BB-rated CLOs with a dose of CLO Equity to boot. It trades at a current yield of 9%.
CRT or Credit Risk Transfer securities carry the risk of US residential mortgages. After the GFC, the US government looked for a way to derisk the business profile of its housing agencies and settled on the so-called CRT securities as a way to partially offload the household credit risk to the broader market. The schematic below shows how CRT securities work. The basic idea is that losses from mortgage defaults flow from the bottom-up with lower / higher-yielding tranches in the CRT structure absorbing losses first while the agency retains some skin in the game across the entire structure.
The CRT structure itself looks similar to the CLO structure where losses eat through the capital structure. B-1 and B-2 tranches take the first losses, followed by M-2 and M-1 tranches.
NB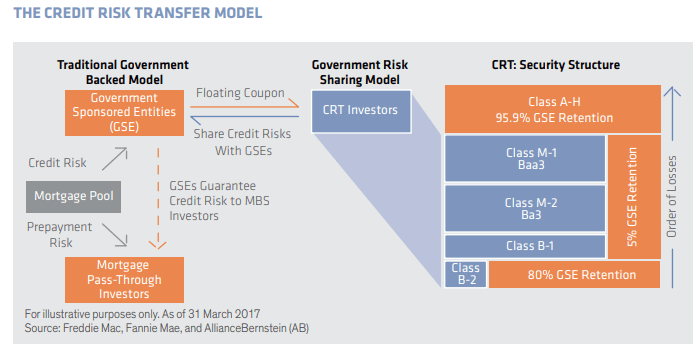
The legacy non-agency RMBS set of securities, on the other hand, are those that were mostly issued prior to the GFC. This market continues to shrink as it has been largely replaced by CRTs.
NB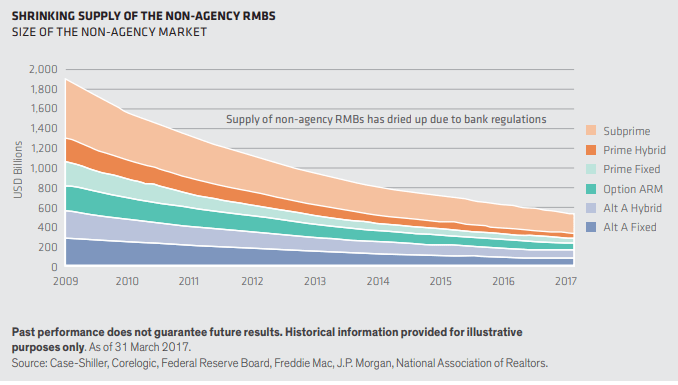
As is the case with the CLO sector, there are not many funds that allocate exclusively or even primarily to this sector. The majority of mortgage funds are focused on the better-known agency MBS sector.
Some of the funds that allocate primarily to the non-agency sector are:
- Western Asset Mortgage Opportunity Fund (DMO)
- Angel Oak Multi-Strategy Income Fund (ANGLX)
- AlphaCentric Income Opportunities Fund (IOFAX)
- Deer Park Total Return Credit Fund (DPFAX)
The last 3 funds above are mutual funds and it’s worth highlighting that the mutual fund structure can struggle with the relatively illiquid assets in the sector, particularly on the lower-quality spectrum that IOFAX allocates to.
The ABS / CMBS sectors are various asset-backed (e.g. credit card receivables, home equity loans, student loans, auto loans, etc.) and commercial mortgage backed-securities. Similar to the CLO structure there is a large pool of individual securities and this pool is tranched by different risk profiles which then trade at different yields.
Some of the funds in this sector are:
- Virtus Newfleet ABS/MBS ETF (VABS)
- Pioneer Securitized Income Fund (SIFFX)
- Nuveen Mortgage and Income Fund (JLS)
A Bird’s Eye View Of The Income Space
Most income investors are interested in not just the yield they can achieve on their holdings but also the relative resilience of their holdings. It’s no good earning a 10% yield if the portfolio’s longer-term return ends up being 3% through-the-cycle.
Let’s have a look at how the various credit sectors look with respect to their current estimated yield (y-axis) and their total return over the first half of the year (x-axis). Credit yields have fallen since June (the date the table above references) primarily as credit spreads have compressed so we adjust spreads lower by about 20% (roughly the amount of compression since 30-June we see in HY corporate bonds).
The more appealing quadrant of higher yields and better return is highlighted in green and the less appealing quadrant is highlighted in red.
Systematic Income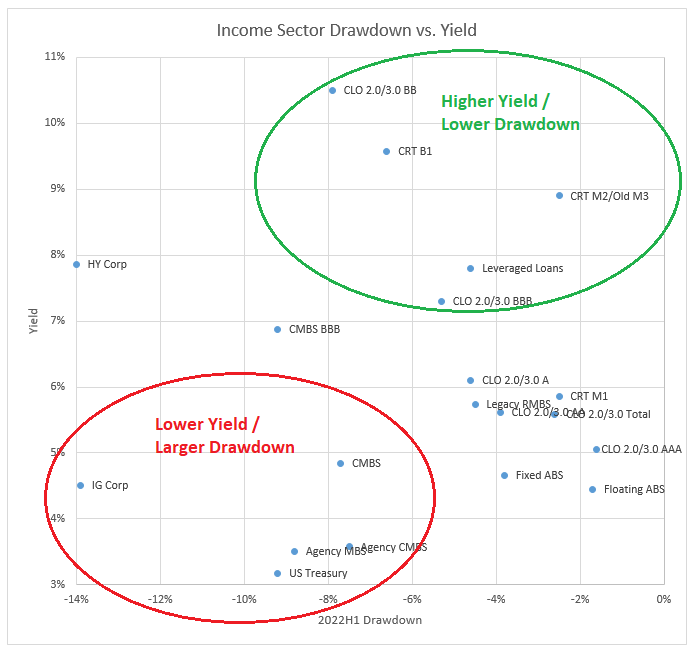
Obviously, investors need to be careful here with extrapolating performance. Just because a sector fell very hard doesn’t necessarily make it unattractive. It’s also important to point out that just because a sector was resilient this time around may not mean it will be resilient in the next market shock since market shocks are not all alike. That said, there is still a lot of utility in looking at this proof-is-in-the-pudding kind of numbers.
What we see is that a number of CLO and CRT sectors look quite attractive with ABS sectors being even more resilient though lower-yielding. These sectors boast decent yields with outperformance to boot. On the other hand, some of the traditionally “safer” sectors like investment-grade bonds and agency MBS don’t look very attractive in the chart.
Stance and Takeaways
The purpose of the article is to provide some allocation ideas for investors managing income portfolios. Specifically, it is to highlight that some of the more niche sectors can look much more attractive than the bread-and-butter or even “safer” sectors that traditionally make up investor portfolios.
The other takeaway is to think in terms of sector allocation rather than “best funds” since even the “best fund” in whichever sector will find it difficult to swim against the current of an unfavorable market environment that drags its entire sector lower.
Finally, investors should think in terms of multiple scenarios rather than a single axis of yield or quality. For instance, investors should be prepared for various potential outcomes such as higher or lower interest rates and higher or lower credit spreads. Investors who allocate in a bottom-up manner by building portfolios from individual securities that they like the look of may end up with undiversified portfolios whose performance can disappoint.
Here we also highlight a number of funds that tap into each of the three attractive and resilient sectors discussed above: CLO Debt, ABS and non-agency MBS.
In the CLO Debt space, we like the Janus Henderson B-BBB CLO ETF (JBBB) which allocates primarily to investment-grade CLO Debt securities. The fund has a 3.1% distribution rate and a 5.1% SEC yield. The fund’s income will continue to increase in line with further rises in the Fed policy rate. The fund is down around 6% year-to-date including dividends.
A CEF which allocates to both ABS and CRT sectors is the Nuveen Mortgage and Income Fund (JLS), trading at a 5.9% yield and a 14.4% discount. About 40% of the portfolio is in investment-grade rated securities and about half the fund is in floating-rate securities which will help to drive fund income higher. The fund has a modest duration of 2.4 and carries 29% of leverage. JLS has delivered a -7.6% total NAV return this year which has outperformed the multi-sector CEF space by about 5%. The discount is trading cheap to the sector average.
Systematic Income CEF Tool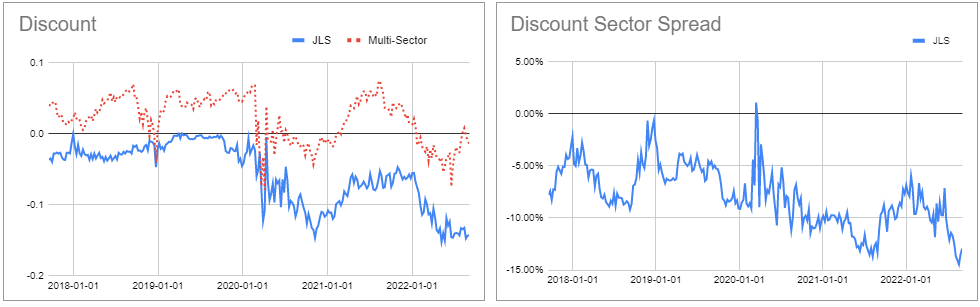
Finally, we continue to like a fund that is focused mostly on the non-agency RMBS sector – the Western Asset Mortgage Opportunity Fund (DMO). DMO is trading at a 10.1% current yield and a 10.3% discount. Its total return this year of -8.2% is about 4% better than the broader Multi-sector CEF space and about 5% better than the average taxable PIMCO CEF. The fund holds around 80% in floating-rate securities so its income will continue to benefit from higher short-term rates.
Be the first to comment