

5G Sunset Cell Tower: Cellular communications tower for mobile phone and video data transmission bjdlzx
AT&T Inc. (NYSE:T) has been getting a lot of negative coverage due to its debt levels. Is it too high, is it too low, given the nature of its industry? The question remains, what is the optimum level of debt and equity mix for AT&T that might maximizes the shareholder value?
This analysis looks at the capital structure of AT&T. I will specifically answer, “What is the optimum capital structure for AT&T?”, and demonstrate its potential impact on the stock price.
What is the company to do with its cash? Keep it as cash, reinvest back into the business, pay dividends, buyback shares, do acquisitions, or pay down the debt?
AT&T’s Strategy Shift
AT&T reduced its dividend on February 4, 2022, from $0.52 per quarter to $0.2775 per quarter. There was a strategy shift with the dividend cut announcement, that also came with the spinning off Warner Media and combining media properties with Discovery WBD. CEO John Stankey said:
“I’d much rather be pouring some of that cash back into the infrastructure of this business to [generate] returns at a higher level than what we pay out on the dividend. So, it’s time to make that transition for this company.”
The management decided to take the “reinvest back into the business” approach, and maybe reduce debt. The management talked extensively on reinvesting back into the business on the earnings conference call on October 22, 2022.
That is AT&T’s current simple strategy.
- Reduce debt to reach a net-debt-to-adjusted-EBITDA growth of 2.5x
- Reinvest in the business to achieve accelerating EBITDA growth
“We also plan to continue to use excess cash after dividends to reduce debt with a goal of reaching a net debt to adjusted EBITDA range of 2.5x.”
AT&T’s Primary Value Metric: EBITDA
The reason for focusing on EBITDA is this:
EBITDA is used as part of our management reporting, and we believe EBITDA to be a relevant and useful measurement to our investors as it measures the cash generation potential of our business units. EBITDA does not give effect to depreciation and amortization expenses incurred in operating income nor is it burdened by cash used for debt service requirements and thus does not reflect available funds for distributions, reinvestment, or other discretionary uses. FORM – 10Q.
AT&T’s Relative Value
AT&T’s EBITDA for the nine months ended September 30, 2022, was $29,931. Management expects to continued EBITDA growth and higher free cash flow in 2023. I calculated the company will finish 2022 with an EBITDA of $39.908 billion. At the end of September 2022, total debt was $133.48 billion.
A good way of looking at firm’s financing is to look at its debt-to-equity ratio. AT&T’s current D/E ratio is: 109.3% according to ycharts.com, 92% according to ibd.com. I calculate a debt-to-equity ratio of 95.4% from company’s 10Q – November 3, 2022, page 5. Debt = $133.48 / $139.98 billion equity = 95.4%. Therefore debt-to-capital ratio is = (133.48)/ (133.48 + 139.98) = 48.8%.
AT&T current capital structure is about let say 50% debt and 50% equity, close enough to 48.8% as of September 30, 2022, using the equity value from the balance sheet, and not the market cap.
Management’s strategy includes reducing debt and reach a “net debt-to-adjusted EBITDA range of 2.5x,” said CFO Pascal Desroches, on October 22, 2022. As of September 30, 2022, the net debt to EBITDA was = $133.48 billion / 29.93 = 4.46x according to my calculation.
Debt offers a tax benefit, compels investors to closely monitor the company, and makes management more focused, theoretically. But the interest-bearing debt must be “serviced” each year, and part of the cash flow must be used to pay the interest on the debt.
AT&T is currently valued fairly on the day of this analysis 11/16/2022, if we look at its peer group and few significant valuation ratios.
Table -1 below shows AT&T’s relative valuation. AT&T has a forward Enterprise Value to EBITDA ratio of 6.8, which is around its peer average, compared to VZ, CHTR and CMCSA. Similarly, compared to its peers, using Price to CF (market cap to Cash from Operations (trailing 12 months)), AT&T’s stock currently is fairly valued – not significantly overvalued or undervalued.
(Microsoft Excel)
EV-to-EBITDA is market’s favorite metric, and it is an industry standard to use for telecom companies. I used operating cash flow in Table-1 for price-to-cash flow ratio, because it gives a better idea of typical cash flow for the business.
Calculating Optimal Capital Structure
In finding the AT&T’s optimal capital structure, I used cost of capital approach. In this method:
Optimal debt ratio is the one that minimizes the cost of capital for a firm. If the cash flows to the firm are held constant, and the cost of capital is minimized, the value of the firm will be maximized.
Holding cash flow constant is a big assumption. AT&T’s cash flow might fluctuate significantly as the company accelerates its investments – spending on capital expenditures in the coming few years, as the CEO John Stankey said:
I’d much rather be pouring some of that cash back into the infrastructure of this business to [generate] returns at a higher level than what we pay out on the dividend. So, it’s time to make that transition for this company.
AT&T’s CEO’s credibility is on the line, if this strategy is changed again with a worsening capital structure, or adventurous acquisitions.
I have however no reason not to believe AT&T’s management, especially given that the company is just coming out of spinning off Warner Media and combining media properties with Discovery WBD. Any prudent management is not likely to start yet another similarly large acquisition adventure with stakeholders’ money.
Weighted Average Cost of Capital
Cost of capital = Cost of equity (E/(D+E)) + After-tax cost of debt (D/(D+E))
Cost of equity: AT&T’s cost of equity is calculated as follows:
Cost of Equity = Rf + B (Equity risk premium) = (risk free rate + beta * equity risk premium)
Cost of Equity = 4% + 0.70 (7%) = 8.90%
10 Year Treasury Rate was 3.67% for Nov 16, 2022. I use 4% as risk free rate to add margin of safety to my analysis. Market risk premium, I use 7%, a little higher than six percent, just to add again some form of margin of safety. And for Beta I used 0.70.
The average Beta from different sources is 0.67. You can also calculate the Beta yourself for different time periods. AT&T’s beta is relatively stable, indicating stock price is not volatile, despite the given volatility in the overall stock market since the Federal Reserve started raising interest rates in March 2022, first time since 2018. With some margin of safety added, AT&T’s cost of equity is 8.90%. See Table – 2.
Beta used in the formula is found as follows:
Microsoft Excel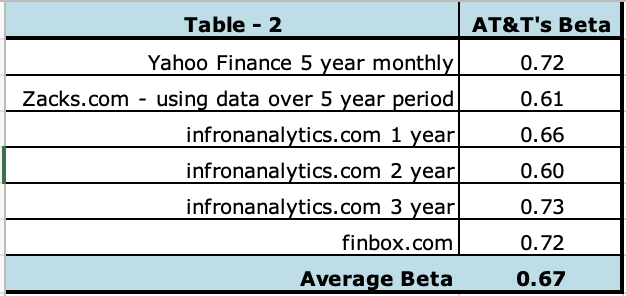
Cost of debt: US Corporate BBB Effective Yield was 5.80% for Nov 16, 2022, (ycharts.com). AT&T’s bonds are rated BBB, as stable. One could use 5.8% or 6% for pretax cost of debt for AT&T. I dug little deeper. All of AT&T debt is listed on its website. (Download the 10-Q – November 3, 2022, in Excel format.) One of the excel sheets shows all of the AT&T notes that are traded in one of the tables. The highest rate on Global Notes is 7.0% AT&T Inc. 7.000% Global Notes due April 30, 2040, and the lowest is 0.250%, AT&T Inc. 0.250% Global Notes due March 4, 2026.
All of AT&T’s debts can be found here. It is downloadable in excel. AT&T is paying a simple average rate of 4.94% on all of its debts, minimum rate 0.25%, maximum being 9.15%, amount of which is only $125 million due with maturity date of 2/1/23. The weighted average of its cost of debt is 3.52% with average maturity of 17.68 years. Table -3 below shows how I reach 7% for AT&T’s current pretax cost of debt.
Microsoft Excel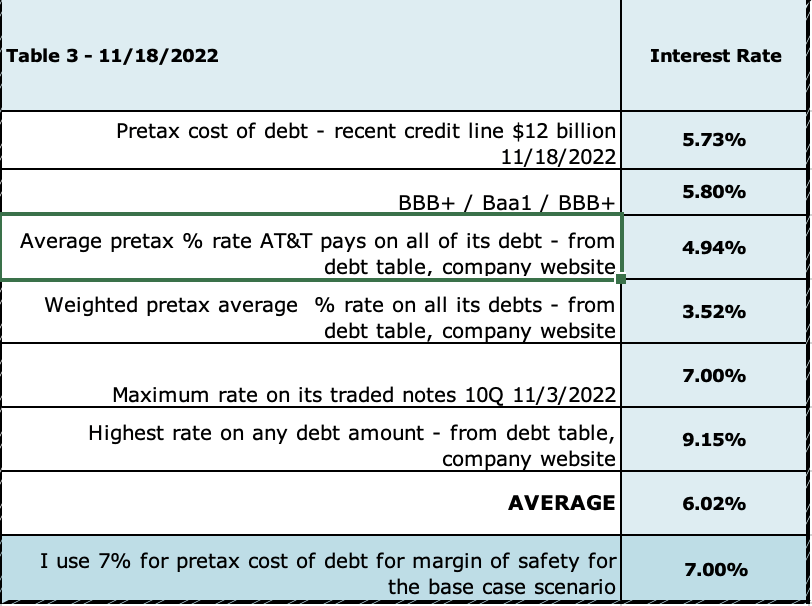
Investors need to continuously be aware if AT&T is going to retire its current debts, only to take on new debt at higher and higher interest rates, as the terminal risk free interest rate is expected to rise to 5-6% in the next three to six months. Retiring debt without taking on new debt would be good for the shareholder value, as the result of this analysis will show below.
AT&T’s effective tax rate was 19.2% for the first nine months of 2022, versus 19.3% for the comparable period in the prior year. (10-Q 11//3/2022)
In order to find AT&T’s optimum capital structure, I used cost of capital approach. In this method:
“Optimal debt ratio is the one that minimizes the cost of capital for a firm. If the cash flows to the firm are held constant, and the cost of capital is minimized, the value of the firm will be maximized,” according to Professor Aswath Damodaran of NYU.
Table -4 shows the inputs to the model: Instead of using the trailing 12 month’s numbers, I estimated the values for the full year of 2022 using AT&T’s 2022 financial statements nine months ending September 2022.
Microsoft Excel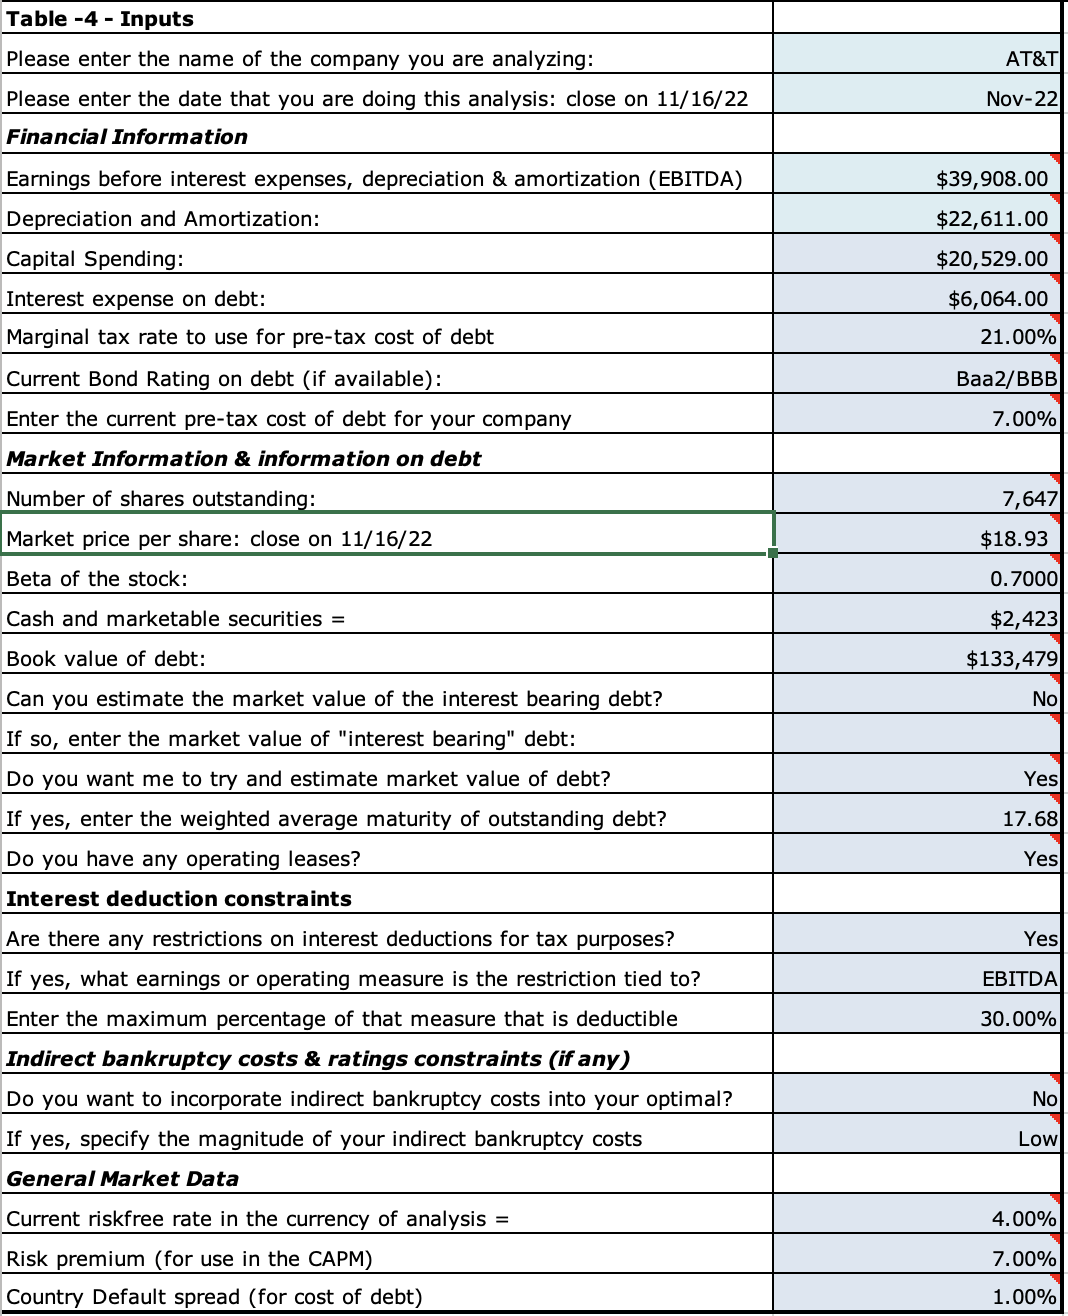
Results of the Analysis:
I find that AT&T’s optimal capital structure is 10%, as measured by (Debt/(Debt+Equity) = D/(D+E) as Table – 5 shows below. Ten percent is the optimum level of capital structure that maximizes firm’s value and minimizes the cost of capital highlighted in yellow. Table – 6 gives more detail of the output.
Microsoft Excel Microsoft Excel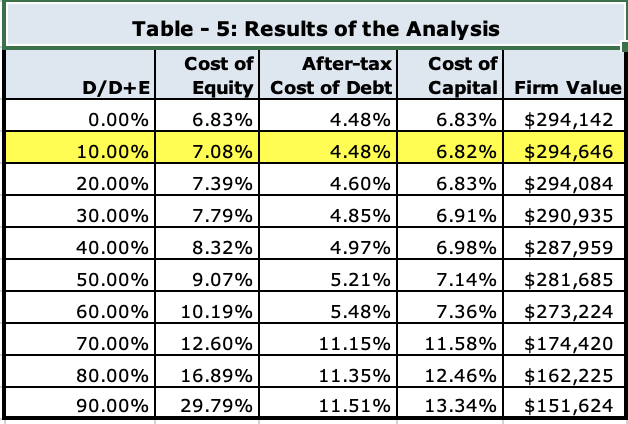

- AT&T should focus on reducing its debt. In hindsight, it might have been a prudent decision to cut the dividend in February 2022 by nearly 50%. That decision sent a signal that the company needs its cash flow generated from the business to reinvest back into the business as the CEO declared as well reduce its debt.
- My analysis also shows that the company must pay down its debt and find ways to generate more cash to reinvest in the business, instead of using debt to finance its growth and or acquisitions.
- AT&T does not have any excess debt capacity if the management wants to increase the shareholder value. This point might become more significant as the current interest rate increasing trend continues. Investors wouldn’t want the company to increase debt to fuel growth and capital expenditure, research and development spending with higher and higher interest rates.
- If AT&T were to reduce its debt to 10%, debt-to-EBITDA ratio will decline to 0.55x from its current 4.46x, and well below management’s stated target of 2.5x.
- The result of the analysis also shows an increase in the stock price from $18.93 on 11/16/2022 to $21.34 per share, a rise of 14.3%.
NOTES:
AT&T most recent debt facility can be used as a guideline to calculate its cost of debt. The company filed an 8-K on November 18, 2022, receiving a credit line of $12 billion from Citibank.
Also, you can read a great recent article about the history of AT&T and Time Warner WBD deal, by clicking here.
Be the first to comment