

Richard Drury/DigitalVision via Getty Images
Thesis
My last article comparing AT&T Inc. (NYSE:T) and Verizon Communications Inc. (NYSE:VZ) was co-produced with Sensor Unlimited back in May after their Q1 earnings reports (“ER”). That article focused on the impact of T’s spinoff and, in particular, the impact on its leverage and dividend safety.
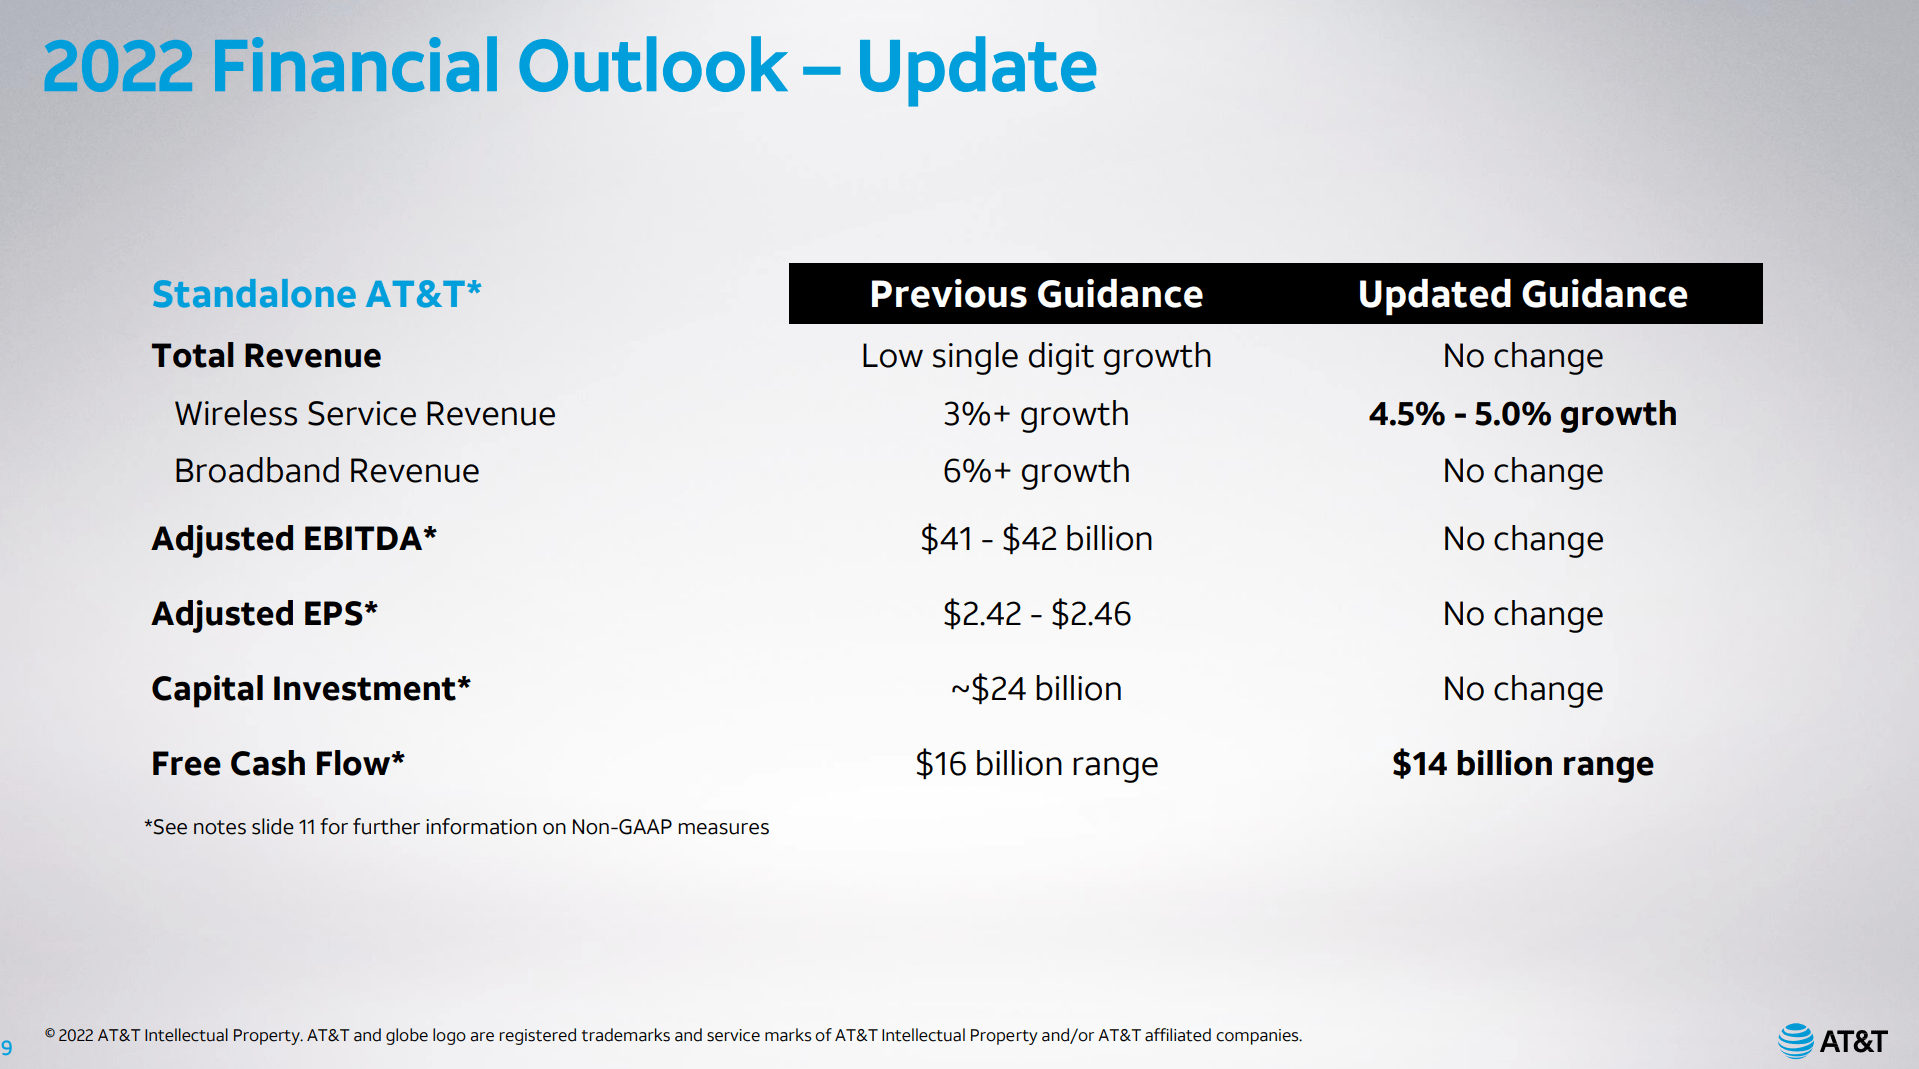
In this article, with both of their Q2 earnings posted, I wanted to shift the focus and assess the possibility of a dividend cut. By this time, I assume most of you have already fully digested their ERs. To put it mildly, they are not the kind of upbeat ERs that investors want to see. T disappointed the market by lowering its free cash flow forecast from $16B to $14B for the full year 2022. VZ narrowly missed profit expectations and also cut back its guidance. The current guidance implies no growth ahead in both lines or even a contraction. The market responded with a sizable correction in their stock prices.
As you can see from the following chart, their stock prices had been doing well and outperforming the broader market since their Q1 ER by about 10%. However, right after the Q2 ERs, their stock prices went over a cliff and both dropped around 10%, giving back all the gains accumulated over the prior three months.
More worrisome, T’s free cash flow (“FCF”) in 1H 2022 was not even sufficient to cover its dividends. And neither would its 2022 projected free cash flow. Many investors (including this author himself) are drawn to telecommunication stocks because of the generous dividends.
That’s why it is the focus of this article to assess the possibility of a dividend cut. In the remainder of this article, you will see a holistic analysis of their dividend safety beyond the normal payout ratio analysis. You will see their dividend safety considered holistically together with their earnings, capital investment plans, debt obligations, et al. My conclusion is that the dividends of VZ are still safe, and I don’t see any possibility of a cut in the near future. But the safety of T now is on the borderline, and a cut is a possibility.
Seeking Alpha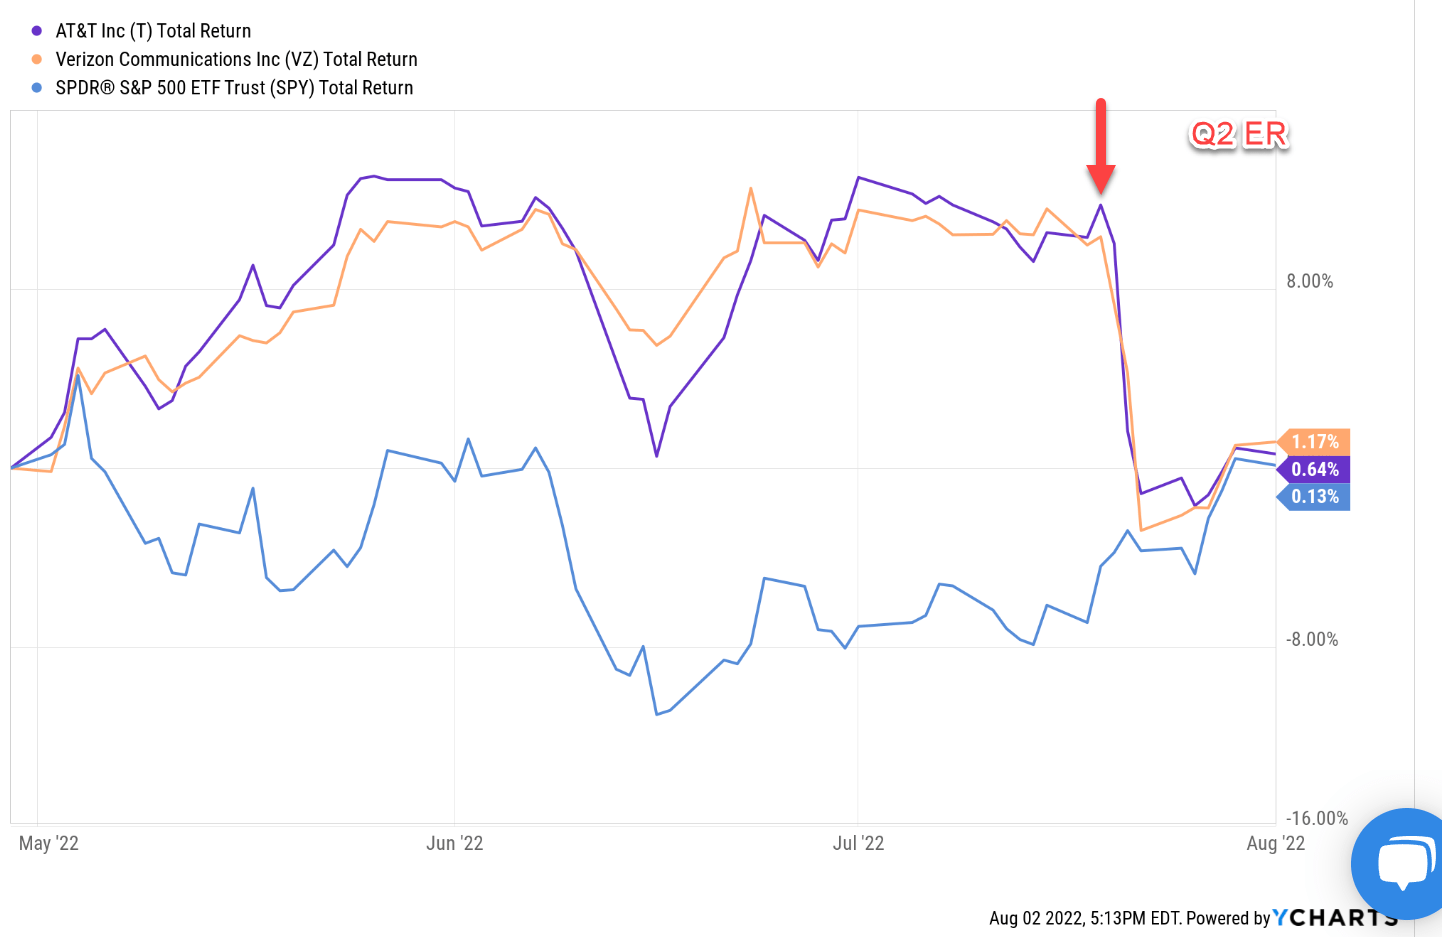
T and VZ Q2: cash flow in focus
Both companies reported higher CAPEX expenses and lower operating cash flow. In VZ’s case, its operating cash flow shrank to $17.7B during 1H 2022 from $20.4B during 1H 2021. At the same time, its CAPEX expenditures increased by $1.8B, causing a whooping $4.5B drop in free cash flow. These changes are driven by a variety of factors, as commented on by VZ’s CFO Matt Ellis below (abridged and emphases added by me):
…cash flow from operating activities for the first half of 2022 totaled $17.7 billion compared with $20.4 billion in the prior year period. The reduction was primarily due to working capital impacts from higher device activations and increased inventory levels as part of our supply chain management in the current environment. Capital spending for the first half of the year totaled $10.5 billion, an increase of $1.8 billion compared to last year, driven by C-Band spending of $2.8 billion. The net result of cash flow from operations and capital spending is free cash flow of $7.2 billion for the first half of the year.
The picture for T is similar but a bit worse. In VZ’s case, its FCF still covers its dividends ($5.4B in 1H 2022) comfortably. But in T’s case, its FCF plunged from $5.2 billion in Q1 to $1.4 billion this quarter. And what is more concerning is that the FCF is not sufficient to cover its dividends, as detailed next.
VZ Q2 ER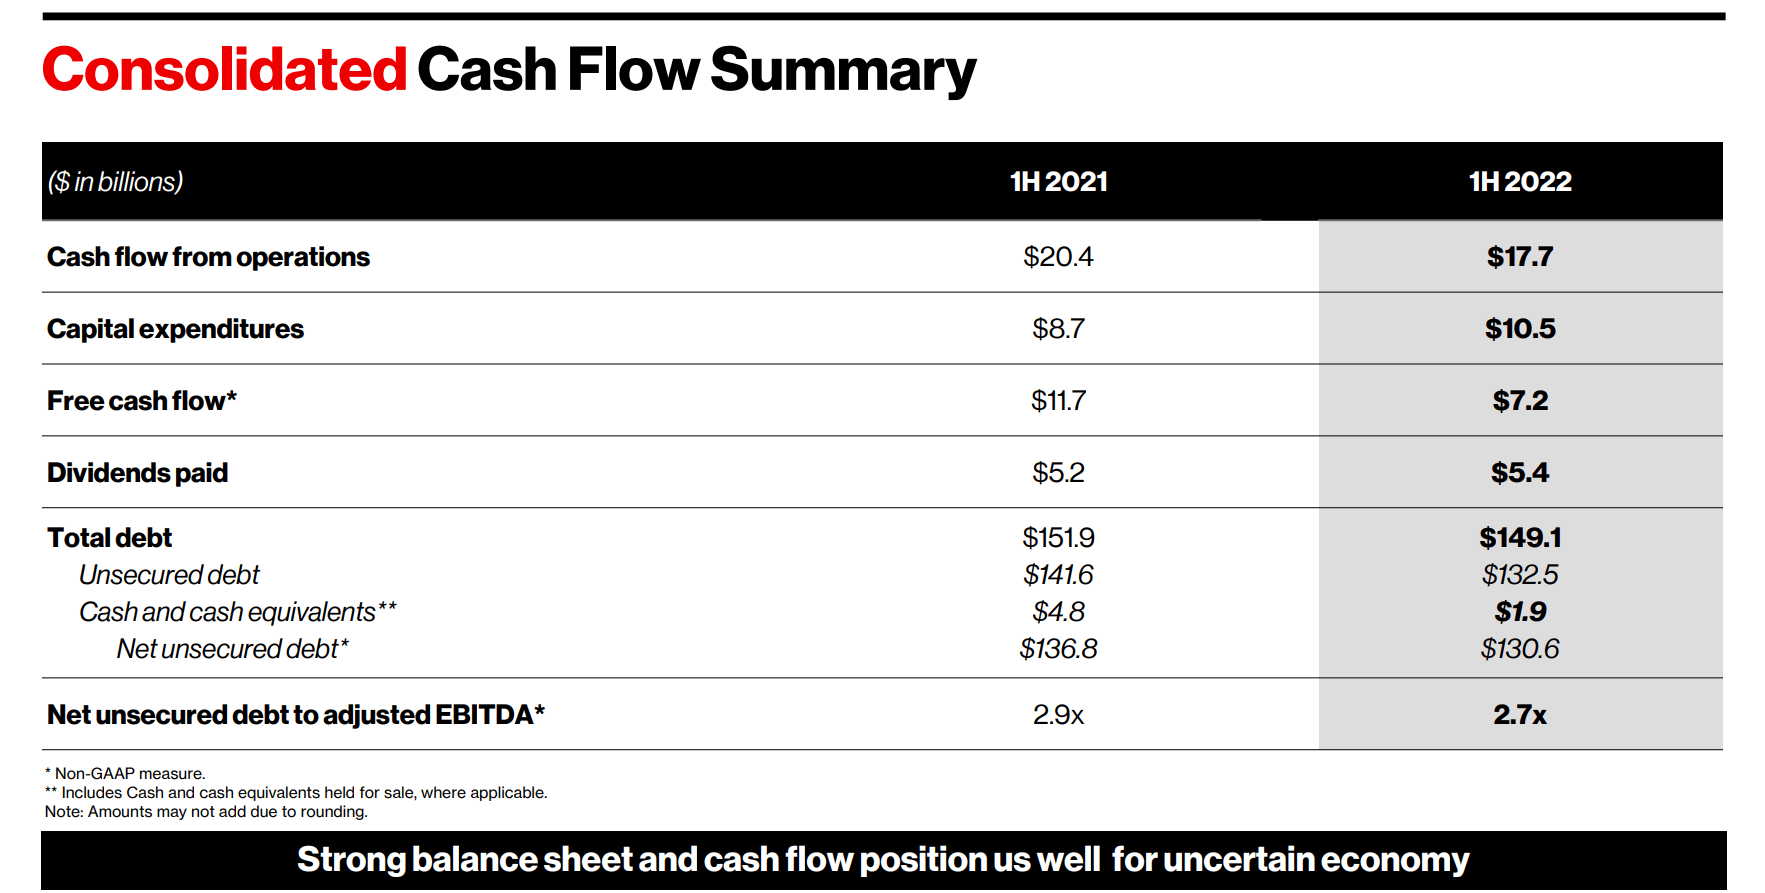
T vs VZ: dividend safety
The next chart below shows T’s FCF and dividend payouts. During 1H 2021, FCF has been above dividend obligations by a healthy $1. 6B margin ($9.2B vs $7.6B). However, this year, due to the contraction of FCF, it became insufficient to cover the dividends by a deficit of $1.64B. Furthermore, it also slashed the 2022 full-year FCF guidance to $14B from the prior $16B. And I anticipate its 2022 full-year dividend obligations to be at least $15B. Therefore, the deficit will likely persist for the remainder of this full year.
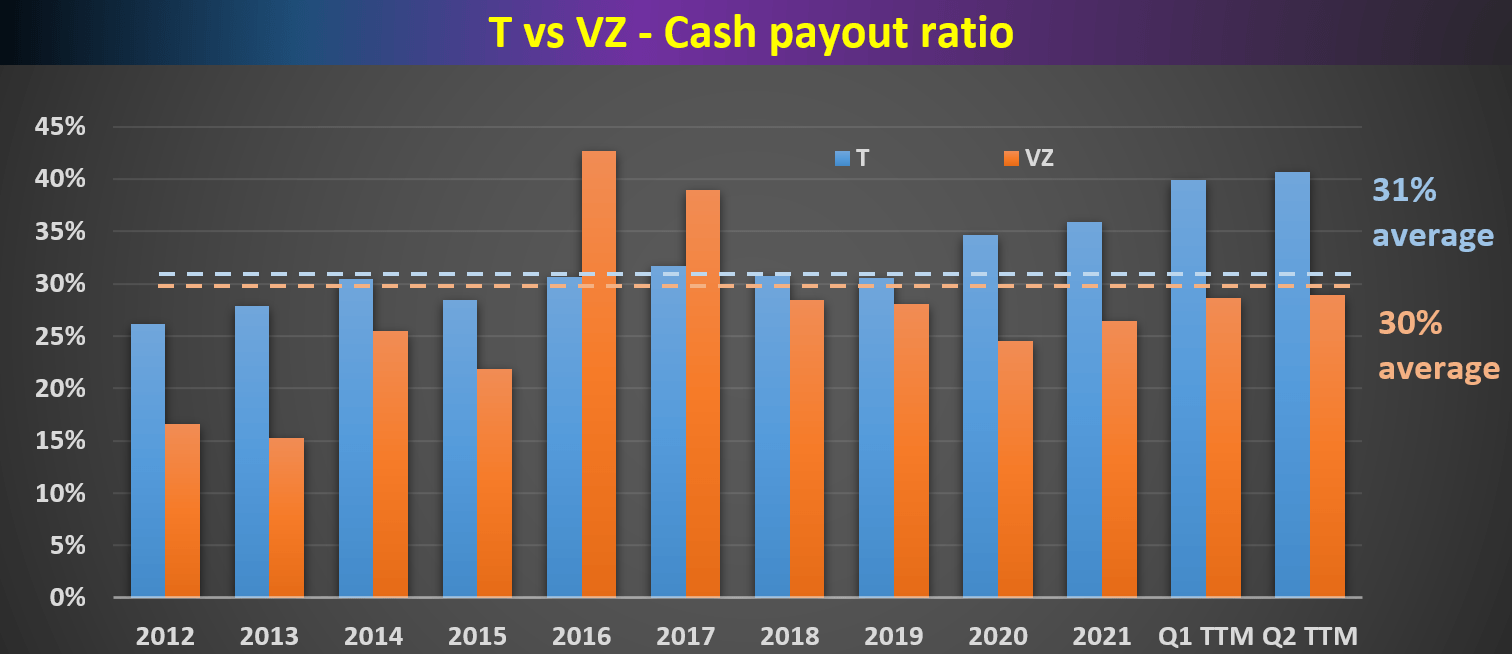
To broaden our view a little bit, the next chart shows the commonly quoted cash payout ratio for both of them in the past ten years. As long-term dividend payers, both T and VZ have been doing a consistent job of managing their dividend payout. The cash payout ratios have been essentially the same for both – T’s long-term average is 31% and VZ’s 30%. However, VZ’s current payout ratios, despite the issues just mentioned, are still lower than its historical average. But T’s current payout ratios are approaching 40%, substantially above its historical average.
Next, we will go beyond such a simple payout ratio and consider their dividend safety holistically together with other factors such as cash position, debt, and CAPEX.
T Q2 ER Author
T vs VZ: dividend cushion ratios
As detailed in my earlier article here, the major limitations of the above simple payout ratios are twofold:
- The simple payout ratio ignores the current asset that a firm has on its balance sheet. Obviously, for two firms with the same earning power, the one with more cash sitting on its balance sheet should have a higher level of dividend safety.
- The simple payout ratio also ignores the upcoming financial obligations. Again, obviously, for two firms with the same earning power, the one with a lower level of obligations (pension, debt, CAPEX expenses, et al) should have a higher level of dividend safety.
The above simple payout ratios ignore all these important pieces. For a more advanced analysis of dividends stocks, we find the so-called dividend cushion ratio an effective tool. A detailed description of the concept can be found in Brian M Nelson’s book entitled Value Trap. And a brief summary is quoted below:
The Dividend Cushion measure is a ratio that sums the existing net cash (total cash less total long-term debt) a company has on hand (on its balance sheet) plus its expected future free cash flows (cash from operations less all capital expenditures) over the next five years and divides that sum by future expected cash dividends (including expected growth in them, where applicable) over the same time period. If the ratio is significantly above 1, the company generally has sufficient financial capacity to pay out its expected future dividends, by our estimates. The higher the ratio, the better, all else equal.
Note that our following analysis made one revision to the above method. Instead of subtracting the total long-term debt, we subtracted the total interest expenses over a past five-year period. The reason for this revision is to adjust the status of businesses such as T and VZ. Mature businesses like these probably will never have the need to repay all of their debt at once. But it does need to have enough earnings to service its debt (i.e., cover the interest expenses). With this background, the dividend cushion ratios for T and VZ are calculated and shown below.
As can be seen, T has been maintaining an average dividend cushion ratio of about 1.61x in recent years, and VZ has been maintaining a higher cushion ratio of 1.97x. Both are consistently above 1, which is regarded as the threshold for a safe dividend. In T’s case, its current cushion ratio is at 1.39, substantially below its historical average of 1.97, and gets quite close to the threshold level. Particularly, you can see the deterioration of its cushion ratio from Q1 2022 to this quarter. On a TTM basis, T’s cushion ratio was a very healthy 1.98 in Q1 2022. But due to the issues mentioned above, the ratio contracted sharply to 1.39 in Q2.
VZ’s cushion ratio deteriorated too due to the issues in Q2, from 1.99 in Q1 to the current 1.85. However, its deterioration was much milder than T. And its current level of 1.85 is still close to its historical average and far above the threshold level.
Looking forwards, I see T’s cushion under more pressure in the remainder of 2022 and VZ’s ratio more stable.
Author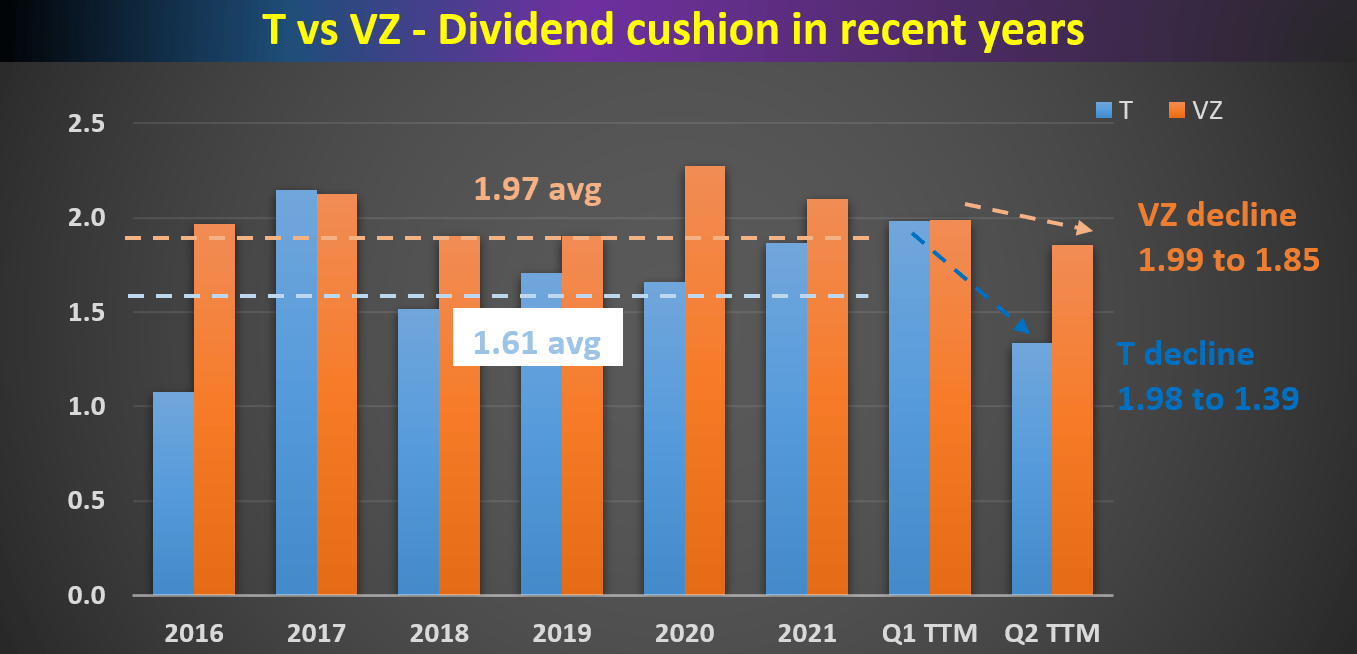
T vs VZ: 2H 2002 outlook
Looking ahead, both VZ and T are likely to see flat or even contracting top and bottom lines in the full year 2022. While their CAPEX expenses will stay high, leading to stretched cash flow. VZ is projecting flat to 1% contraction in its revenues, and flat to 1.5% contraction in its EBITDA earnings. EPS guidance is lowered by about $0.3 too, while CAPEX guidance remained at $16.5B to $17.5B with a heavy emphasis on the C-band investment. The picture of T is quite similar as you can see from the second chart below. And here again, the key difference is that T’s $14B free cash flow guidance will be likely insufficient to cover its dividends.
Despite these near-term headwinds, I see no reason for long-term investors to panic. The telecommunication sector is known for (notoriously known for) its heavy CAPEX investment and long assets cycle. And I totally share the following comment from VZ’s CFO Matt Ellis (abridged and emphases added by me).
For CapEx, we are reiterating prior guidance of $16.5 billion to $17.5 billion for business-as-usual capital and $5 billion to $6 billion of C-Band-related spending. In closing, we are confident in our strategy and believe that our assets position us well to generate long-term shareholder value.
VZ Q2 ER T Q2 ER
Final thoughts and other risks
Both VZ and T reported disappointing Q2 ER. Cash flow is stretched due to lower operating income and higher CAPEX expenses. And these issues are expected to persist into the rest of 2022 or even beyond. As a result, dividend safety has deteriorated for both, especially in the case of T. On a TTM basis, T’s dividend cushion ratio dropped sharply from a healthy level of 1.98 in Q1 2022 to the current level of 1.39 – not only far below its historical average but also getting a bit too close to the threshold. VZ’s cushion ratio deteriorated too but to a much lesser degree. Its current level of 1.85 is still close to its historical average and far above the threshold level.
Despite these near-term issues, I see no reason for long-term investors to panic (especially for VZ investors). For better or worse, heavy CAPEX investing IS the key to telecommunications’ moat. The top reason that I am drawn to this sector is not their dividends, but actually their long assets life cycle.
Finally, risks. Besides the risks of a dividend cut, there is a risk that their CAPEX projects can run over budget. The long lifecycle of their assets as just mentioned, combined with the recent inflation hikes and labor shortages, can cause their CAPEX to exceed management guidance. The issue is best illustrated by the following Q&A exchange during T’s Q2 ER (abridged and emphases added by me). And it applies equally well to VZ.
Questions from Tim Horan (from Oppenheimer): On the CapEx, we’re hearing CapEx equipment costs, labor costs are up 10%, 15%. I know you gave your guidance out quite a while ago for next year. I guess how are you offsetting those price increases that we’re hearing about out there in keeping your CapEx flat?
Answers from John Stankey (CEO of T): On the cost side, we’re certainly seeing some pressures as we move through. We’ve articulated that. We’re able to navigate it better than a lot, as we’ve shared with you previously. We have a lot of long-term contracts in place. I think those help us a lot. I won’t tell you they entirely insulate us.
Be the first to comment