

baranozdemir/iStock via Getty Images
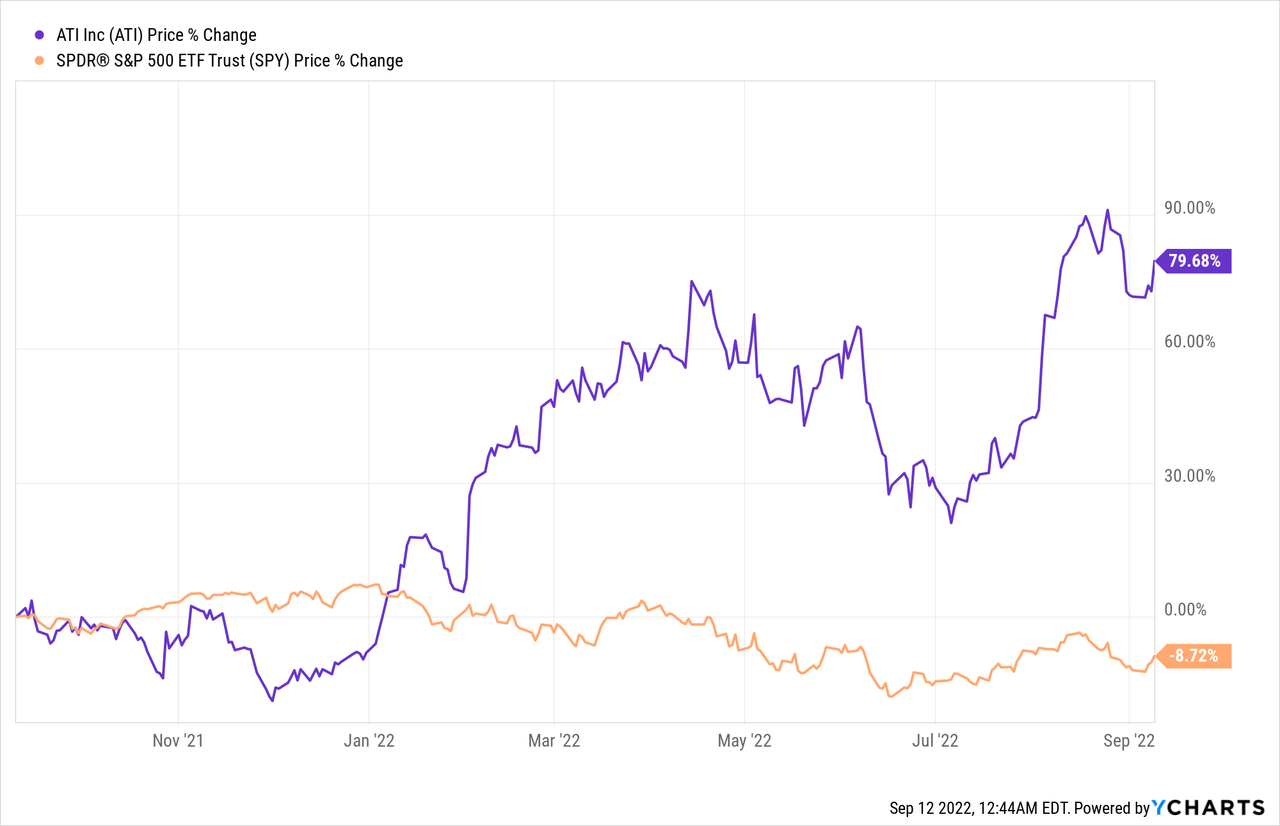
Allegheny Technologies Inc., which recently changed their name to ATI Inc. (NYSE:NYSE:ATI) stock price has performed relatively well compared to the rest of the market over the last year, but it is time to sell at the current price of about $32. The improved management’s guidance numbers of adjusted mid-point EPS this year of $2.07 compared to prior guidance of $1.50 per share and increased cash flow guidance are already reflected in the stock price of this highly leveraged specialty metal company whose largest market is the airplane industry.
ATI Stock Price Beats the Market Over the Last Year
ATI results have improved this year as the airplane industry has turned around, but what I think the key reason for the improvement is their spare parts sales, which have a higher margin than regular sales. According to management, their spare parts are now 40% compared to their historic average of 25%. As air travel demand has increased without increased new airplane deliveries, airlines need to replace parts on their existing fleet. This increase in spare parts sales has resulted in improved margins this year.
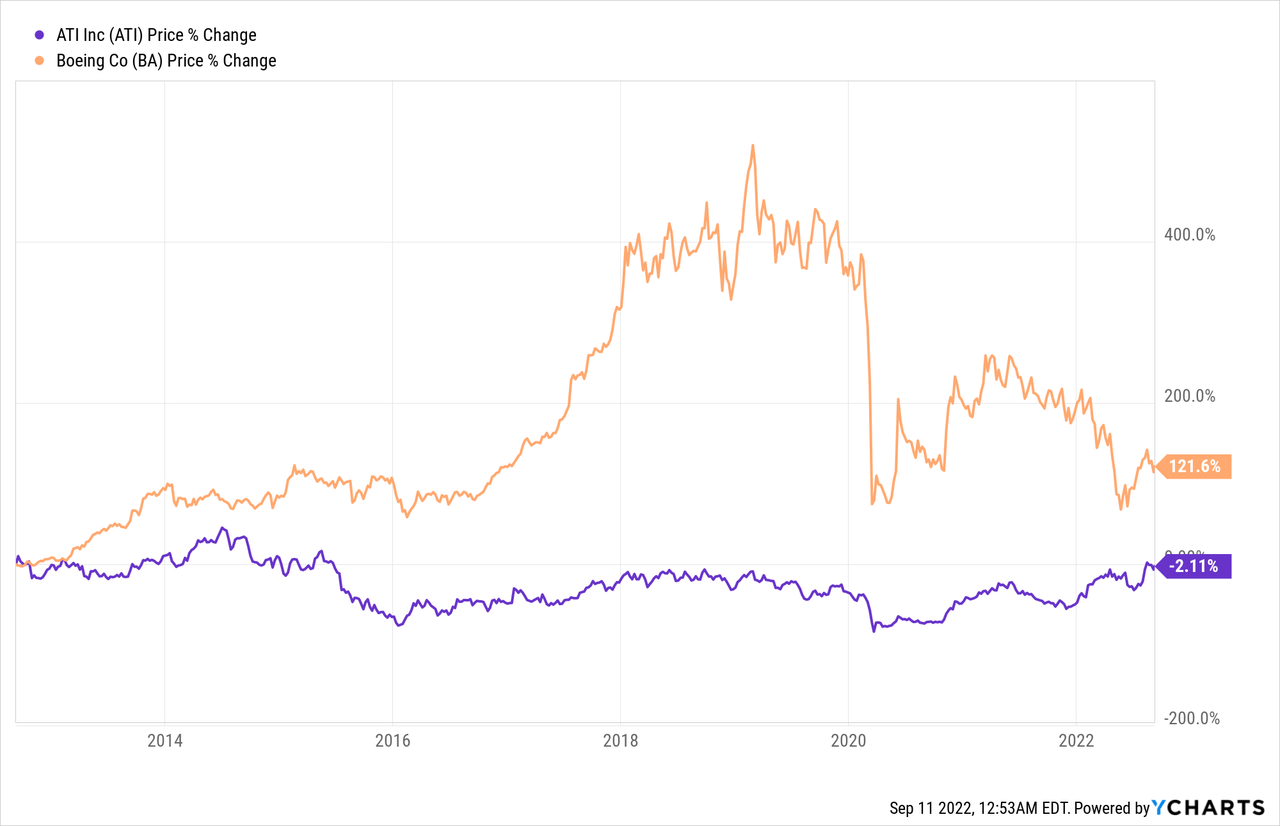
ATI has been around for a very long time but has performed poorly. I like to compare their stock price to Boeing (BA). While some might not think it is a fair comparison, I like to compare a supplier to the final manufacturer.
10-Year Stock Price Performance of ATI and Boeing
Recent Results
The results for the first six months of 2022 include the $141 million loss on the sale of their Sheffield, UK operations. According to a filing by the buyer, Mutares SE & Co. KGaA, these operations were expected to have revenue of about €80 million in 2022. ATI, however, in their 2Q stated that their Sheffield operations had external sales of $36 million with a net loss of $9 million before taxes in 2021. The company also stated that 80% of those sales were to energy market. It, therefore, seems that the buyer was planning to ramp up operations to service the oil and gas industry.
2Q and First Half 2022 and 2021 Income Statements
2Q and First Half Income Statement (sec.gov)
Investors need to be careful of looking at their historic results because ATI frequently record gains and losses from non-recurring items that distort the results from normal operations.
The margins for 2022 and 2021 look very favorable compared to historic results, partially because ATI exited low-margin stainless sheet production in 2020 and took a $1.079 billion charge. The reality is that they could not compete with their competitors, who had much more efficient operations than ATI.
2Q Revenue by Market
2Q Revenue by Market (ir.atimaterials.com)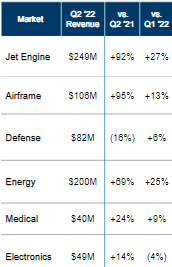
Reasons to Sell Now
While their recent results and outlook have improved, I think that the current stock price already reflects that improvement, especially compared to the rest of the market. For a number of reasons stated below, I consider ATI a sell.
*High P/E
Management raised their guidance for adjusted (adjusting for loss on assets sale) 2022 EPS to a midpoint $2.07 ($2.00-$2.14) from their prior guidance of $1.50 during their August 4 conference call, which I assume factors in their recently announced titanium deal with GKN Aerospace. I also assume that these increased guidance numbers reflect the increase in the latest reported backlog of $2.6 billion, which is an increase from $2.1 billion at the end of 2021. We do not, however, know how much of these orders are for spare parts that have higher margins and how much is for just normal production.
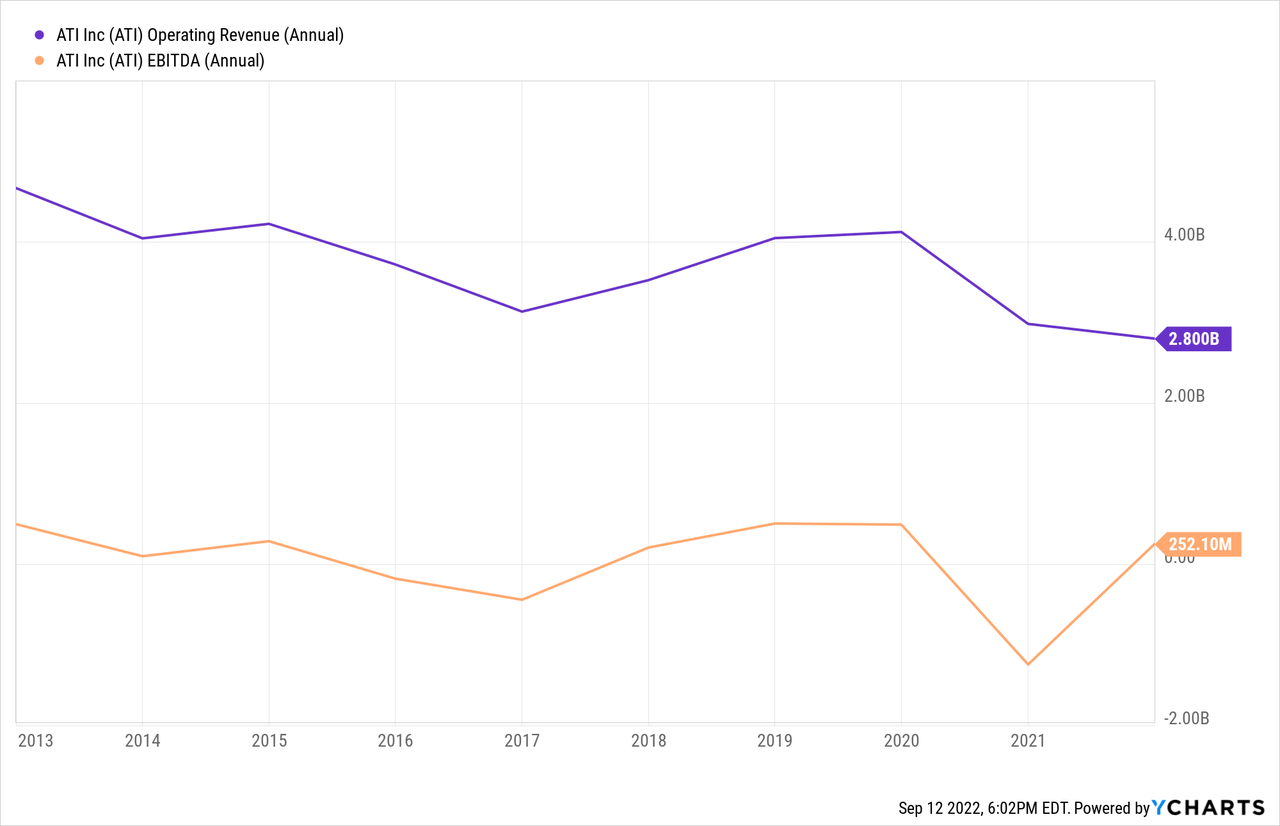
Based on the latest price of ATI of $31.67 and using $2.07 EPS, the forward P/E is 15.3x. ATI has not been really a growth stock that deserves a relatively high multiple compared to the current forward S&P 500 P/E of about 17x. As seen by the chart below, they have had flat to slightly lower results over the last 10 years.
10 Years Annual Revenue and EBITDA
*High Financial Leverage
ATI has long-term debt of $1.703 billion and shareholder equity of $762.9 million. That is a lot of debt compared to equity, which may partially explain why their debt is only rated B by S&P. The company, however, did announce last week that they amended their credit agreement, so it now expires in September 2027 instead of 2024.
Given this high level of debt, I strongly disagree with management’s decision to repurchase about $89.9 million worth of ATI stock in the first half because they wanted to avoid dilution by the conversion of some of their convertible notes. I strongly assert that this money should have been used to reduce debt to strengthen their weak balance sheet. The board has also authorized an additional $60 million in share repurchases. Companies with a high-risk B bond rating should not, in my opinion, be repurchasing stock, but should instead pay down debt.
ATI also has a $389.5 million pension liability that should really be added to their long-term debt. They have been highly leveraged for years. (I can also remember when Ladish filed for bankruptcy in 1993. ATI bought Ladish in 2011 for $778 million.)
*Raw Material Problems
ATI is exposed to raw material problems. First, prices of many of their raw materials are very volatile as can be seen by the tables below. Other raw materials are just as volatile. Second, most of their raw materials come from overseas and often from countries that are problematic such as Russia and China. This results in supply change problems that they had even before the pandemic. These price volatility problems and supply chain problems result in difficulty controlling margins.
PPI 10 Years Iron and Steel Scrap Prices 100=1982
10 Years Iron and Steel Scrap Producer Price 100=1982 (fred.stlouisfed.org)
PPI 10 Years Titanium Producer Prices 100=1982
10 Years Titanium Producer Price 100=1982 (fred.stlouisfed.org)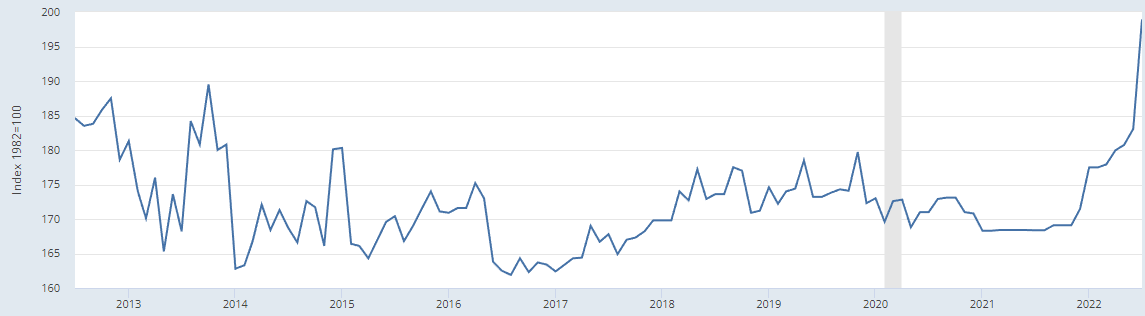
PPI 10 Years Nickel Producer Prices 100=1982
PPI 10 Years Nickel Producer Prices 100=1982 (fred.stlouisfed.org)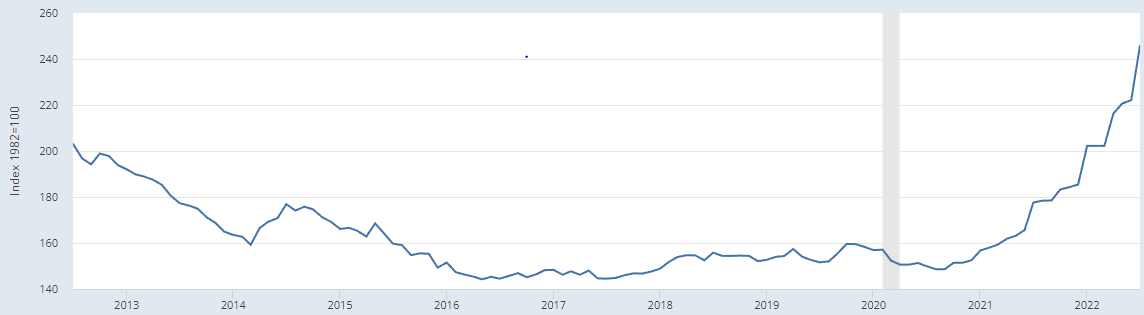
In 4Q 2021, ATI changed from the LIFO method for inventories to the average cost method for raw materials and the FIFO method for work-in-process and finished goods inventory in the U.S. but kept FIFO or average cost methods for non-U.S. operations. Without more information, I am unable to determine how much, if any, these changes had on their reported improved profit margins in 2022. I am not sure if the improved margins are from improved operations or partially from just accounting changes.
Conclusion
I often buy on “blood” and sell on “love”. I included some ATI in a very large number of companies I bought as potential turnaround candidates. Some of these stocks did very well and others went further south. I sold ATI as soon as it had a modest gain because I did not like their high leverage, and they had a history of stagnant results. Currently, everyone seems to “love” ATI, which means it is time to sell. The current stock price already reflects the improvements, but it seems to ignore the negatives, such as high leverage and difficulty controlling profit margins because of volatile commodity prices. I rate ATI a sell.
Be the first to comment