

Hollie Adams
Investment thesis
Associated British Foods (OTCPK:ASBFY) is a diversified company that is well-placed as a defensive stock in this low-growth and high-inflation environment.
The share price has fallen 25% over the past year and is currently trading at its lowest level compared to the last 10 years. Given the fundamentals and outlook, the company is looking extremely cheap.
Primark, ABF’s retail stores offer value products in clothing and fashion. We believe a decline in discretionary spending during a recession will be partially offset by consumers moving down the value chain where Primark is a strong player.
Using DCF analysis based on Cash Flow Returns on Investment, ABF is looking significantly undervalued. Conventional valuation ratios, such as the PE and price to sales also point to the company being undervalued.
In our model, we had to come at ABF from multiple angles just to justify the current trading price of £15.8. These include reducing the estimated EPS for FY23 from £1.2 to a pandemic period EPS of £0.8, lower self-sustainable growth from 3% to 0%, and adding an additional risk premium of 2% to the default WACC.
We ran four scenarios: the default shows a potential upside of 100% and the worst showed ABF to be fair value. The reality would fall somewhere in between. With risk limited to the downside, this is certainly one you should have in your basket
Company Introduction
ABF is a UK-based diversified company that operates in retail, grocery, agriculture, and food ingredients. The retail division consists of Primark, with 408 stores in 14 countries across Europe and The US. Primark is an affordable clothing retail chain and it constitutes about half of the total revenues. Food brands owned by ABF include Twinings, Ovaltine, Patak’s, Kingsmill, Jordans, Tip Top, Yumi’s, and Mazola. They also grow and process sugar, and supply farmers with crop input and animal feed.
Basic Fundamentals
The year ending September 2022 saw a post-pandemic bounce with revenue up 22%, EPS 63%, and dividends restored to roughly pre-pandemic levels. If we compare these with pre-pandemic revenues of 2019, they were up 7.5%. Given the bleak economic outlook, high inflation, and the potential of a longer than expected recession, a squeeze in consumer spending is expected. However, we believe ABF is diversified enough to survive. Primark, its largest asset is a value retailer of clothing. The overall discretionary spending on clothing will definitely be affected in a downturn. The overall cut will be offset by consumers moving down the value chain and this is something that Primark excels at.
ABF Financial Summary (ROCGA Research)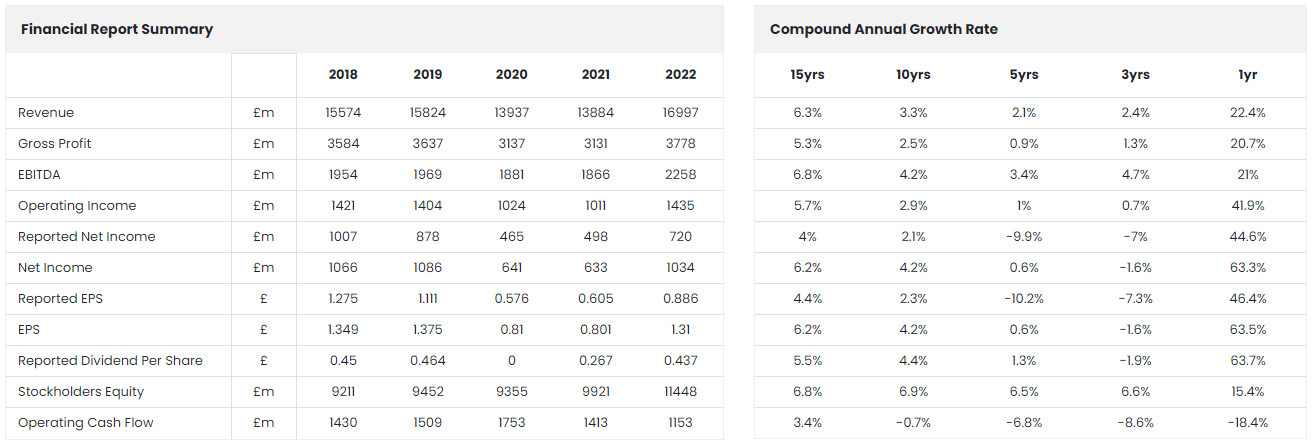
Consensus estimates suggest revenue will increase by 14.9% and 3.6% respectively in FY1 and FY2. With higher inflation taking hold, higher costs result in expected EPS going down by 16% in FY1 before increasing again in FY2.
In the annual report ending September 2022, an increase in inventory from £2.2bn to £3.4bn stands out.
Page 34: £440m of this increase related to the timing of receipt of Primark autumn/winter inventory at both financial year ends. £200m of inventory arrived later than the end of last financial year as a result of supply chain disruptions and £240m related to the planned earlier receipt this year-end to avoid higher freight costs.
Having excess inventory at pre-inflation prices and walking into an inflationary environment won’t hurt ABF.
The company also has £2.2bn in cash and has announced a share buyback program of £500m. This is a strong indicator that the company does not see any liquidity issues in the near future.
Every company is looking down the double-barreled gun of high inflation and recession, and a squeeze in discretionary consumer spending is expected across the board. ABF will be no exception but as mentioned earlier, they offer value clothing and fashion, and any decline in overall spending will be partially offset by other consumers moving down the value chain. ABF also operated in groceries, food, and food-related products. These products are less discretionary, but during these challenging economic conditions, higher inflation is expected to affect margins.
It will be hard trying to assess how inflation with volatile input costs, a downturn, and fluctuating exchange rates will affect the financial performance of ABF. We run some simulations looking at two extremes to help us derive a value for the company.
Financial Analysis
ABF Long Run Average Profitability Ratios (ROCGA Research)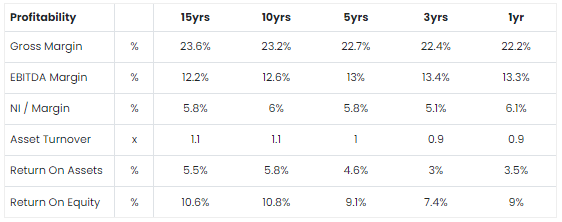
Let us look at the historical performance and use our understating to project forward. We see net income margins improving for the 1yr average but the 3yr average is lower than the long-run margins. Efficiencies have deteriorated with asset turnover, ROA, and ROE lower than the long-run averages.
The data above is giving us a mixed signal regarding the underlying performance of ABF. We will use our proprietary research, ROCGA, Returns on Cash Generating Assets, a framework built using the Cash Flow Returns On Investments methodology. This is an economic measure of performance and should give us a better understanding of the drivers of value.
Before we break down the value drivers, let us have a brief look at the conventional valuation ratios.
ABF Long Run Average Valuation Ratios (ROCGA Research)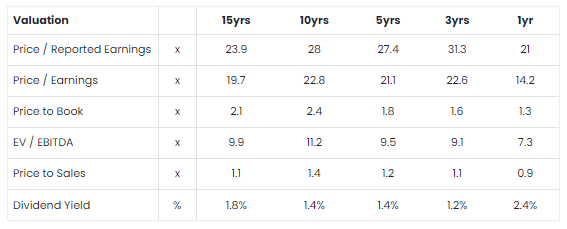
Based on consensus EPS FY1 PE is currently 13.2 and FY2 11.8. Price to sales for the forecast years of about 0.7. ABF is trading at a discount to its long-run averages. These do not take into account the higher inflationary environment and the potential of a recession in the UK and Europe.
More information on gross assets, gross cash, and Cash Flow Returns on Investments can be found by Bartley Madden in the paper titled “The CFROI Life Cycle“. Bartley Madden has been a significant contributor to the Cash Flow Returns on Investment methodology.
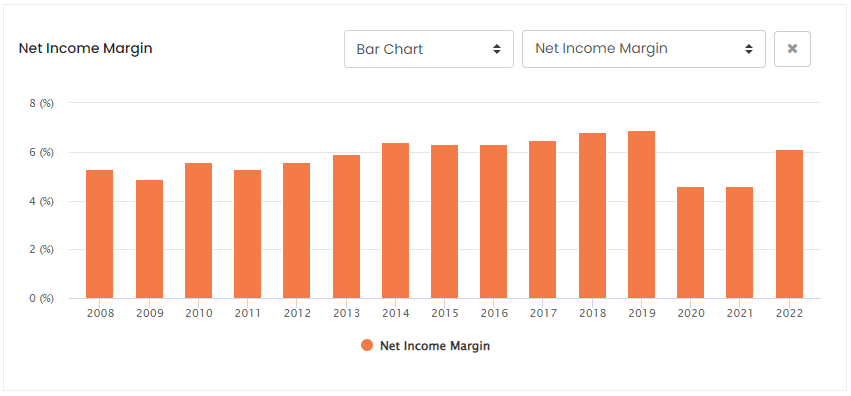
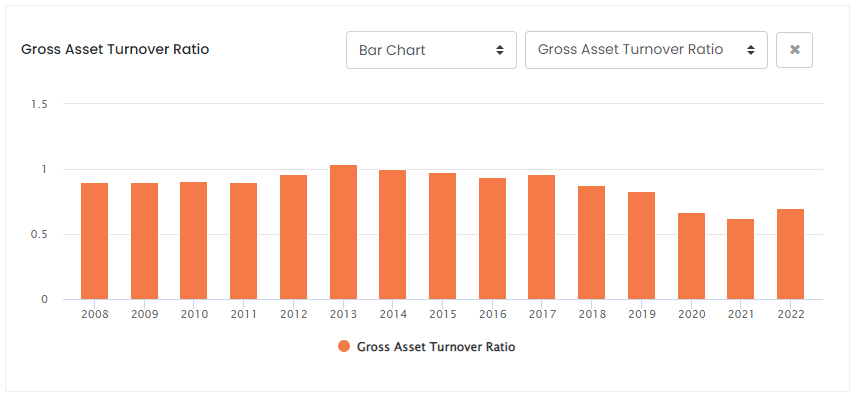
We will attempt a DuPont like breakdown by splitting the key drivers. These will include margins and asset efficiencies, the components that drive Returns on Cash Generating Assets. ROCGA, a version of Cash Flow Returns on Investment, with revenue and asset growth drive valuation.
ABF Revenue Growth (ROCGA Research) ABF Net Income Margin (ROCGA Research) ABF Gross Asset Turnover (ROCGA Research)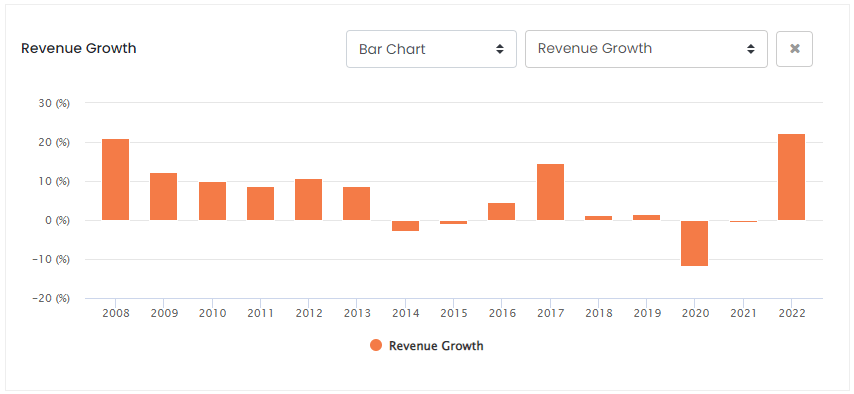
The ROCGA graph below includes the consensus estimates for FY1 & FY2 and our estimates for FY3 & FY4.
ABF Returns On Cash Generating Assets (ROCGA Research and author) ABF Total Cash Generating Assets (ROCGA Research and author)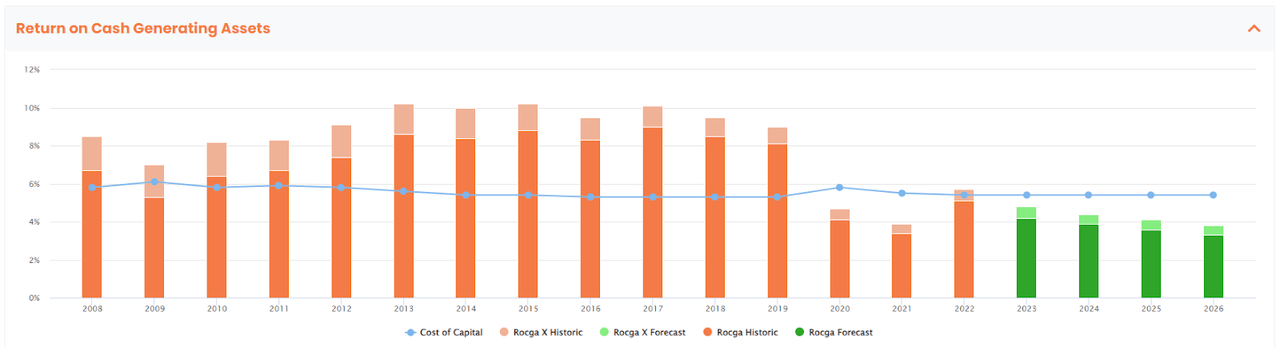
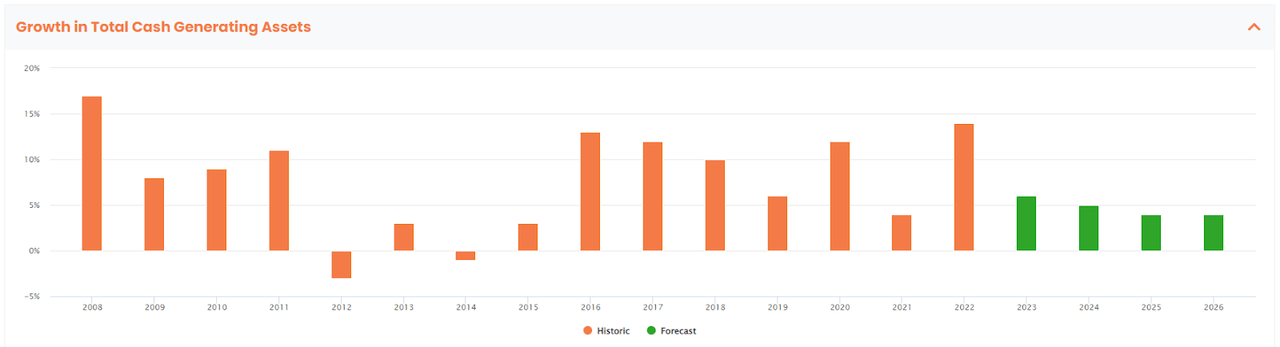
We can see that in 2020 income margin and asset turnover declined, and so did ROCGA. We will now look at the effect the decline in ROCGA and growth have on valuation. To value the company, we model the company, back-test the valuation along with the historic share price, and then forecast forward. More detail on how the modeling components work can be found here. We use a non-cyclical flag, with medium strengths and a life cycle stage of 4.
ABF Valuation Model (Model created by the author with ROCGA Research platform) ABF Default Valuation (Valuation chart created by the author using ROCGA Research platform)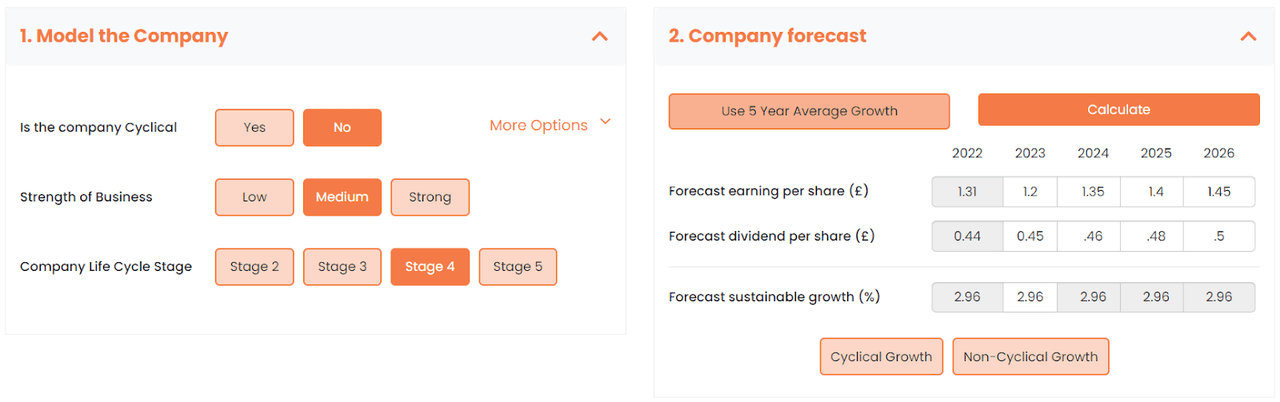
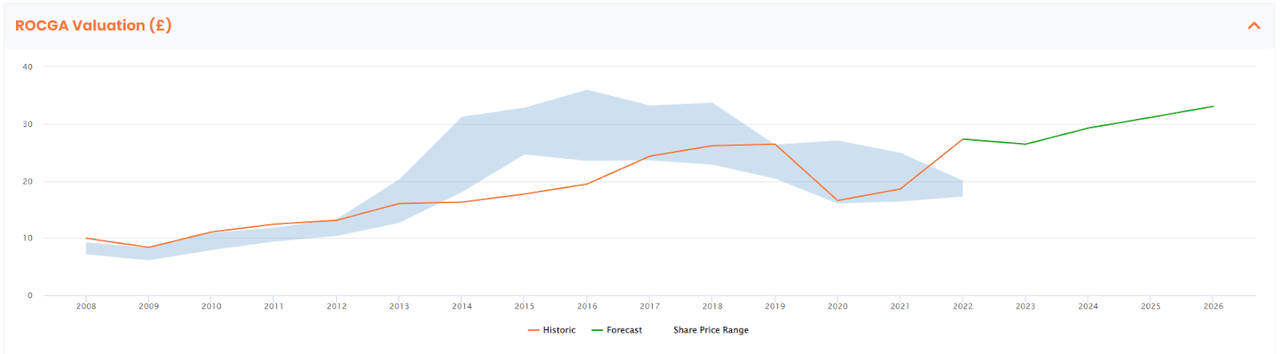
The default valuation does not take into account the potential risks of a recession and a higher inflationary environment. We ran some scenarios to derive some adjusted valuations.
We ran four scenarios:
-
Default Scenario – Using consensus EPS for FY1 & FY2, and increasing by a modest £0.05 over the next two years.
-
Default scenario and an additional risk premium of 2%, to take into account inflation and recessionary risks.
-
Default + adding 2% risk premium and reducing growth to 0% from the default of 3%.
-
Taking a hammer and hitting ABF from all sides, 2% additional risk premium, reducing growth to 0% and assuming that EPS returns to the pandemic period of £0.8 for FY1.
ABF Valuation Matrix (Table created by the author with data from rocga.com)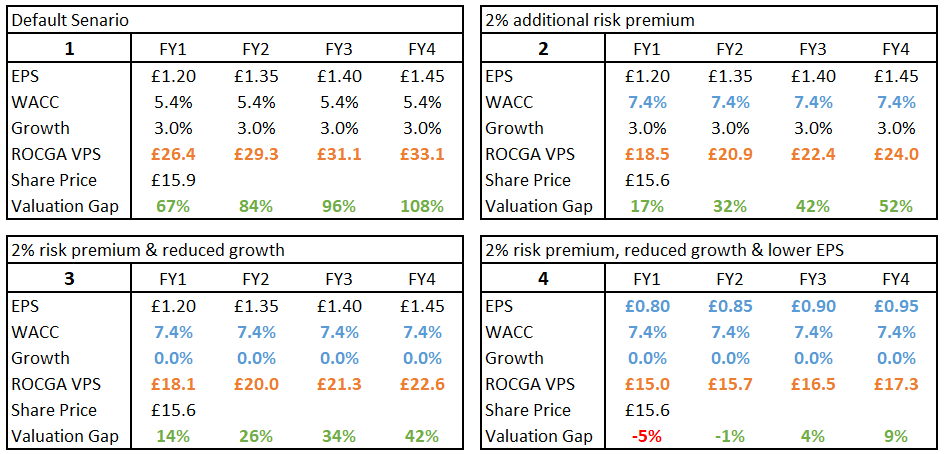
Scenarios 1 and 4 are the two extremes. With 1 we see potential upside approaching 100% and beyond, and with our worst-case scenario 4, ABF is currently fair value. We believe ABF deserves a position somewhere in between and currently, we like scenario 2 or 3. The target price is approaching £20 for FY2. Keeping an eye on the economy, the UK and Europe in particular where over two-thirds of revenues are generated, we would move along the four outcomes. With the outcome worsening and the recession deeper and longer than expected, we would slide down to scenario 4, or up closer to 1 if the outlook improves.
Conclusion
The 25% decline in the price has presented a buying opportunity for ABF. The company is well placed to weather the impending economic storm ahead with its value products in retail and more inelastic products in its food and groceries segment. Margins will be affected by uncertain and higher input costs, but given the current share price, we see limited downside. This is certainly one you should have in your basket – Buy
Be the first to comment