

Vitalii Petrushenko/iStock via Getty Images
Introduction
I usually don’t like to use the word “crisis”, but there was often no way around it this year. In March, I wrote an article titled “Bunge: A Food Crisis Play”. In this article, I will also update the agriculture situation, however, I’m going to look beyond it and assess Bunge Limited’s (NYSE:BG) qualities as a long-term dividend stock. After all, it has an attractive yield, decent and consistent dividend growth, and a business model stronger than Fort Knox. The only issue is that Bunge isn’t a typical dividend growth stock. It has a history of underperforming total returns with a lot of volatility. That’s extremely important to keep in mind as it makes timing investments much more important.
In this article, I will give you the details.
So, bear with me!
Bunge’s Business Model & Agriculture Trends
While a $13.1 billion market cap doesn’t sound that impressive – compared to other well-known companies – Bunge Ltd. is everything but average. Operating in the consumer staples sector, the company is a leading:
- “global oilseed processor and producer of vegetable oils and protein meals, based on processing capacity;
- global grain processor, based on volume;
- seller of packaged vegetable oils worldwide, based on sales;
- producer and seller of wheat flours, bakery mixes and dry milled corn products in North and South America, based on volume.”
The company also produces sugar and ethanol in Brazil, through its 50% interest in BP Bunge Bioenergia, a joint venture with British oil giant BP (BP).
MarketScreener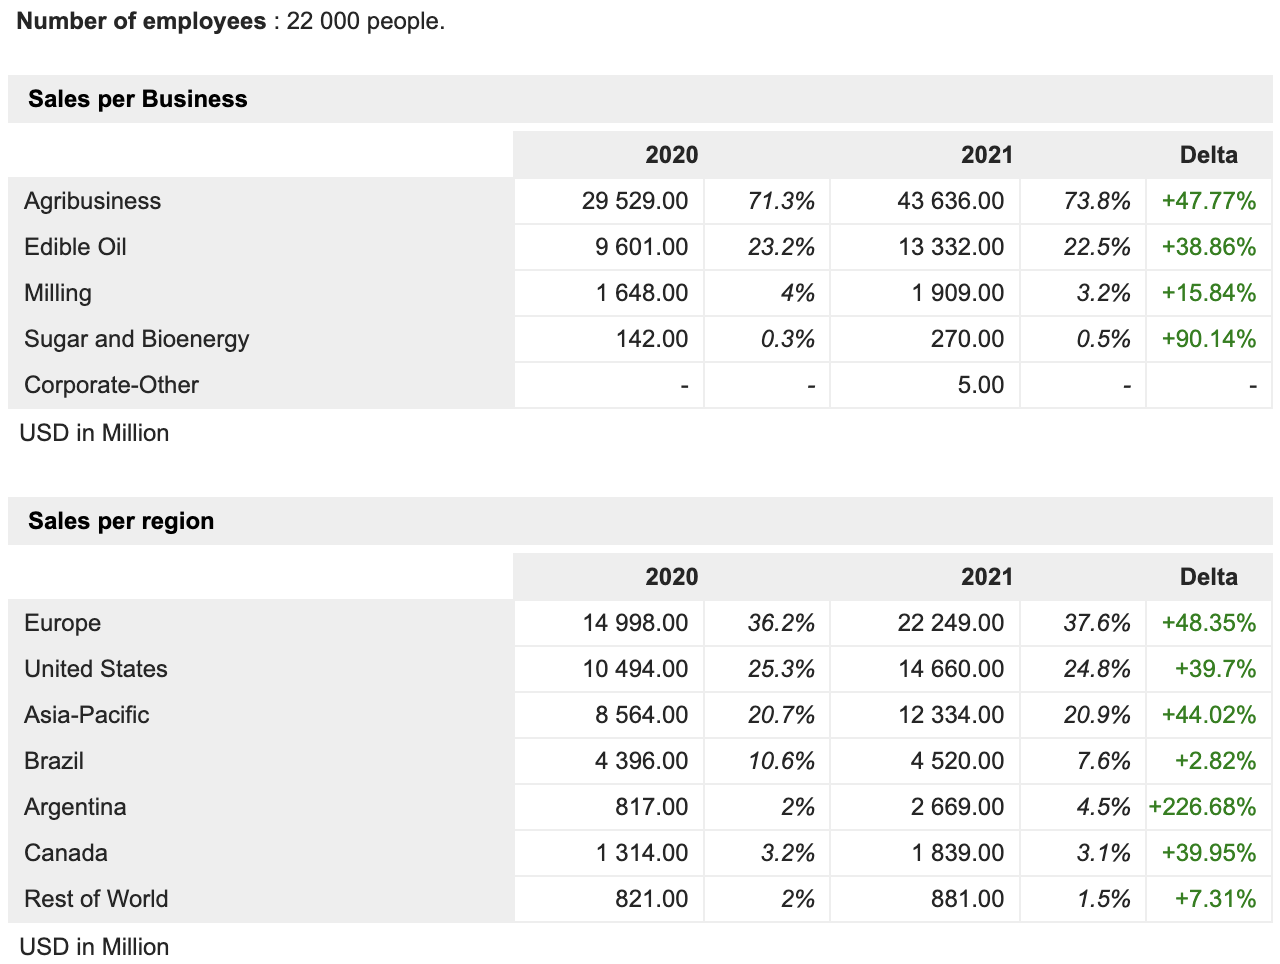
As the overview above shows, the company generates just a quarter of sales in its home country, the United States. This is very common for companies like Bunge who make most of their money operating in the global agriculture supply chain.
Its agribusiness segment, for example, accounting for 74% of total sales involves purchasing, storing, transporting, processing, and selling agricultural commodities. According to the company:
The principal agricultural commodities that we handle in this segment are oilseeds, primarily soybeans, rapeseed, canola, and sunflower seed, and grains, primarily wheat and corn. We process oilseeds into vegetable oils and protein meals, principally for the food, animal feed and biofuel industries, through a global network of facilities. Our footprint is well balanced, with approximately 33% of our processing capacity located in South America, 26% in North America, 25% in Europe and 16% in Asia-Pacific.
In September 2021, the company announced a Joint Venture with oil giant Chevron (CVX). It’s a no-brainer as it allows Bunge’s expertise in soybean processing to benefit from Chevron’s bigger network and bigger balance sheet. Both companies are working to expand their business in renewable fuels and lower-carbon feedstocks.
In the introduction, I called Bunge’s business model stronger than Fort Knox. That wasn’t an exaggeration but a way to say that it’s as bulletproof as it gets. While Bunge remains very dependent on agriculture margins (after all, it turns grains it buys into value-added products), it operates in supply chains that withstand every single recession. Moreover, it’s expensive to compete with Bunge. It involves building export terminals, and processing plants, and establishing relations with thousands of third parties.
Bunge was founded in 1818, new entrants have almost no chance of competing in this industry.
With that said, and with regard to Bunge’s business, I’m comparing Bunge’s stock price to the stock price of its JV partner Chevron in the chart below. Both are behaving very similarly, although one is a major oil producer while the other trades, processes, and sells agricultural commodities.
TradingView (Black = BG, Orange = CVX)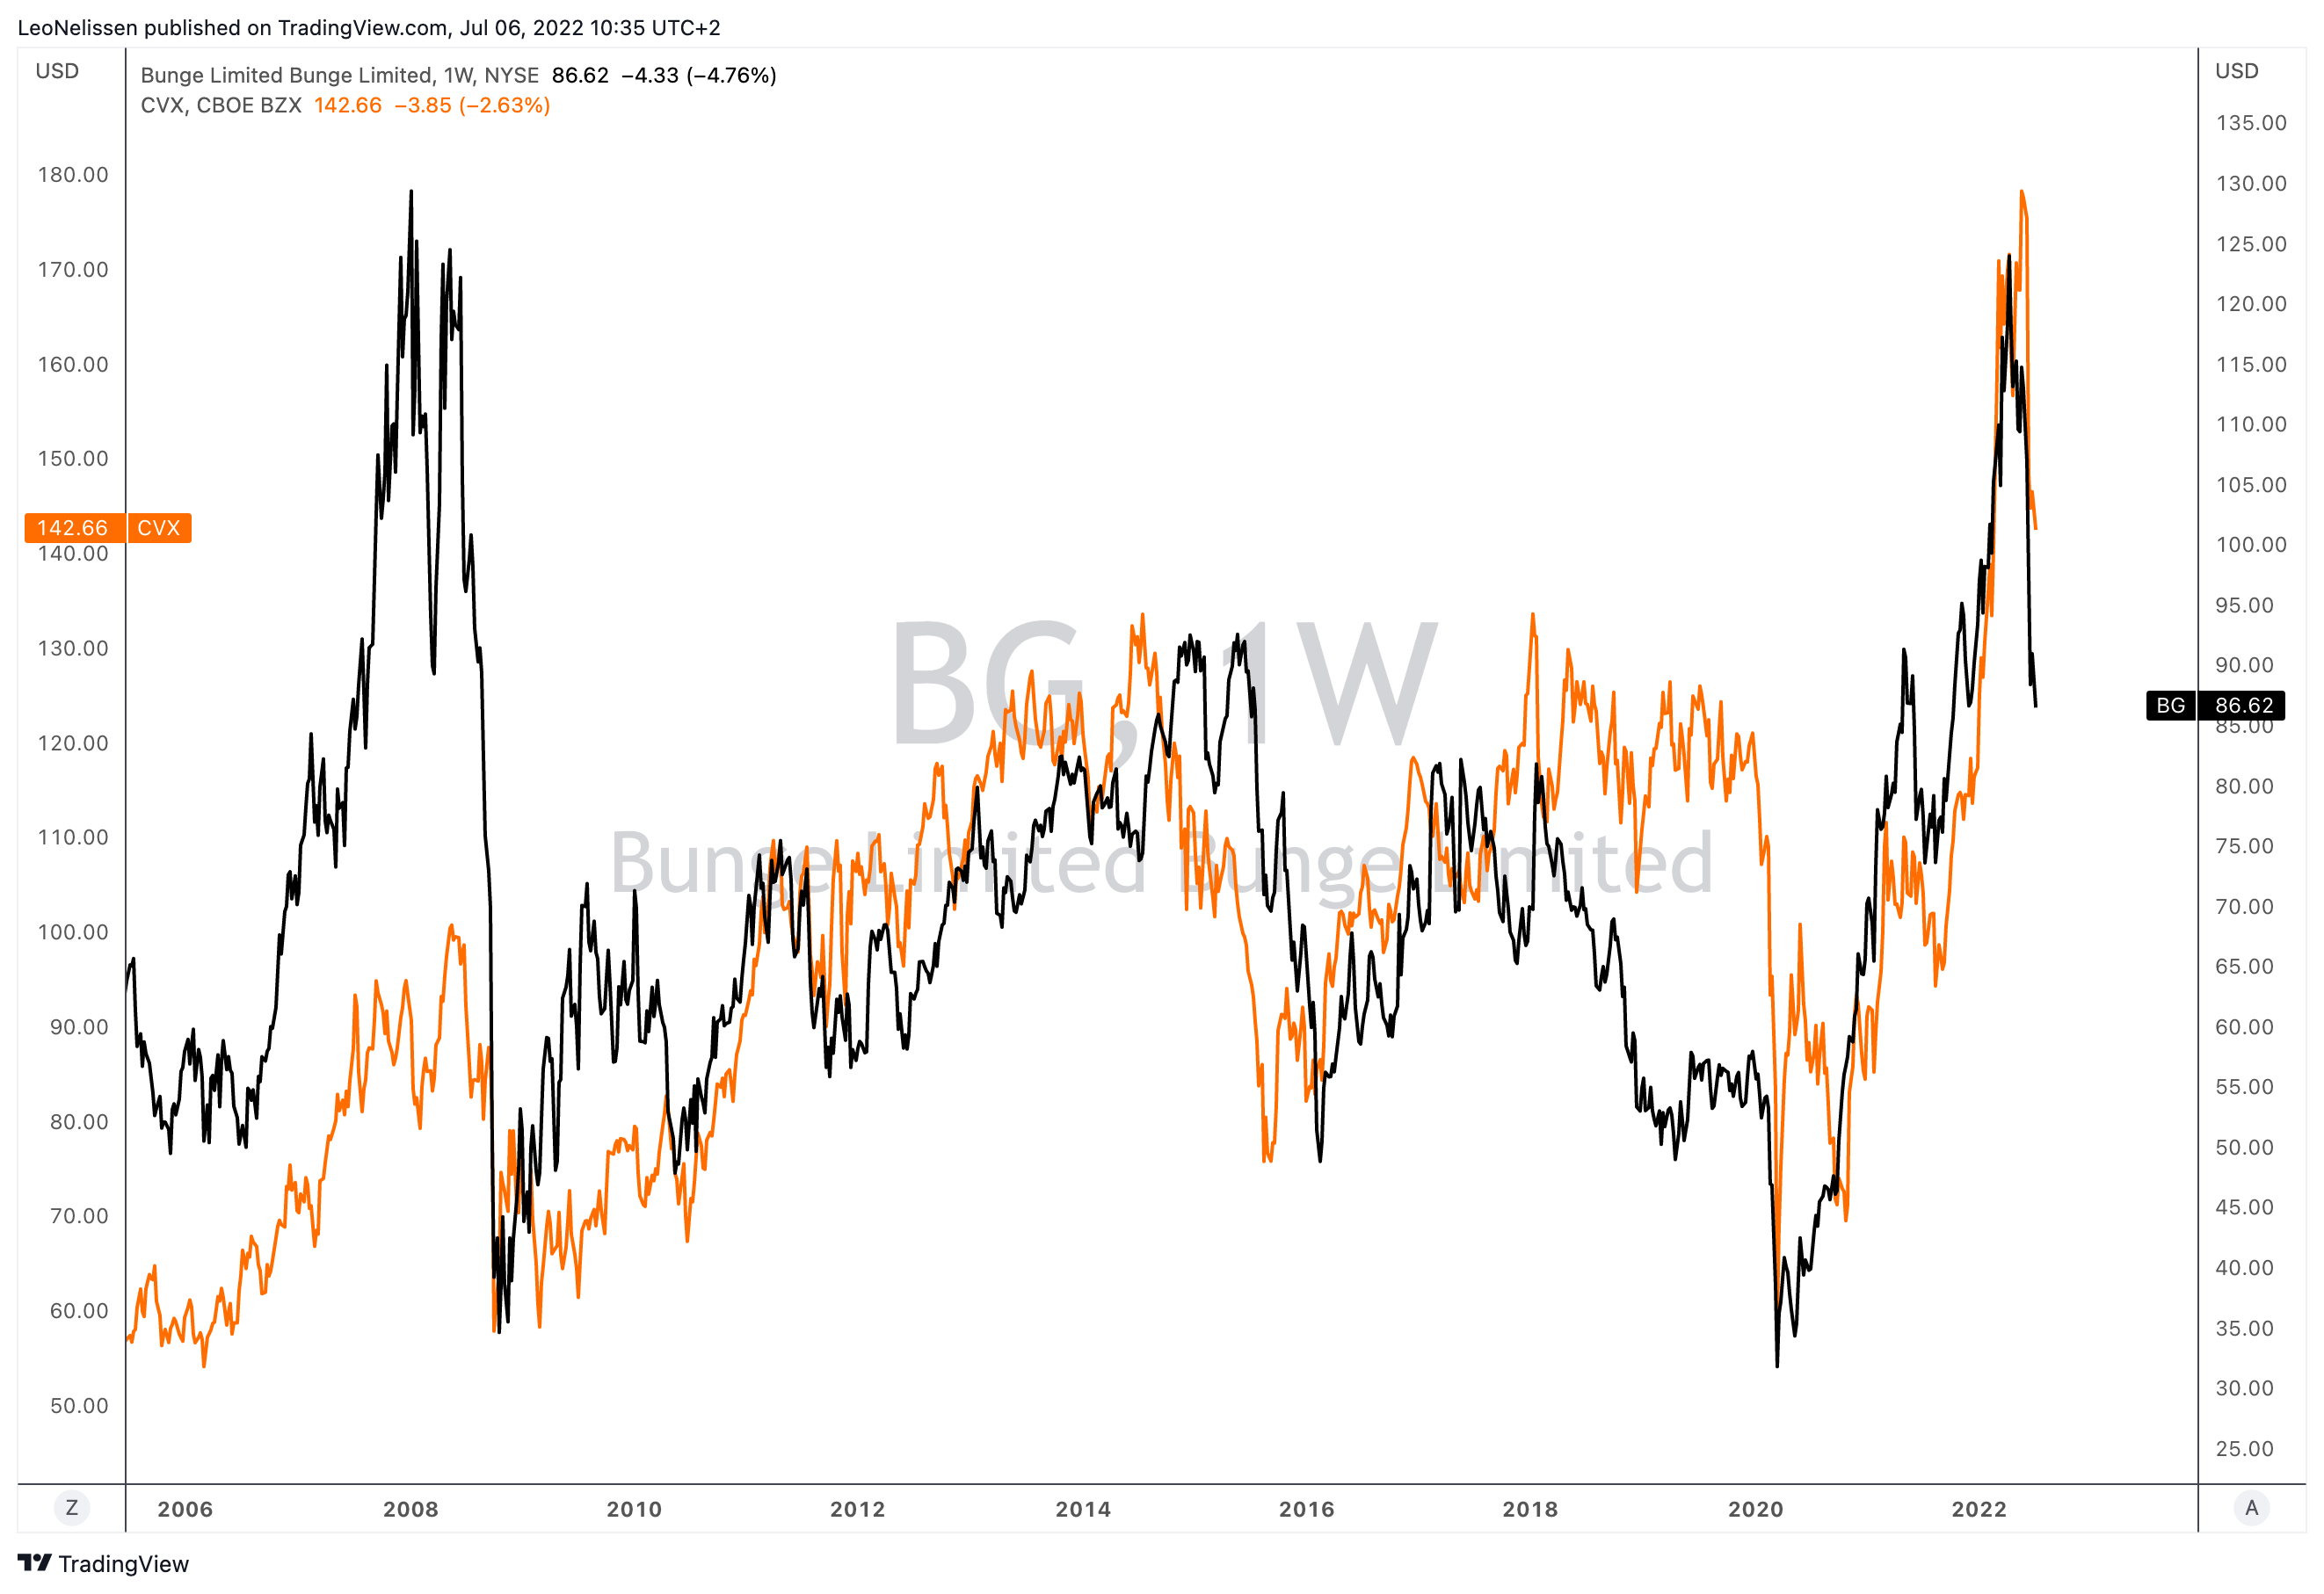
I sometimes say that investing in agriculture is like buying energy, except that politicians don’t hate it as much.
The reason I’m mentioning the Bunge/Chevron correlation isn’t just to bring up two partners in renewable energy but to make the point that energy drives agriculture.
The graph (not updated) below shows the long-term correlation between corn and oil.
CME Group
In this case, I’m using corn, which is the number one planted grain type in terms of used acres. It’s a key ingredient for animal food, ethanol production (an energy commodity), it is fertilizer intensive, and used in various chemical processes.
Moreover, energy drives production costs, which means it’s a driver of agricultural commodities given that crops tend to trade at the cost of production:
Teucrium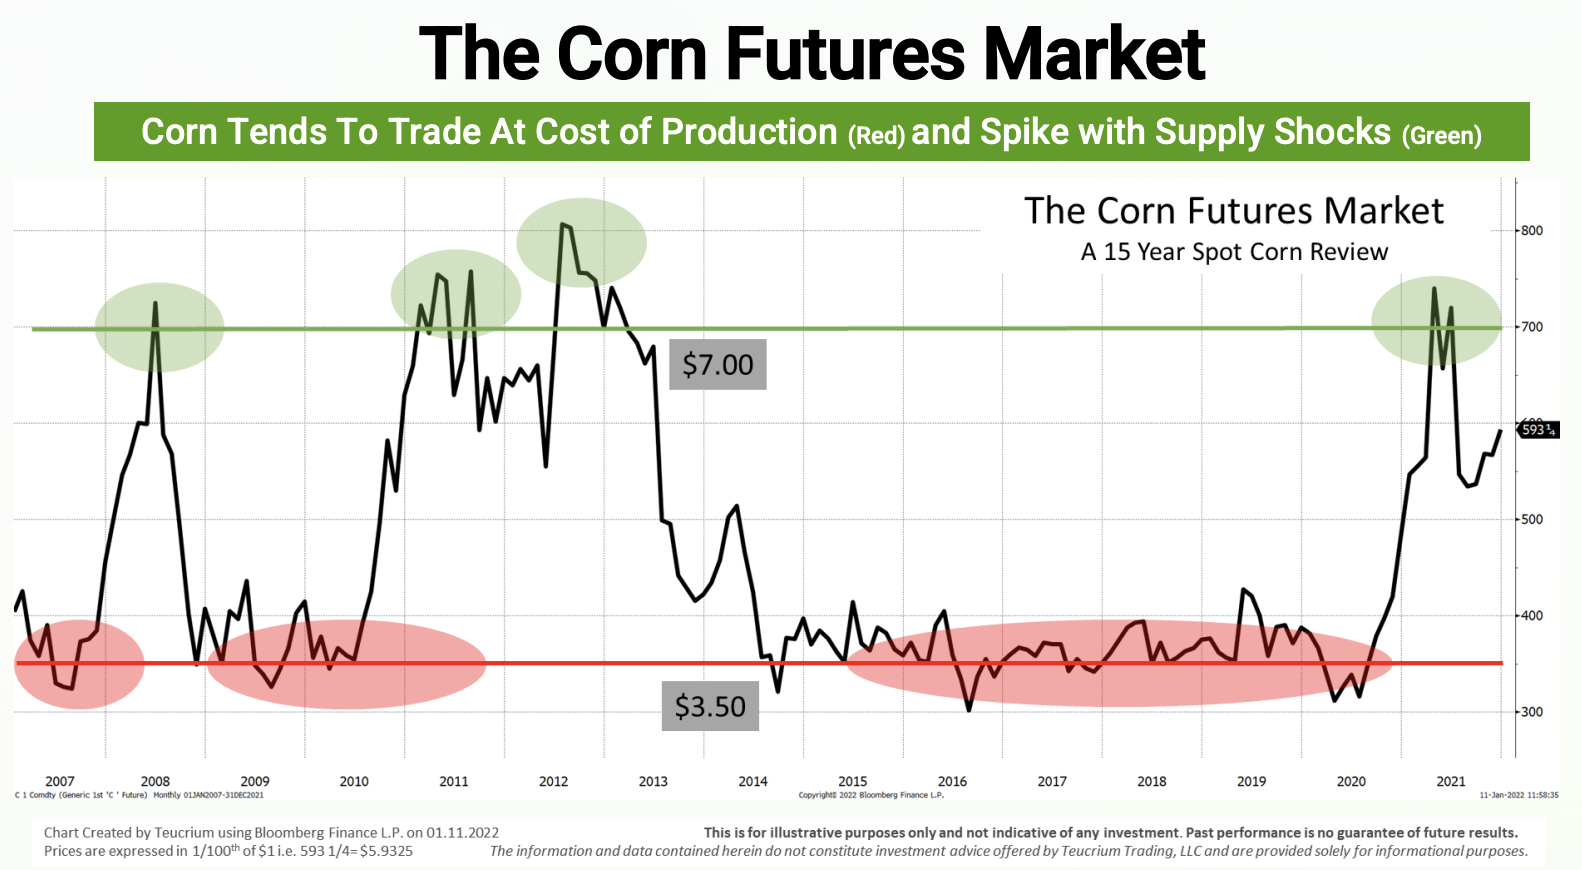
With that said, I remain bullish on agriculture for (at least) two reasons:
- I believe that energy will remain in a long-term uptrend due to supply/demand dynamics – as explained in this article (among others).
- Agriculture supply/demand is likely to remain tight.
The war in Ukraine is keeping a lid on exports. The same goes for high fertilizer costs that keep production costs for key crops high.
According to the German agriculture website Agrarheute (translated):
Little has changed in the fundamental data on supply and demand, even though one announcement about possible Ukrainian export relief follows the next. It is also a fact that Ukraine will harvest significantly less wheat and maize this year than last year and that this grain will be very difficult to market logistically. Even if the ports partially reopen. Which is by no means certain.
Additionally, crop conditions are further deteriorating. The chart below shows that corn crop conditions (good + excellent) are on their way to falling below 2021 levels.
USDA/NASS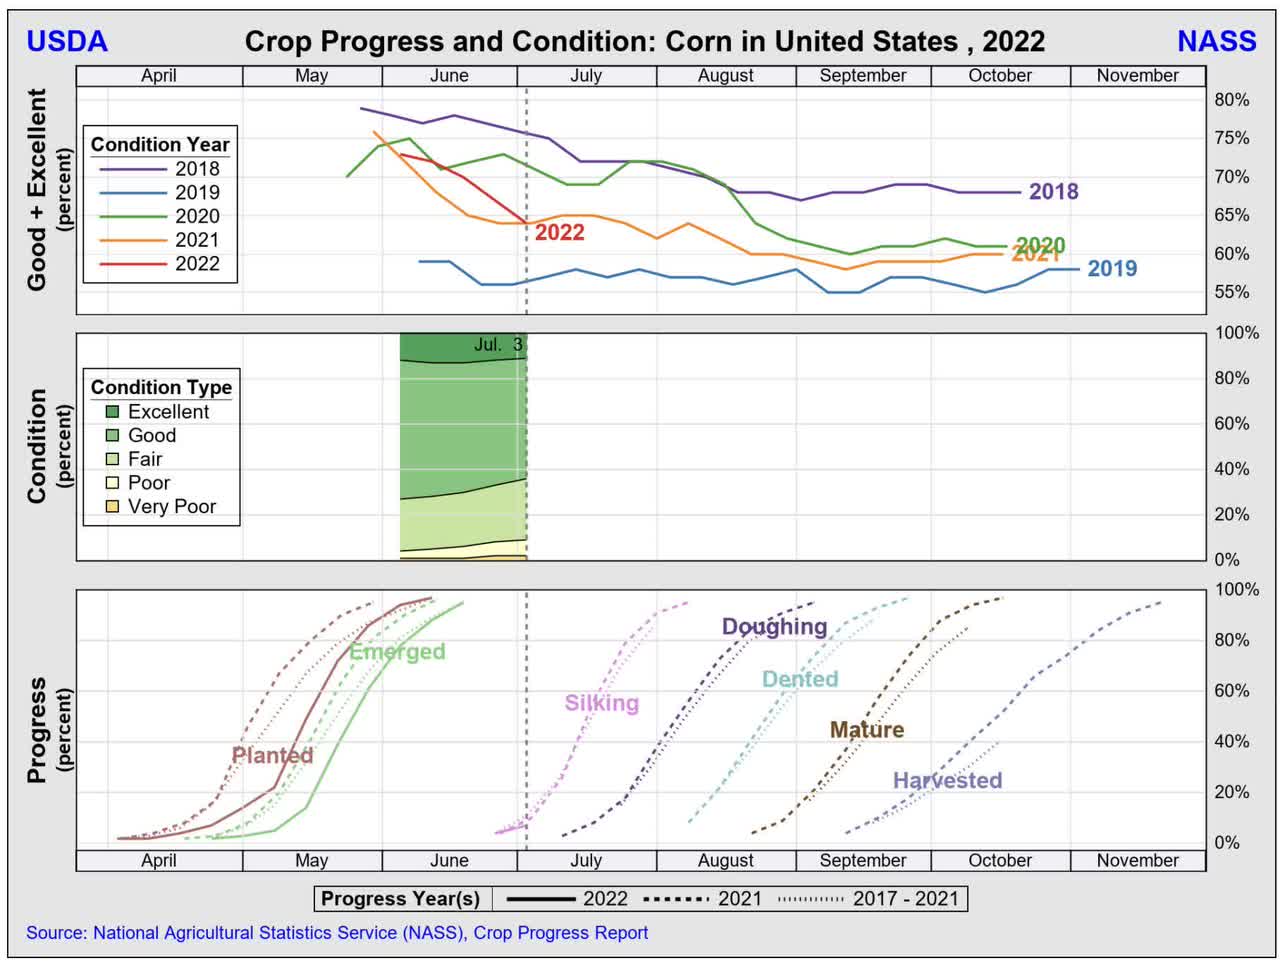
In general, we’re in an environment that benefits low-margin companies in the agriculture supply chain. Pricing is better, and exports from North America are more important than “ever”.
As the company commented in April (1Q22 earnings):
[…] While we incurred losses in our Black Sea operations, our team effectively responded to the situation when industry margins spiked globally due to the combination of continued strong demand and an even tighter supply outlook.
In Refined & Specialty Oils, strong results were largely driven by North America refining. Our team used the optionality of our complete portfolio of oils, our global network and our technical expertise to help customers solve their supply challenges. Results in milling were also higher, with our team having effectively managed the supply chain and input cost volatility.
The agriculture bull market that started in 2020 is now leading to much higher returns for (a lot of) companies in the supply chain. Bunge, for example, is now seeing double-digit returns on invested capital again. Note that its weighted average cost of capital is 6.0%.
Bunge Ltd.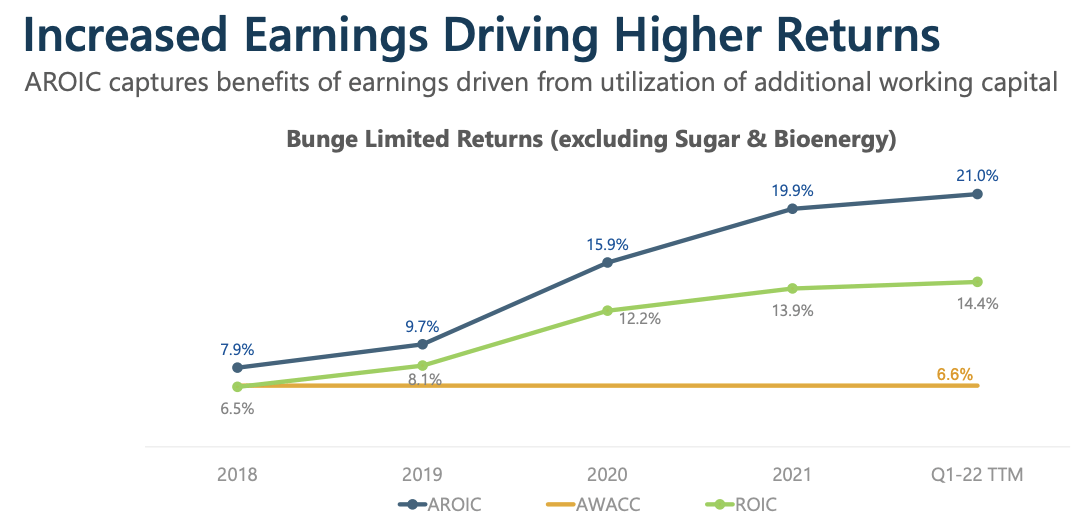
The same goes for other financial metrics like cash generation.
Bunge Ltd.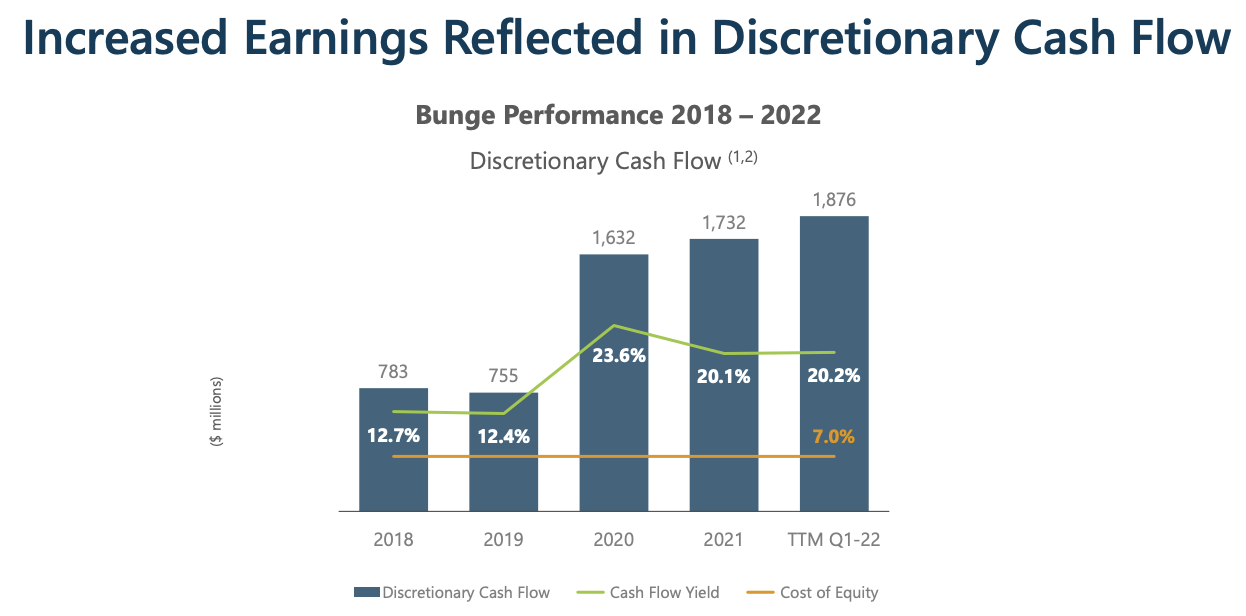
This brings me to the dividend.
The Bunge Dividend
As the charts above show, Bunge is now in a better economic environment. It is expected to maintain high EBITDA results above $2.4 billion for years to come. With that said, this is usually the part where I show you the expected free cash flow. However, in the case of Bunge, it’s a bit more complicated. Free cash flow is negative in most years.
TIKR.com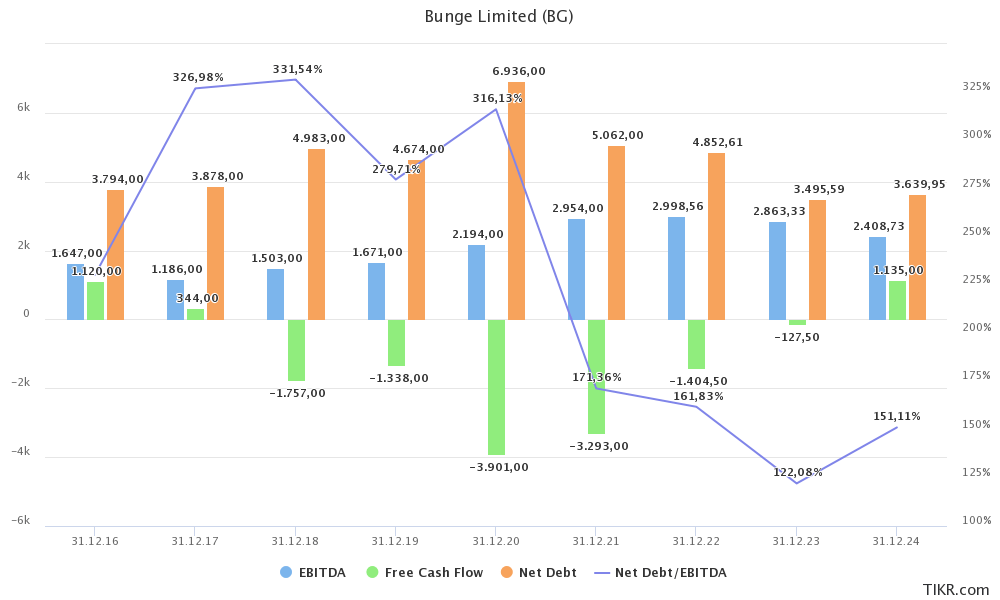
Free cash flow is technically speaking negative, but not because of low earnings or high capital expenditures. Bunge engages in the securitization of trade receivables. This lowers cash provided by operating income.
Bunge 1Q22 10-Q (via SEC)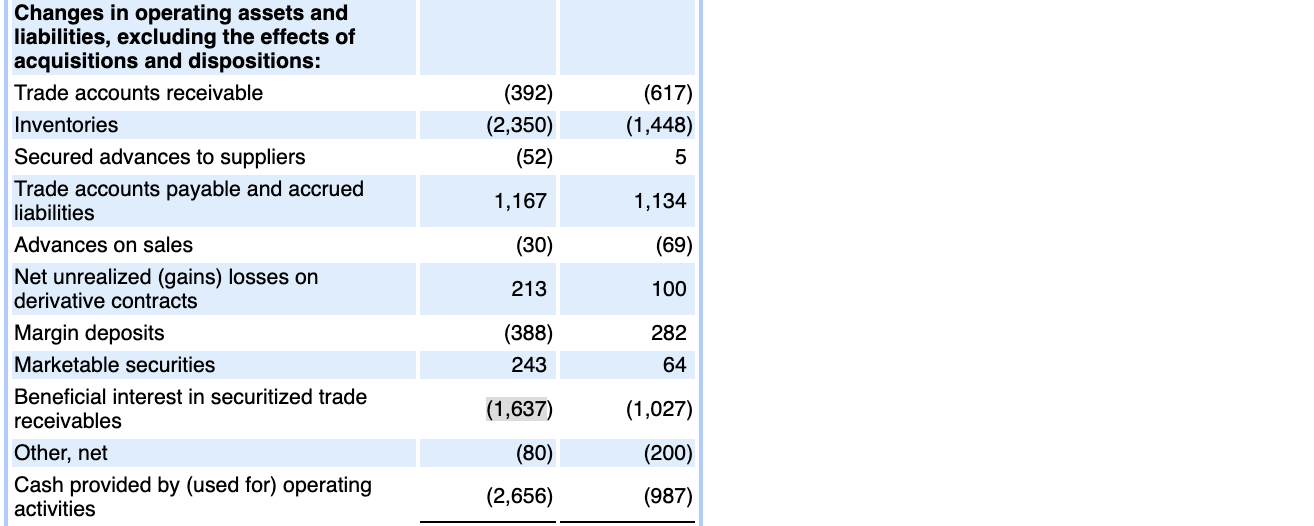
This means that:
A larger organization can convert its accounts receivable into cash at once by securitizing the receivables. This means that individual receivables are aggregated into a new security, which is then sold as an investment instrument. A securitization can result in an extremely low interest rate for the issuing entity, since the securities are backed by a liquid form of collateral (i.e., receivables).
In the case of Bunge, the company has extremely reliable receivables as its customers are all major companies in the food and agriculture supply chain. It’s not comparable to credit card debt at a local sneaker store. Note that net debt is expected to be valued at 1.6x EBITDA this year, which is a further indication that financial risk is low.
Hence, using the company’s own data (see the graph in this article), we’re dealing with roughly $1.9 billion in adjusted free cash flow over the past four quarters – ending 1Q22.
Based on the company’s $13.1 billion market cap, it’s a 14.5% free cash flow yield.
That’s a fantastic basis for satisfied shareholders.
Using the Seeking Alpha dividend scorecard for Bunge, we see that it scores high in all categories – relative to its consumer staples peers.
Seeking Alpha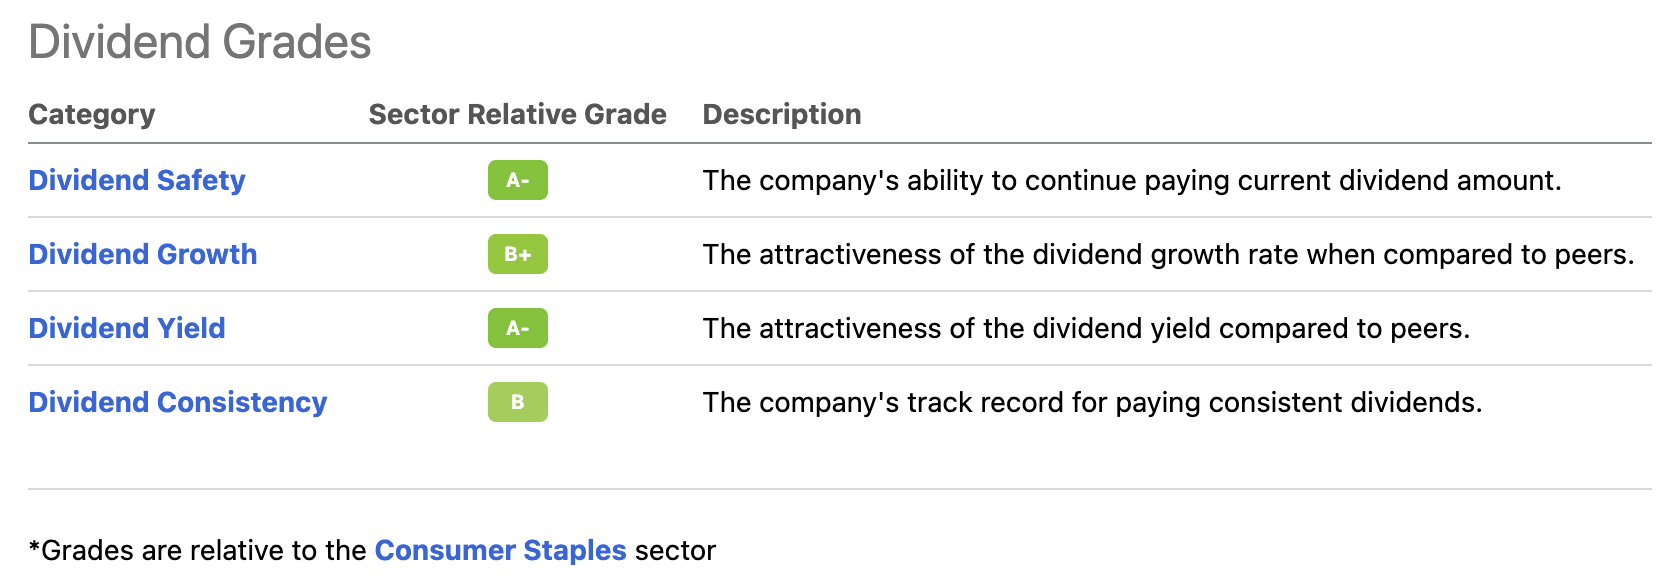
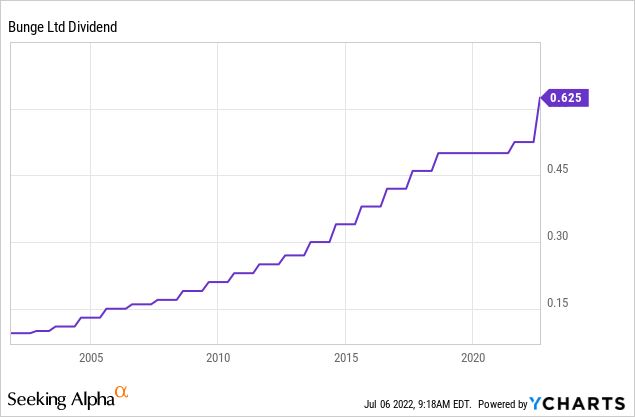
The company pays a $0.625 dividend per share per quarter. That’s $2.50 per year or 2.9% of the current stock price – the dividend yield.
2.9% is a decent number and backed by improving dividend growth. After all, a double-digit free cash flow yield supports a much higher dividend.
Over the past 10 years, the average annual dividend growth was 7.7%.
On May 12, 2022, the company hiked by 19%. On May 4, 2021, the hike was 5.0%.
So far, the benefits of BG are:
- A strong business model
- A healthy balance sheet
- High free cash flow
- A 2.9% yield
- Satisfying long-term dividend growth
If 7.7% long-term annual dividend growth holds, a 2.9% yield quickly turns into a 4.2% yield on cost five years from now. 10 years from now, it could be 6.1%. That’s not too bad.
However, two reasons not to buy BG are:
- It’s a slow-growth business on a long-term basis
- It’s prone to commodity price cycles and low margins
Since 2010, Bunge has returned 5.3% per year with a standard deviation of 25.0%. The S&P 500 has returned 12.3% with a standard deviation of just 14.3%. The consumer staples ETF (XLP) has returned 11.3% per year with an almost equal standard deviation. Hence, Bunge scores abysmally low on a volatility-adjusted performance basis.
Portfolio Visualizer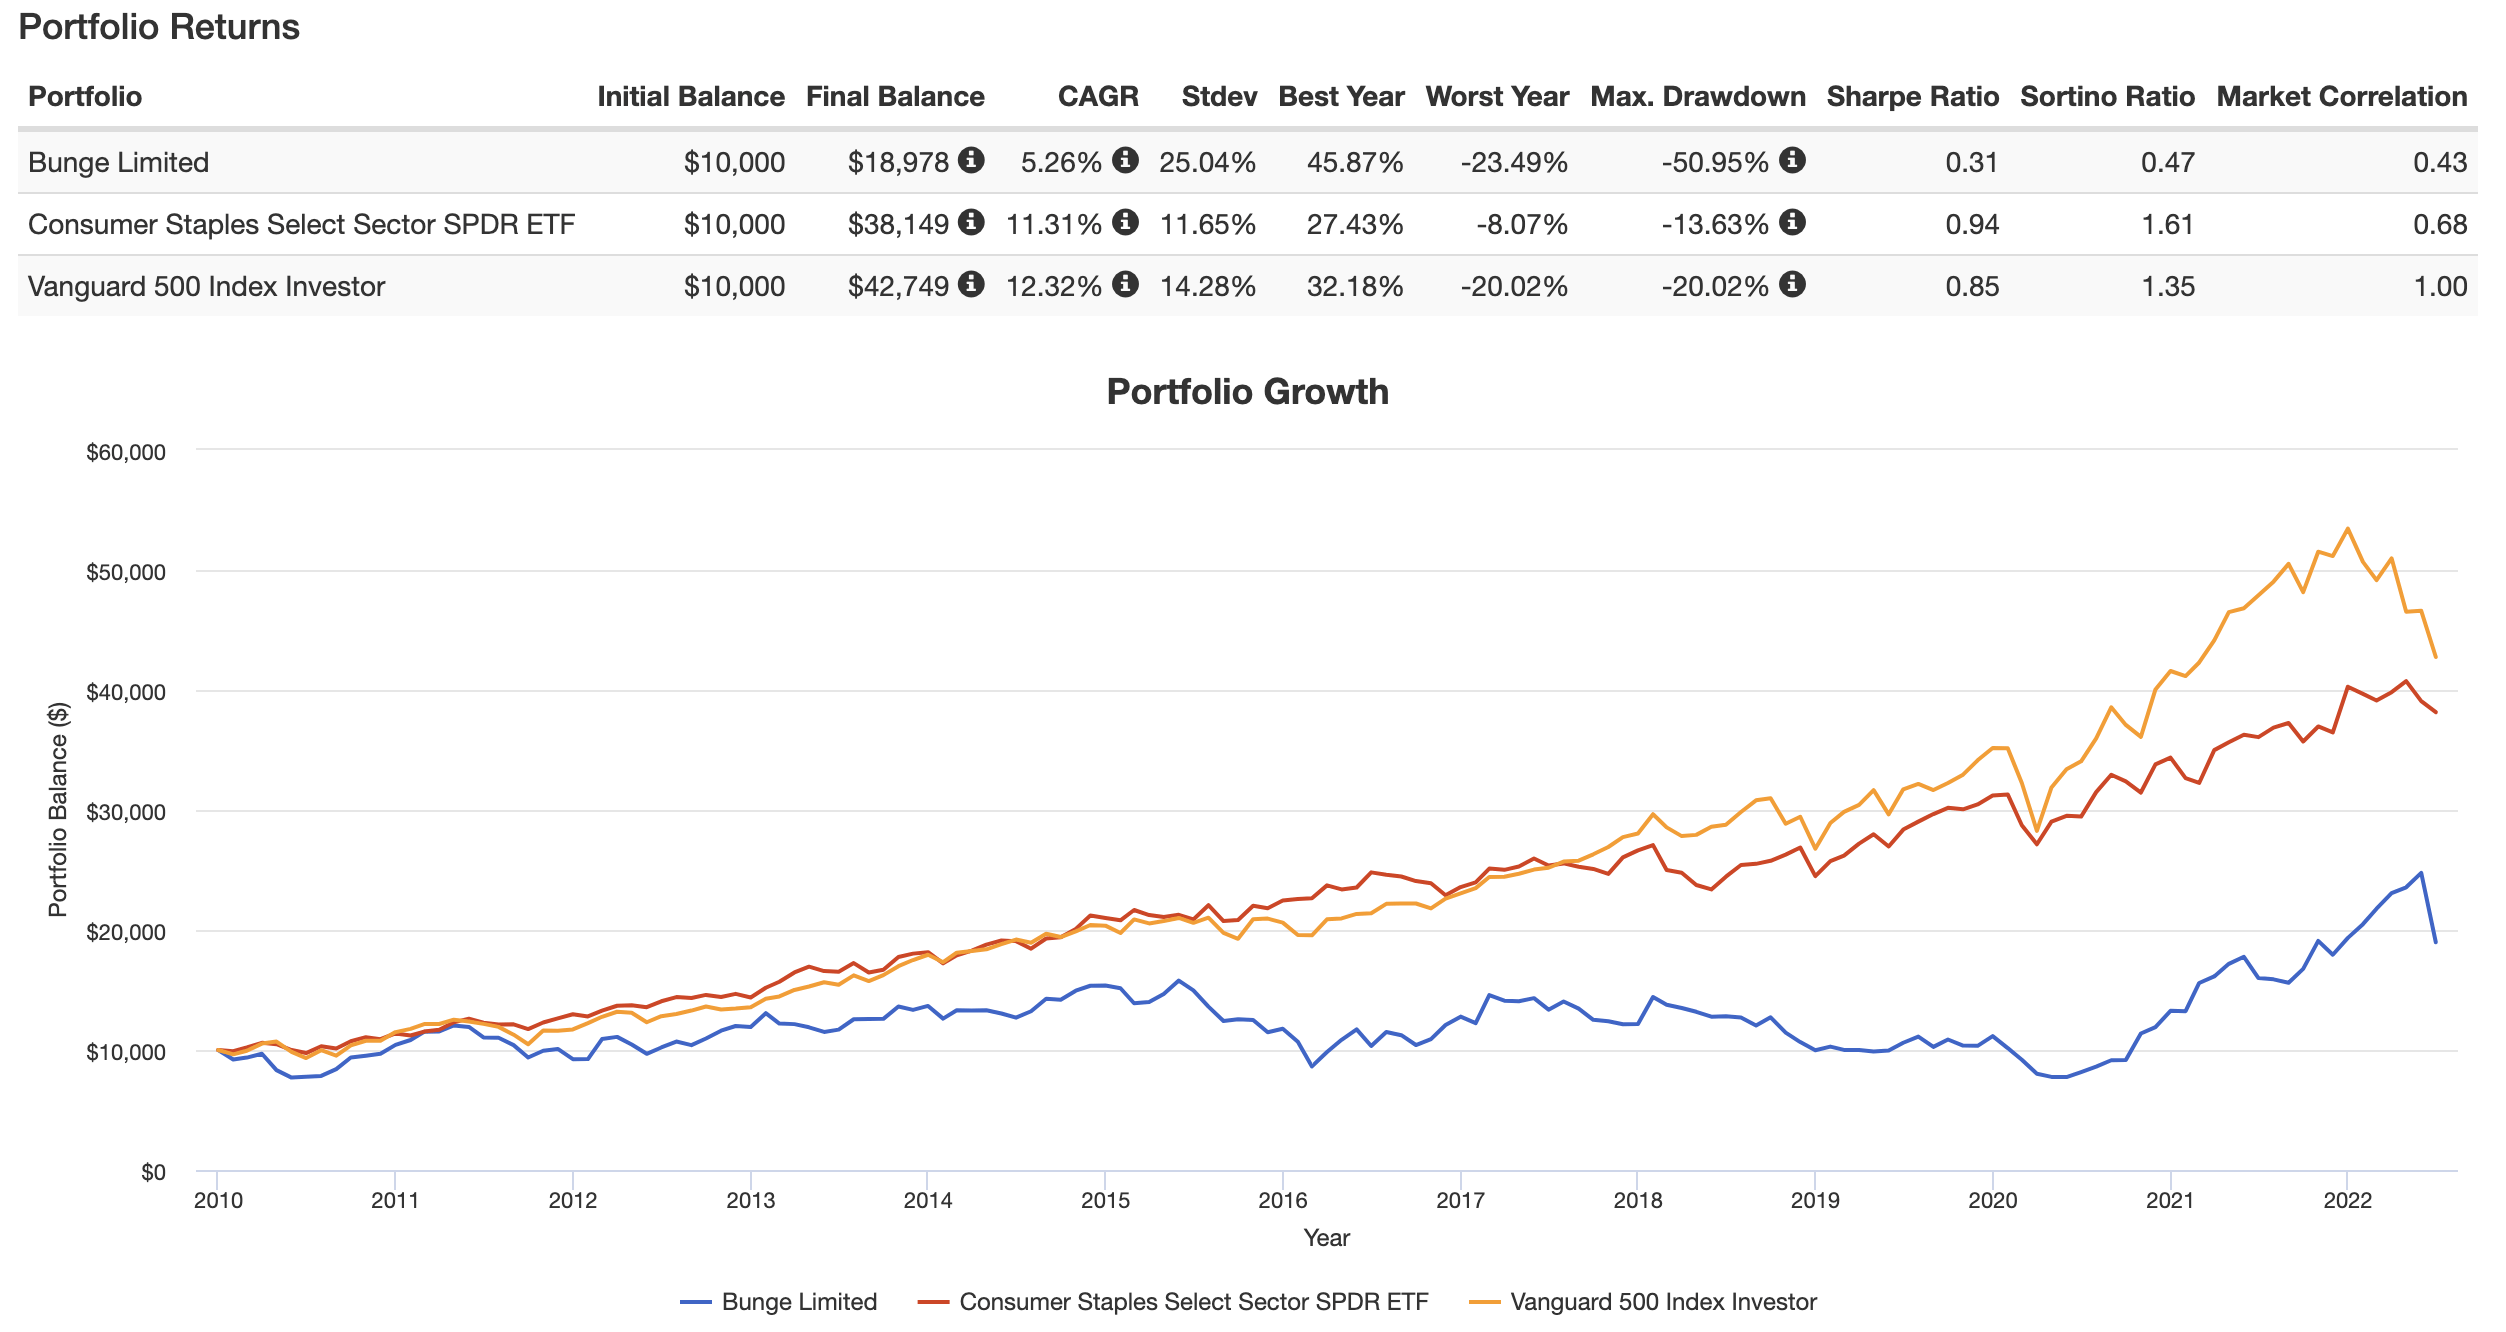
Hence, I believe that BG stock purchases need to be timed right. I’m not saying to only buy the bottom (that’s often not even possible) but to use weakness to initiate a position.
Right now, we’re dealing with a $13.1 billion market cap, $3.5 billion in expected 2023 net debt, $220 million in pension-related liabilities, and $530 million in minority interest giving the company an enterprise value of $17.35 billion.
This implies a 6.0x 2023 EBITDA valuation. That’s too cheap. Even conservatively speaking, BG should be trading at 7.5x 2023 EBITDA, or at least 30% above current prices.
TIKR.com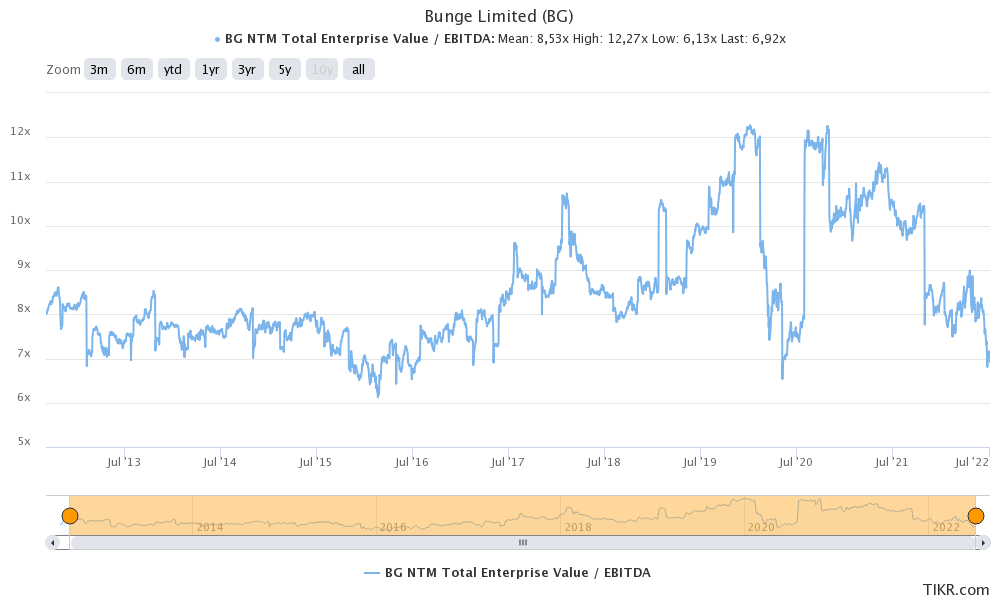
Takeaway
In this article, I explained why Bunge is in a good position to generate higher free cash flow and earnings for years to come. While agriculture is currently in a downtrend, I remain optimistic that crop prices will remain above average and work their way up again. In this case, backed by high demand as well as supply issues.
This is good news for a well-diversified company like Bunge, resulting in a strong, double-digit, free cash flow yield used to boost its current 2.9% dividend yield.
Bunge has a healthy balance sheet, a stellar business model, and the ability to deliver high income for income-seeking investors.
It also helps that BG shares seem to be undervalued by at least 30%.
The drawdowns of this thesis are that BG has a long-term history of high volatility (because of low margins tied to commodity cycles) and relatively low total returns.
Please keep that in mind when assessing whether BG is the right stock for you.
(Dis)agree? Let me know in the comments!
Be the first to comment