

BING-JHEN HONG/iStock Editorial via Getty Images
In our previous analysis of ASE Technology Holding (NYSE:ASX), we compared the company with Amkor as two of the largest Outsourced Semiconductor Assembly and Test (OSAT) companies globally. We determined that ASE’s packaging and testing capabilities are similar to Amkor in terms of the types of services offered but ASE has a larger scale and a more diverse business model that also includes EMS. Moreover, another strength we identified is its geographic advantage based in Taiwan and having a strategic alliance with TSMC (TSM) (world’s largest foundry) and believed its deep relationship with the company could enable it to continue serving high profile customers such as Apple (AAPL), Qualcomm (QCOM) and Nvidia (NVDA). Lastly, we determined that ASE leads the communications end market which accounts for 53% of its revenues as its largest segment and expected its partnership with Qualcomm to provide OSAT services for 5G chips to continue supporting its growth in the communications segment.
In this analysis, we focused on its OSAT business which is 58% of its total revenues. We examined its OSAT packaging segment driven by advanced packaging growth enabling better chip performance. Moreover, we analyzed its revenue by customer end markets where communications account for the largest contributor to its OSAT revenues and expect the share of its total revenue to continue rising with customer relationships with smartphone chipmakers and Apple for advanced packaging solutions. Finally, we determined the profitability of the company that is weighed down by the stronger EMS segment growth which commands lower margins than its OSAT business.
Increased Performance from Advanced Packaging Driving OSAT Demand
Based on its annual filings, for its OSAT activities, the company engages in advanced packaging solutions under its bumping, flip-chip, WLP, Fan-out and SiP segment which accounts for 42% of packaging revenues. Its share of revenues for this segment as a % of total revenues has grown in the past 10 years from 16.3% of total packaging revenues due to a higher average growth rate of 20.4% compared to its traditional IC wire bonding segment which has grown at an average of only 7% during the same period.
ASE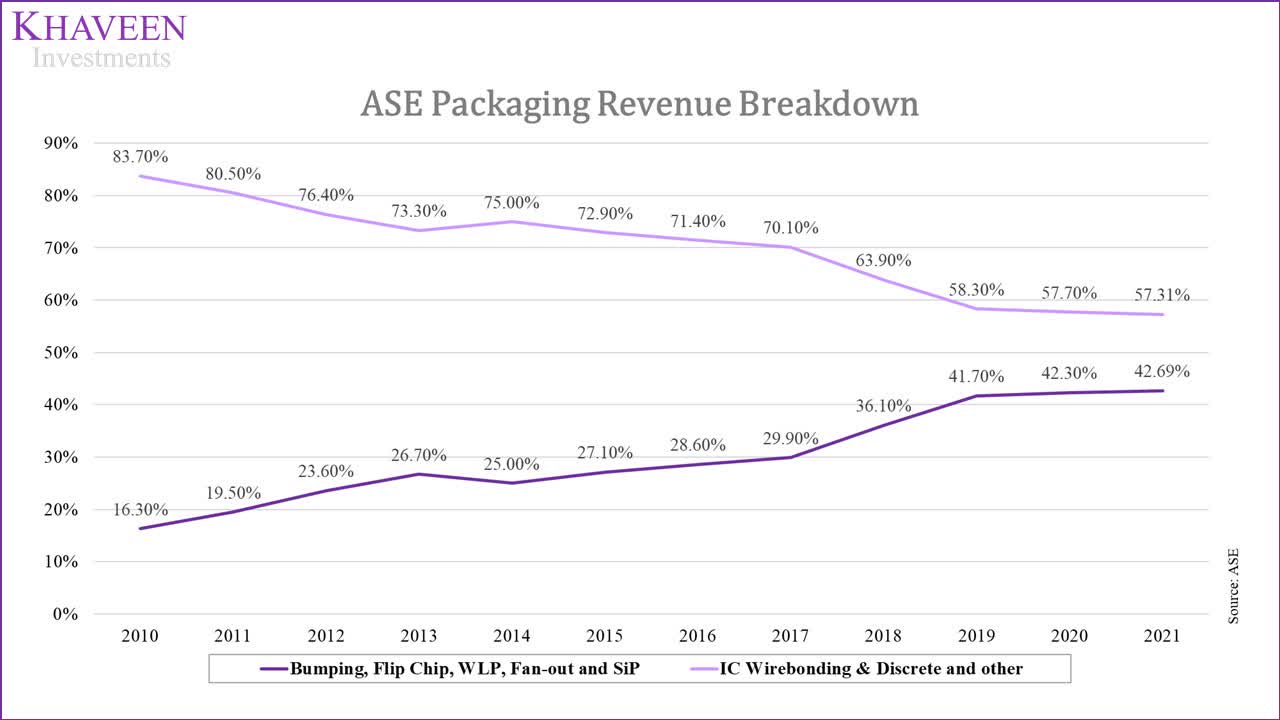
According to Yole Development, the advanced packaging market is forecasted to grow at a CAGR of 8% through 2026 and outpacing the forecasted growth of the traditional packaging market at a CAGR of 4.3% until 2026. Also, based on the forecast, the advanced packaging market is expected to represent around 49.8% of the total $95.4 bln semiconductor packaging market in 2026.
The growth of advanced packaging is driven by performance gains achieved through advanced packaging technologies as scaling becomes more challenging. This is explained by Samsung on the diminishing performance gain from the transition before 14nm and following generations.
Before 14nm, there was a 30% improvement in price/performance at each node. From 14nm to 10nm, there is more than 20% improvement, and at less than 10nm there is more than 20%. At 3nm, there is about 20% improvement. – ES Jung, executive vice president and general manager of the foundry business in Samsung’s Device Solutions Division.
Semi Engineering, KLA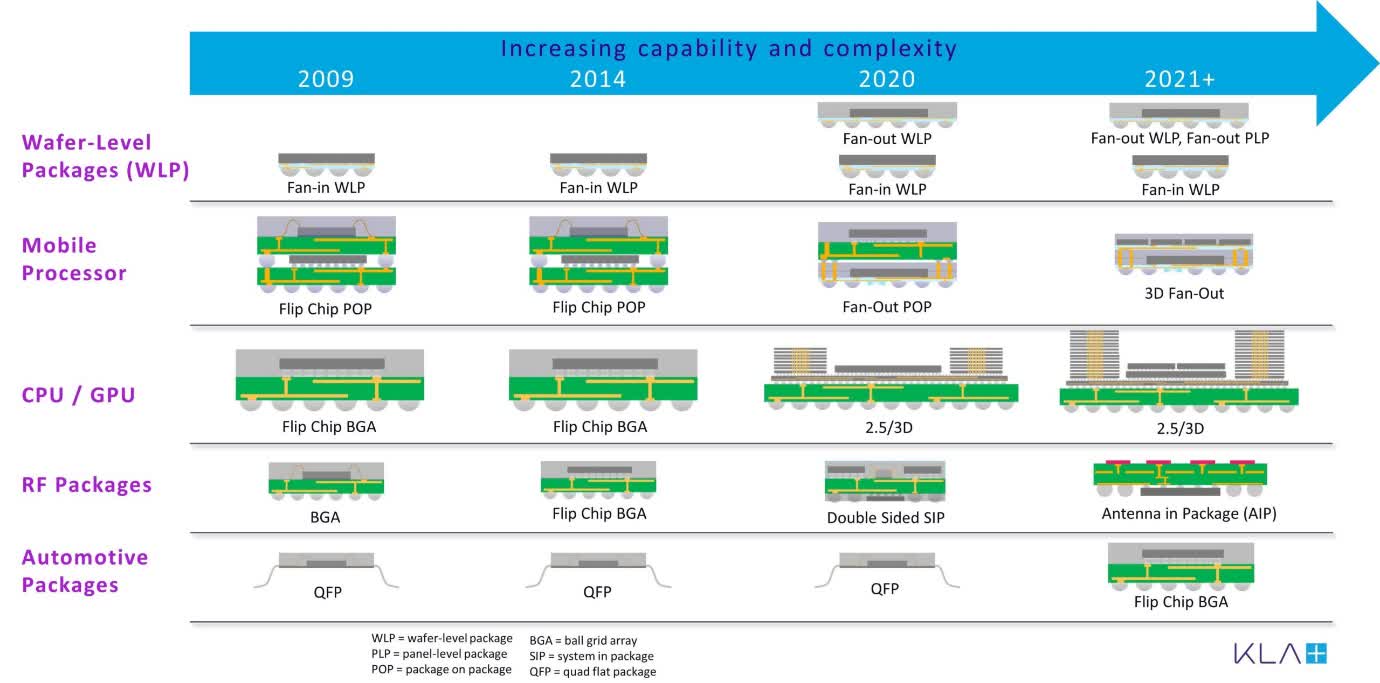
The diagram shows the evolution of packaging technology with increasing packaging complexity for newer generations of high-performance chips such as mobile processors, CPU/GPUs, RF and automotive packages. According to industry sources, as reported by Digitimes, ASE is believed to be secure orders from Qualcomm for the launch of its next-generation mobile application processors using board based FCCSP technology.
We projected ASE’s packaging revenue through 2025 based on its segments. For the Bumping, Flip Chip, WLP, Fan-out and SiP, we used Yole Development’s forecasted advanced packaging CAGR of 8% through 2025 and 4.3% traditional packaging CAGR for the IC wire bonding, discrete and other segments.
|
ASE Packaging Revenue (TWD mln) |
2019 |
2020 |
2021 |
2022F |
2023F |
2024F |
2025F |
2026F |
|
Bumping, Flip Chip, WLP, Fan-out and SiP |
82,948 |
92,496 |
115,290 |
124,513 |
134,474 |
145,232 |
156,851 |
169,399 |
|
Growth % |
28.9% |
11.5% |
24.6% |
8% |
8% |
8% |
8% |
8% |
|
IC Wirebonding, discrete and other |
115,968 |
126,170 |
154,757 |
161,412 |
168,352 |
175,592 |
183,142 |
191,017 |
|
Growth % |
1.8% |
8.8% |
22.7% |
4.30% |
4.30% |
4.30% |
4.30% |
4.30% |
|
Total Packaging |
198,917 |
218,666 |
270,047 |
285,925 |
302,827 |
320,824 |
339,993 |
360,416 |
|
Total Growth % |
11.6% |
9.9% |
23.5% |
5.9% |
5.9% |
5.9% |
6.0% |
6.0% |
Source: ASE, Yole Development, Khaveen Investments
Overall, we believe that the growth opportunities of the advanced packaging market are to be driven by the need for more complex packaging solutions offering greater integration of chip functions within packages, enabling greater performance and lower latency to benefit ASE’s packaging revenues. As its advanced packaging segment revenues account for 42% of its total packaging revenues, we see our forecasted growth based on the market CAGR to drive its packaging revenues higher through 2026.
Smartphone Advanced Packaging Solutions to Boost Communications End Market Revenues
ASE’s OSAT revenue breakdown by end market customers through its ATM segment is split between communications, computing and consumer electronic/industrial/automotive/other. Communications represent its largest end market customer accounting for 50% of its segment revenues in Q4 2021. In the past 10 years, the communications market remained its largest customer end market by revenue.
ASE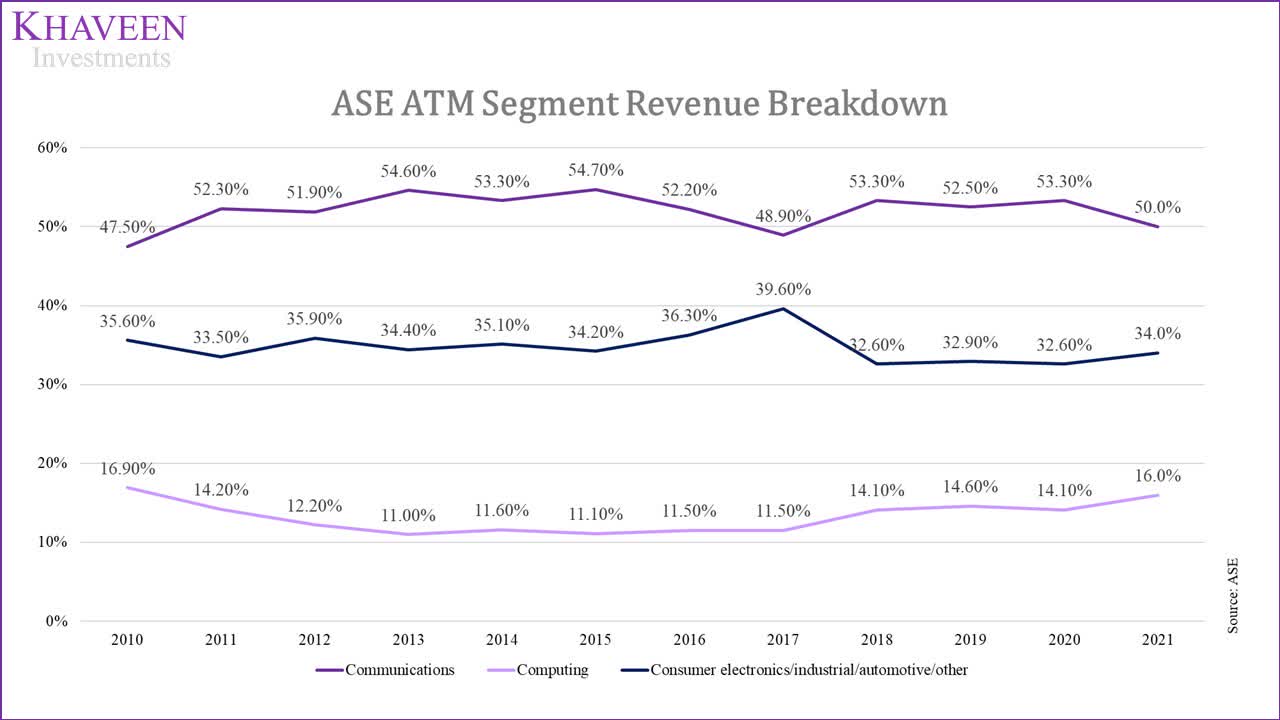
Furthermore, in terms of average growth by end market customers, the communications market has the highest 10-year average growth rate of 10.2% compared to 8.2% for computing and 7.3% for consumer electronics/industrial/automotive/other. Its communications revenue growth is also higher than its total ATM average growth of 8.6%.
|
ASE ATM Revenue by End Market |
10-year Average Growth Rate % |
|
Communications |
10.2% |
|
Computing |
8.2% |
|
Consumer electronics/industrial/automotive/other |
7.3% |
|
Total |
8.6% |
Source: ASE
As mentioned in our previous analysis, the company has a strategic alliance with TSMC which key customers in the communications end market include Apple, Qualcomm, MediaTek (OTCPK:MDTKF) and Broadcom (AVGO) accounting for 49.3% of its revenues according to Statista.
Besides the Qualcomm report as mentioned in the previous point, ASE has also been reported to secure orders from key customers for 5G smartphones. Based on a report by Digitimes, the company was reported to secure big orders from these customers like Apple, Qualcomm and MediaTek. Previously, the company was also reported to secure orders from Apple for flip-chip antenna-in-package to be used for its 5G iPhones and iPads.
Additionally, based on its 20-F filing in 2020, the company’s advanced packaging types is described by the company to be intended for various applications such as application processors for smartphones, RF and wearables.
ASE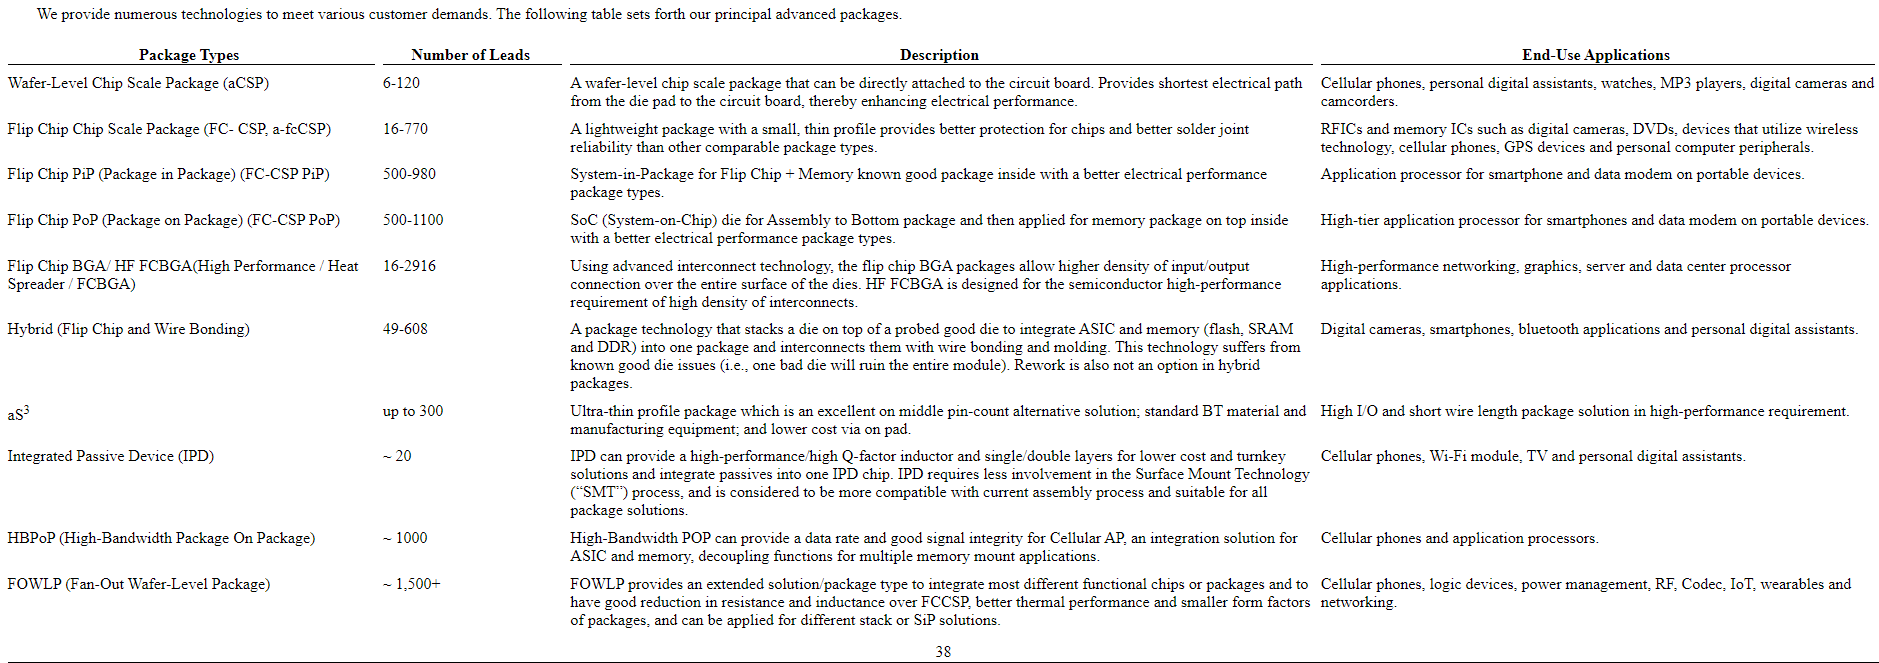
Overall, the communications end market is the largest contributor to its OSAT business revenues accounting for 50% of its ATM segment revenues based on its Q4 2021 earnings release which highlights the market’s significance to the company. We expect ASE’s communications end market revenues to be buoyed by its advanced packaging solutions targeted for smartphones and its relationship with major smartphone chipmakers such as Apple, Qualcomm and MediaTek. Based on a 10-year average growth rate of its share of revenues of 1.3%, we forecast this segment to be 53.3% in 2026.
Margins in 2021 Lifted but expected to be Weighed down by EMS Segment Growth
In terms of ASE’s segment margins, the company’s OSAT business through its packaging and testing segment commands the highest segment margins at 27.5% in 2021 and is higher than the EMS segment of 9%.
|
ASE Segment Gross Margins |
2021 |
|
ATM (Packaging and Testing) |
27.5% |
|
EMS |
8.97% |
|
Total |
19.47% |
Source: ASE
Its difference between the segmental gross margins is due to the difference of margins in the EMS and OSAT industries. We compiled the 5-year average gross margins of its competitors and top 5 EMS players accounting for almost 60% of the market share.
|
OSAT Company |
5-Year Gross Margin |
EMS Company |
5-Year Gross Margin |
|
ASE Tech |
17.16% |
Hon Hai (OTCPK:HNHAF) |
6.22% |
|
Amkor (AMKR) |
17.60% |
Jabil (JBL) |
7.69% |
|
JCET |
12.20% |
Flextronics |
6.58% |
|
Powertech |
20.76% |
Pegatron (OTC:PGTRF) |
3.80% |
|
Tianshui Huatian |
18.01% |
New Kinpo Group |
6.30% |
|
Average |
17.15% |
Average |
6.12% |
Source: Seeking Alpha, Investing.com, Khaveen Investments
However, the company’s EMS segment is the highest growing segment with an average growth of 14.2% in the past 10 years compared to Packaging and Testing at 8.6% and 8.5% respectively. Based on the EMS market size forecast of 7.9%, this is higher than the forecasted market CAGR of the OSAT market by Yole Development of 6%.
|
Revenue Segments |
10-year Average |
Market CAGR |
|
OSAT (ATM) |
8.6% |
5.9% |
|
EMS |
14.2% |
7.9% |
Source: ASE, Fortune Business Insights, Yole Development
Therefore, despite the expected boost in margins in 2021, we expect its total margins to decline from 2022 onwards as we forecasted the EMS segment’s growth to be higher than its OSAT business. Our gross margin assumptions for each segment are based on our 2021 forecast through 2025.
|
Segment Gross Profits (TWD mln) |
2021 |
2022F |
2023F |
2024F |
2025F |
2026F |
|
ATM Revenue |
322,523 |
338,903 |
358,983 |
380,350 |
403,090 |
428,895 |
|
ATM Gross Profits |
88,672 |
93,175 |
98,696 |
104,570 |
110,823 |
117,917 |
|
ARM Gross Margins |
27.5% |
27.49% |
27.49% |
27.49% |
27.49% |
27.49% |
|
EMS Revenue |
239,488 |
258,408 |
278,822 |
300,849 |
324,616 |
370,603 |
|
EMS Gross Profits |
21,479 |
23,176 |
25,007 |
26,982 |
29,114 |
33,238 |
|
EMS Gross Margins |
8.97% |
8.97% |
8.97% |
8.97% |
8.97% |
8.97% |
|
Other Revenue |
7,986 |
8,734 |
9,551 |
10,446 |
11,423 |
12,493 |
|
Other Revenue Gross Profits |
817 |
893 |
977 |
1,068 |
1,168 |
1,277 |
|
Other Revenue Gross Margins |
10.2% |
10.2% |
10.2% |
10.2% |
10.2% |
10.2% |
|
Total Revenue |
569,997 |
606,044 |
647,356 |
691,644 |
739,129 |
811,991 |
|
Total Gross Profits |
110,968 |
117,244 |
124,679 |
132,621 |
141,104 |
152,433 |
|
Gross Margins |
19.47% |
19.35% |
19.26% |
19.17% |
19.09% |
18.77% |
Source: ASE, Khaveen Investments
ASE
Overall, we expect its margins to continue to be weighed down going forward with the superior EMS segment growth based on a market CAGR compared to the ATM segment leading to our forecast margins of 19.07% by 2026.
Risk: Partner Turning to Competition
Despite having a historically strong relationship with TSMC, the company may face greater competitive pressures from TSMC as it expands aggressively into the advanced packaging space. According to Yole Development, TSMC is estimated to spend the highest among competitors for advanced packaging capex. With a capex of $2.8 bln in 2021 for TSMC, this is 40% higher than ASE’s advanced packaging capex of $2 bln.
Yole Development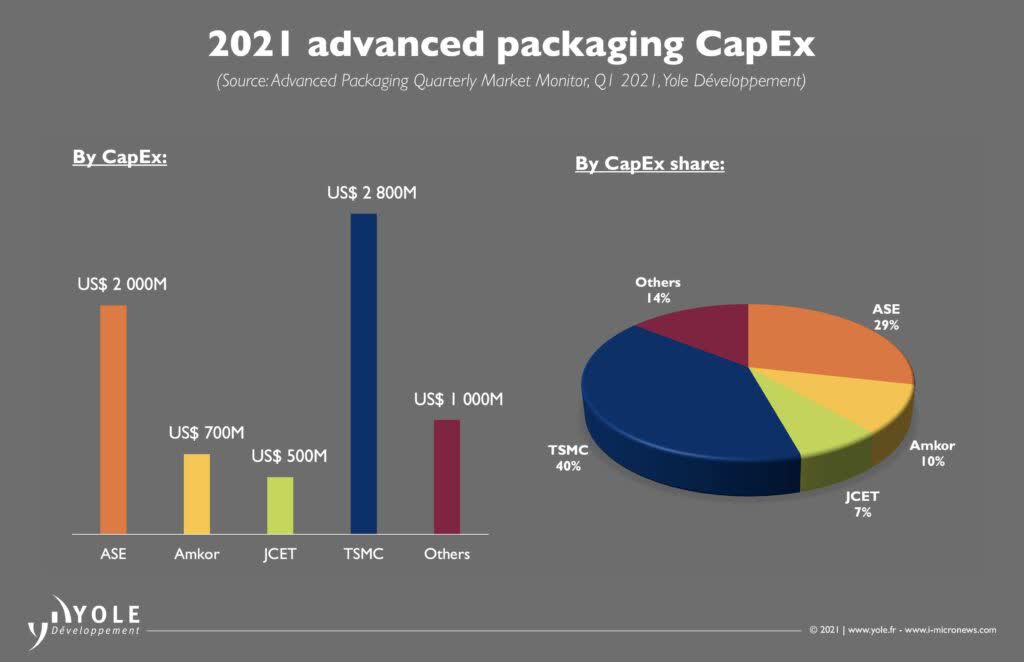
We believe that the greater estimated capex by TSMC indicates its intention to expand aggressively in the OSAT business and may threaten ASE. As mentioned in our previous analysis, we highlighted the strategic alliance between ASE and TSMC, this move by TSMC may diminish the benefit of ASE to leverage off of its relationship with TSMC for the OSAT business. Also, we view that greater competition may provide pressures to margins in the OSAT industry and may affect ASE’s margins.
Valuation
To value the company, we used a DCF as we expect it to continue generating positive free cash flows. Its average FCF margin in the past 10 years is 2.5%. In 2018, it completed the merger with SPIL which saw an increase in capex by $3.1 bln.
ASE, Khaveen Investments
For the terminal value, we based it on our derived industry average of OSAT competitors of 6.06x.
SeekingAlpha, Yahoo Finance, Khaveen Investments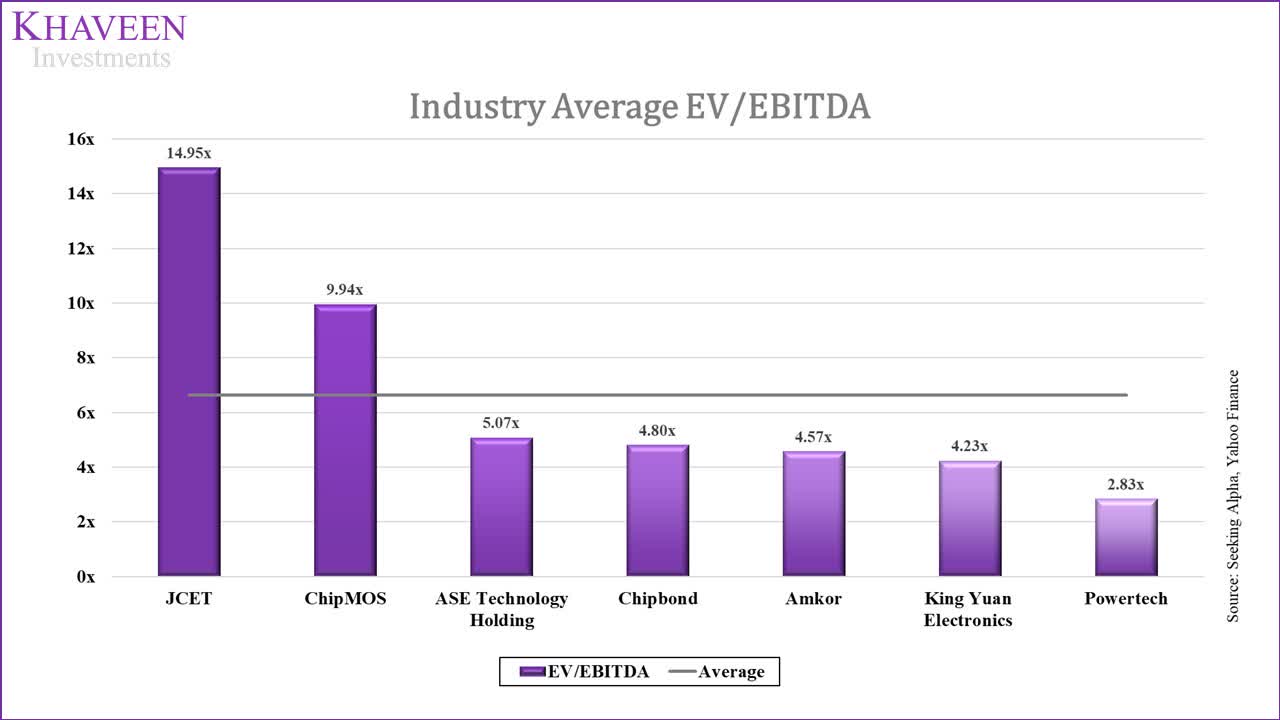
We projected the revenue based on its segments for packaging, testing, EMS and others. We highlighted our packaging revenue projections in the first point driven by advanced packaging growth. The testing segment is based on the OSAT market CAGR and EMS segment on the EMS market CAGR while the others segment on a 10-year average of 17.2%.
|
ASE Revenue Projections (TWD mln) |
2019 |
2020 |
2021 |
2022F |
2023F |
2024F |
2025F |
2026F |
|
Packaging |
198,917 |
218,666 |
272,544 |
285,925 |
302,827 |
320,824 |
339,993 |
360,416 |
|
Growth % |
11.6% |
9.9% |
24.6% |
4.9% |
5.9% |
5.9% |
6.0% |
6.0% |
|
Testing |
42,659 |
47,271 |
49,979 |
52,978 |
56,156 |
59,526 |
63,097 |
66,883 |
|
Growth % |
18.8% |
10.8% |
5.7% |
6.0% |
6.0% |
6.0% |
6.0% |
6.0% |
|
EMS |
165,790 |
204,691 |
239,488 |
258,408 |
278,822 |
300,849 |
324,616 |
350,260 |
|
Growth % |
9.2% |
23.5% |
17.0% |
7.9% |
7.9% |
7.9% |
7.9% |
7.9% |
|
Others |
5,817 |
6,351 |
7,986 |
9,362 |
10,975 |
12,867 |
15,084 |
17,683 |
|
Growth % |
16.6% |
9.2% |
25.7% |
17.2% |
17.2% |
17.2% |
17.2% |
17.2% |
|
Total |
413,182 |
476,979 |
569,997 |
606,672 |
648,780 |
694,065 |
742,790 |
795,243 |
|
Total Growth % |
11.3% |
15.4% |
19.5% |
6.4% |
6.9% |
7.0% |
7.0% |
7.1% |
Source: ASE, Fortune Business Insights, Yole Development, Khaveen Investments
Based on a discount rate of 8% (company’s WACC), our model shows its shares are undervalued by 31%.
Khaveen Investments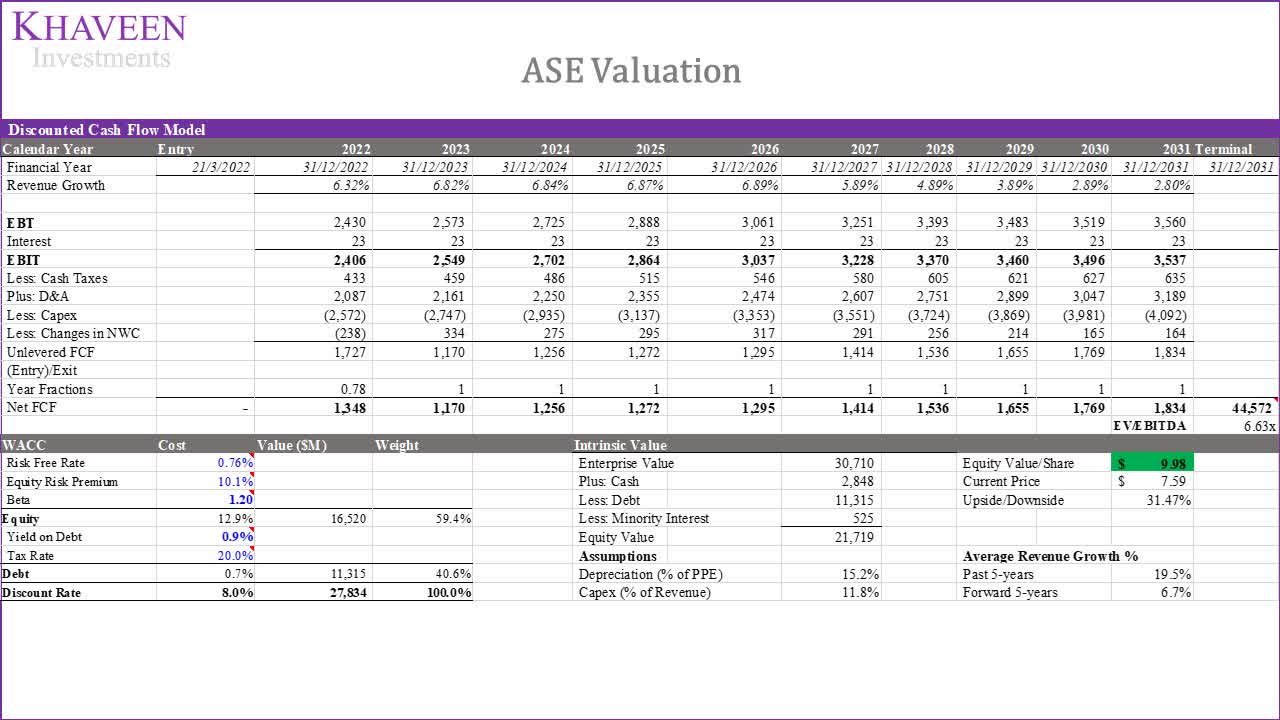
Verdict
In this analysis, we focused on the company’s OSAT business in terms of its advanced packaging segment and expansion as well as the company’s profitability. As the advanced packaging market is forecasted to grow robustly, we believe ASE’s advanced packaging business stands to benefit from the growth opportunities with better chip performance enabled by advanced packaging solutions. Moreover, we highlighted that its communications customer end market account for its largest share of OSAT revenues with growth expected to be supported by its customer relationships with smartphone chipmakers and Apple for advanced packaging solutions. However, despite a rise in its profitability in the first three quarters of 2021, we expect its future margins to remain compressed with the expected outpacing growth of the EMS segment based on market projections. Overall, we rate the company as a Strong Buy with a target price of $9.98.
Be the first to comment