

Pgiam/iStock via Getty Images
Investment Theme
The most important portfolio objective for most investors is wealth-building, due to risks of unexpected financial emergencies, planned major expenses, and too-willingly deferred retirement preparations. Life-longevity expansions from bioscience technology advances compound the latter financial inadequacies for many individual investors.
Biotechnology under continuing covid persistence is drawn to worldwide immunology concerns, which may create temporary pricing for established developers working on opportunities out of the immediate mainstream. The tradeoff of Risk and Reward constantly seeks balances, with disadvantage to the less-well informed or less-willing to act more intelligently (for whatever reason).
Today’s survey of over 4,000 equities finds hundreds of stocks exercising the Market-Maker [MM] capital liquidity capabilities, some of which, like Ascendis Pharma A/S (ASND) reveal strong, previously reliable indications of near-term coming capital gain.
Company description
“Ascendis Pharma A/S, a biopharmaceutical company, focuses on developing therapeutics for unmet medical needs. The company offers SKYTROFA for treating patients with growth hormone deficiency (GHD). It also develops TransCon Growth Hormone (HGH) for pediatric GHD in Japan; TransCon hGH for adults with GHD; TransCon parathyroid hormone for adult hypoparathyroidism; and TransCon CNP for pediatric achondroplasia. In addition, the company develops TransCon toll like receptors 7/8 agonist for intratumoral delivery; and TransCon IL-2 ß/g for systemic delivery. The company was incorporated in 2006 and is headquartered in Hellerup, Denmark.”
Source: Yahoo Finance
Yahoo Finance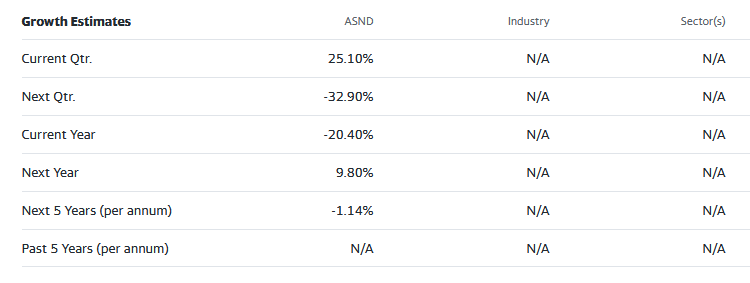
The big picture: Risks vs. Rewards
We grouped ASND with other similar clinical-stage biotechnology companies frequently compared by individual investors. Forecasts implied by hedging actions of MMs facilitating volume block trades ordered by big-$ funds provide likely coming-price prospects for comparison. Actual market outcomes for these stocks following prior forecasts with today’s upside-to-downside forecast proportions add perspective to the evaluations.
Figure 2
blockdesk.com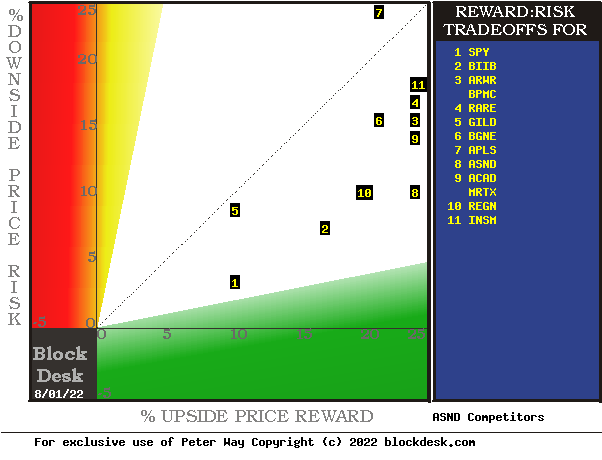
(used with permission)
The tradeoffs here are between near-term upside price gains (green horizontal scale) seen worth protecting against by market makers with short positions in each of the stocks, and the prior actual price drawdowns experienced during holdings of those stocks (red vertical scale). Both scales are of percent change from zero to 25%.
The intersections of those coordinates by the numbered positions are identified by the stock symbols in the blue field to the right. Market-index trade-off norm of S&P500 Index ETF (SPY) is at location 1]. Our principal interest is in ASND at [8].
The dotted diagonal line marks the points of equal upside price change forecasts derived from Market-Maker [MM] hedging actions, and from the actual worst-case price drawdowns from positions that could have been taken following prior MM forecasts like today’s.
This map is a good starting point, but it can only cover some of the investment characteristics that often should influence an investor’s choice of where to put his/her capital to work. The table in Figure 3 covers the above considerations and several others.
Principal questions for all alternatives are “how likely are these outcomes to happen,” and “can their impact be improved?”
Figure 3 presents the MMs’ price range forecasts [B] to [C] for the alternative investment candidates in Figure 1, along with the outcomes [ I ] from their prior past 5 years of daily forecasts with the same proportions [G] of today’s up-to-down Range Index prospects.
Figure 3
blockdesk.com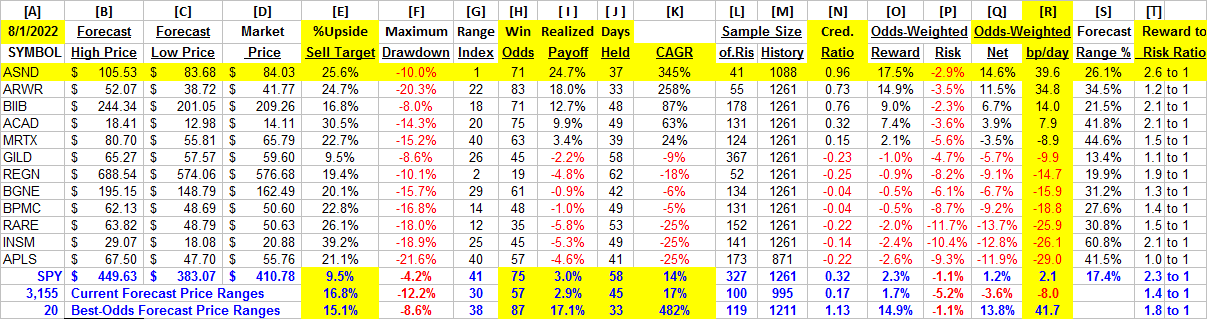
used with permission
Contributing to that comparison are the demonstrated odds of a profit-successful forecast in column [H], its complement of 100 – H, or loss frequency, size of net gain attained [I] and size of worst loss [F] experienced in prior holding periods, so that, when weighted appropriately in [O] and [P], they produce the Net of [Q]. Respecting the power of compounding, [Q] converted into basis points per day [J] of capital commitment at [R] presents a highly comparable figure of merit (fom) for investing preferences where the dominant objective is to build easily liquidated capital to meet emergency, retirement or other planned needs.
By its use as a ranking, the figure of merit (fom) [R] for each row provides an additional measure of attraction, emphasizing the capital gain potential for ASND. Since the [H] odds on wins vs. losses and the [J] holding periods impact [R], the size of samples from which past outcomes are drawn need careful scrutiny but are comparable for all types of equity investments.
Note also please the comparison of these stocks with the S&P500 index-tracking ETF (SPY) and with the 3155 securities average for which we here compile forecast population specifics. From that population we use the dimensions illustrated in Figure 3 to rank the most promising and historically evidenced few stocks at present, each based on prior MM forecasts with upside-to-downside balances like today’s.
Recent Trends in ASND Forecasts by Market-Makers
Recent strength in ASND stock price apparently has attracted attention among some institutional investment organizations. In the last two days their buy orders have supported increased expectations of coming prices.
The current upside target of $331 offers a prospective gain of +20%, but its current price of $279 is at the low of market professionals’ expectations of from $276 to $331.
Figure 4
blockdesk.com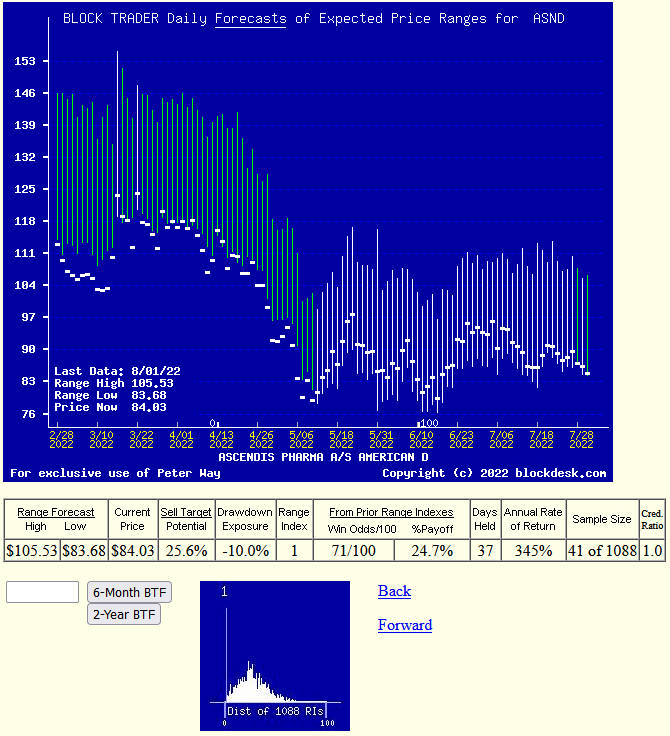
(used with permission)
The small “thumbnail” picture at the bottom of Figure 3 shows the frequency of the past 5 years of ASND daily Range Indexes [RI]. At its present level of 1, the bottom of the forecast range, all subsequent RIs, and their prices, clearly have been higher. In the past there have been 41 out of the 1088 daily forecasts with RIs of 1.
Of the 41, 71% have either reached their top-of-range forecasts or close enough so that the achieved payoff including losses reduced prior gains to 24.7%, only slightly below the current upside expectations of 25.6%. In 37 market days (7+ weeks) of capital commitment to the venture it has achieved a 345% a year CAGR reward rate. No guarantees, just good odds for a big payoff rate by being an active investor.
Conclusion
Comparison of Ascendis Pharma A/S with its industry competitors makes it a good choice for most likely desirable industry near-term capital gain vehicle at this point in time.
Investing, like the rest of life, is laden with trade-offs. Each investor has preferences and personally-set standards of acceptability. Each investment security candidate for the portfolio has its line-up of advantages and disadvantages to be presented to the investment committee. With a committee of one, the decisions may come more easily than when there are other minds to convince.
But it is important to have the go-nogo decision criteria clearly in mind to apply fairly to each of the available investment candidates. And their attributes need to be stated in terms that are directly comparable to other employable candidates.
We hope to offer selection criteria which aid the investor in framing their investment selection decision parameters fairly and consistently. We believe that the simple TERMD active investment portfolio management discipline works well in the holding period involvement that our information capture process provides.
Be the first to comment