

scyther5
The macro market and economic backdrop continue to pivot favorably for the gold mining sector
The risk/reward for gold stocks has been very good after 2.5 years of correction that, contrary to what a majority of gold bugs think, was very valid amid the post-pandemic cycle of cyclical inflation. I won’t review the details about why here, as it is beyond the scope of this article and I’ve parroted them in several blog posts at nftrh.com. But suffice it to say, the gold stock sector did the work it was supposed to do since August, 2020.
In a previous post, we noted the risk/reward of gold (mining product) vs. crude oil (mining cost driver) that is at once very bearish for gold stocks and implying a great risk/reward proposition for gold, and by extension, the gold mining sector. Here is a chart showing the Gold/Oil ratio in a very depressed (bearish) state with nowhere left to go but up. That’s the positive risk/reward that has been hammered out since the high risk days of mid-2020 as the “inflation trades” were just getting underway.
Gold/Oil ratio (stockcharts.com)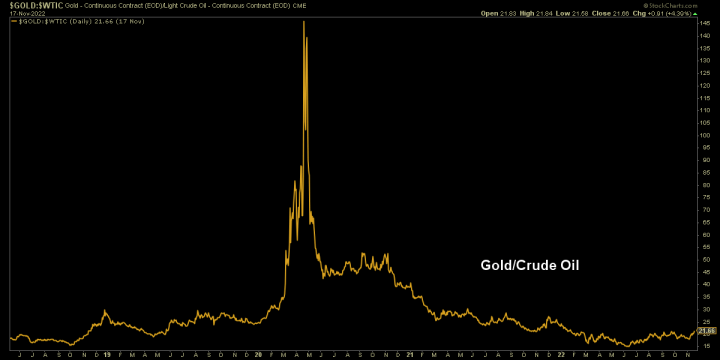
Here is a chart we have used periodically in NFTRH to guide us with respect to risk/reward for the gold miners from the perspective of the mining product vs. a mining cost driver. The chart’s history speaks for itself, but what it is saying today is that risk to a positive gold mining view is in-line from this perspective.
Gold/Oil w/ HUI (stockcharts.com)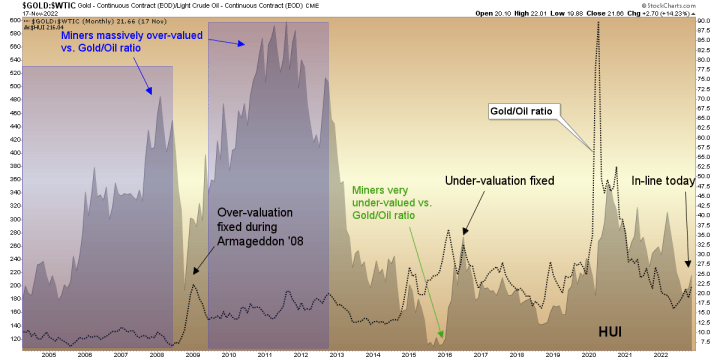
Here is the macro chart of the gold price as adjusted by stocks, commodities and an “inflation expectations” gauge. This is as of Thursday’s market close. As of Friday morning, gold is rising again vs. oil, commodities in general and inflation expectations while easing a bit vs. stocks and continuing its long consolidation vs. the cyclical industrial metals complex.
Gold ratios (stockcharts.com)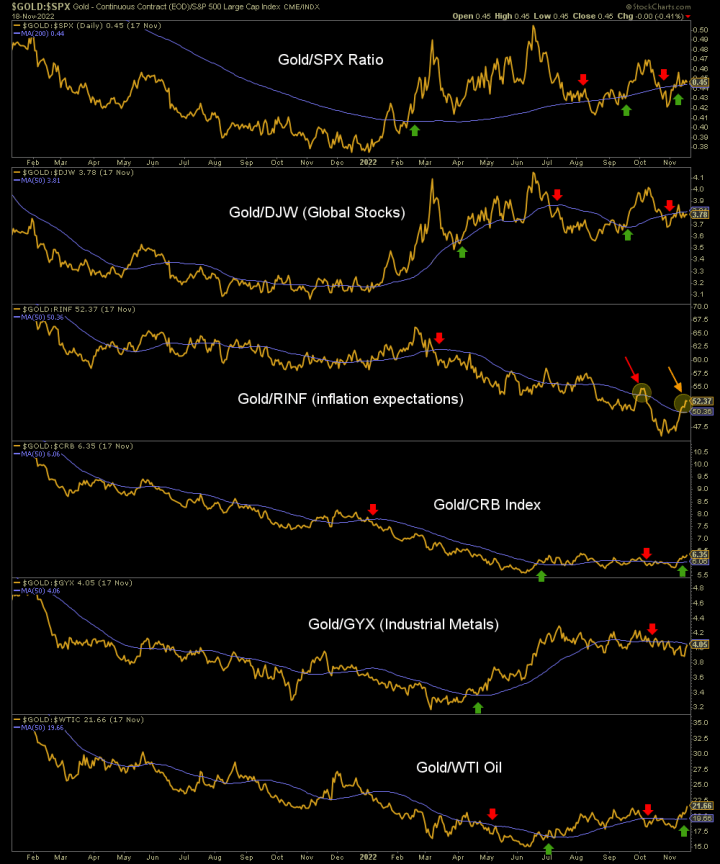
As we’ve been noting for months now, an oncoming pivotal phase has been a process, not an event. On the chart above, while recently weak in relation to stocks and industrial metals, gold in relation to those items is consolidating a rise from what was likely the lows early in the year. Conversely, gold in relation to commodities (including oil) may be bottoming. Follow-through is needed.
As for inflation expectations, gold has made a second hard bounce in relation, as inflation signals continue to moderate (toward what may be an uncomfortably low level and potential deflation scare by mid/late 2023 if/as the bust side of the Fed induced boom/bust cycle manifests). Again, follow through is needed.
Other items like the 10-2yr yield curve and “real” yields on long-term Treasury bonds are gold bearish… to an extreme! And that extreme, much like the Gold/Oil ratio above, implies positive risk/reward, if not yet fully activated macro fundamentals, for the gold mining sector.
Meanwhile, as we manage the shorter-term technical situation each week for HUI and individual gold (and silver) miners in NFTRH, the slow, steady and oh-so-volatile big picture monthly chart of the HUI Gold Bugs index lumbers along, advising that the bottom may well be in or, if not, the higher lows of 142.51 and 131.12 that should be maintained in order to keep this volatile bull going.
First things first, however. HUI has held a valid support level at 175 amid its low macro risk situation. It did this with the type of oversold monthly RSI reading that halted the last major consolidation/correction in 2018.
HUI monthly, linear scale (stockcharts.com)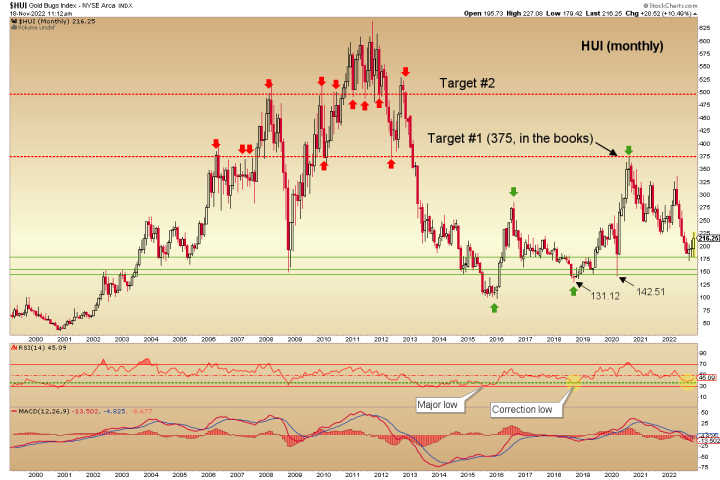
I had a request earlier in the week for a log scale version of the above, and as reviewed in an NFTRH subscriber update, a 22-year-old trend line by this log view is intact. I do not put undo faith in trend lines, but it is a minor positive to the view that gold stocks may have already bottomed per the support level above.
HUI monthly, log scale (stockcharts.com)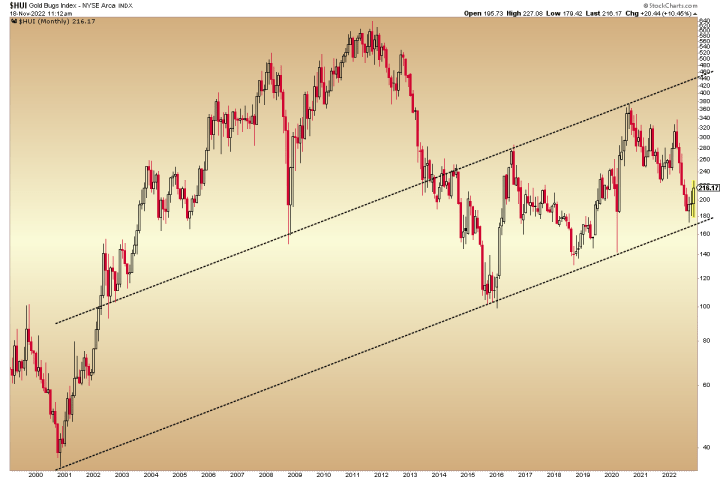
Bottom Line
We want to marry the positive risk/reward and slowly improving macro fundamentals with intact big picture technicals like the above, and short-term technicals as managed each week in NFTRH reports and updates. The process is ongoing, and at this time we can throw in a seasonal bottom in December (on average, but it is prudent to widen it to October-January, which has been our Q4-Q1 window), given another year of losses for gold stock holders duped in by inflation touts over the last couple of years, tax loss selling/buying season.
When gold definitively assumes leadership to cyclical stocks and commodities (which were boosted by the Fed’s inflationary operations of 2020) amid draining market liquidity, the fundamentals will be in place for the counter-cyclical gold mining sector to leverage gold’s standing within the macro. If you participate, prepare to pick quality operations* that stand to benefit, fundamentally.
* There are a lot of poorly run mining operations and the junior/exploration patch is populated by a good percentage of scams. This combined with geographical/political hazards mean that discretion is always warranted.
Be the first to comment