

Pink_frog/iStock via Getty Images
Introduction
Back on December 9, 2021 I wrote a Seeking Alpha article entitled “ARKK Vs. QQQ: Which ETF Is The Better Pick For Long-Term Investors?“
In the three months since that article came out, the U.S. inflation rate has moved to 7.9%, gasoline prices average $4.23 for regular, and Russia has invaded Ukraine. These are remarkable macroeconomic and geopolitical forces. This article takes a deep dive into the current impact of these forces on these two ETFs and the impact if these forces continue for an appreciable time.
The annual inflation rate in the U.S. accelerated to 7.9% in February of 2022, the highest since January of 1982. In February 2021, the U.S. inflation rate was 2.6%, as shown in Chart 1. Inflation rate jumped from 2.6% in February to 4.2% in March 2021 and then leveled for the next four months before jumping again from 5.4% in September to 6.2% in October before increasing steadily to 7.9% in February 2022.
TradingEconomics.com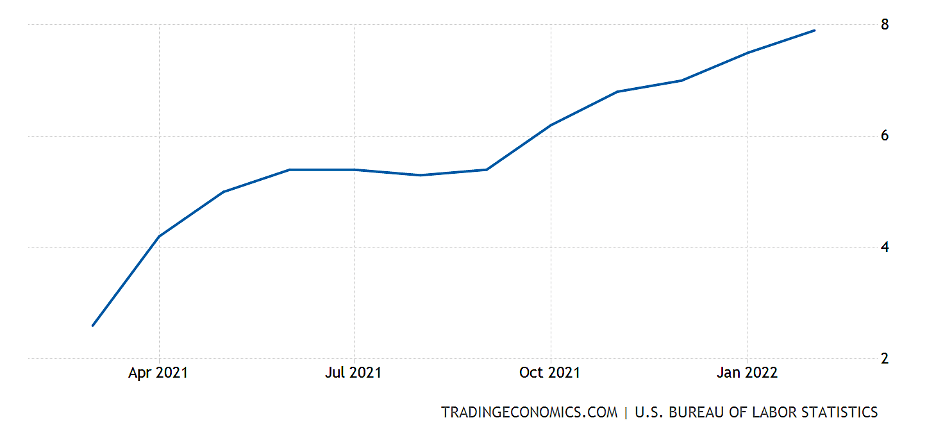
Chart 1
Chart 2 shows a relationship between inflation and (NYSEARCA:ARKK) and (NASDAQ:QQQ) stock performance over the 1-year period. Over this period, ARKK’s stock decreased 45.7% while QQQ increased 12.5%.
YCharts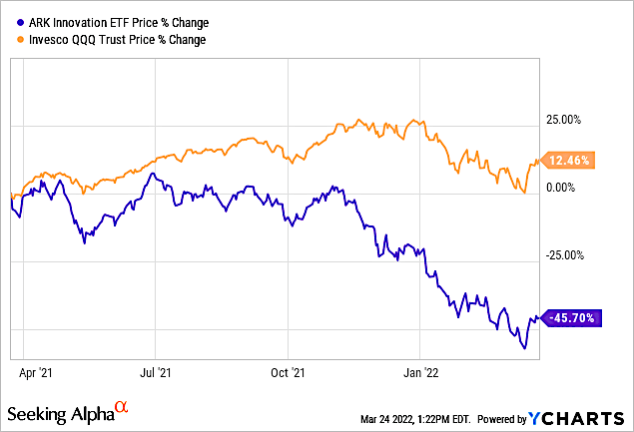
Chart 2
Between September 2021 and February 2022, inflation increased 46.3%. Chart 3 shows that ARKK‘s stock performance in the past 6-month period dropped 44.7% to March 24, 2022. QQQ stock performance decreased just 4.3%.
The decrease in ARKK stock and the increase in inflation are nearly identical. So here we see a significantly greater correlation between inflation and ARKK than with QQQ.
YCharts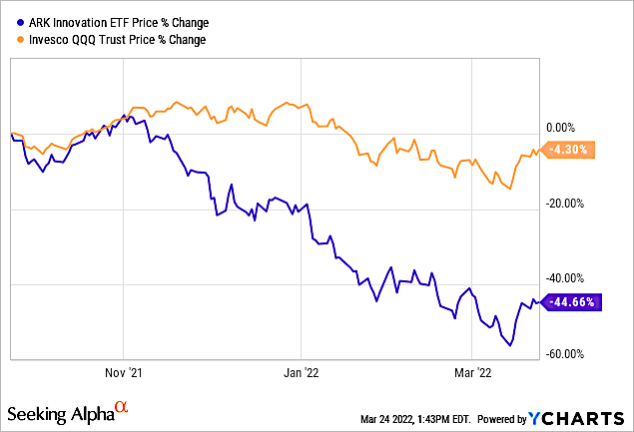
Chart 3
Comparing ARKK & QQQ
A comprehensive analysis of these two ETFs is shown in Table 1. One of the key differentiators is Assets Under Management (“AUM”), which represents the total of all investor dollars invested in all share classes of the fund. Investors generally consider higher investment inflows and higher AUM comparisons as a positive indicator of quality and management experience. That would make the ARKK ETF a strong choice with an AUM of $12.70 billion compared to just $189.34 billion for QQQ.
Assets under management dropped from $17.46 billion on December 9, 2021, to $12.70 billion currently, a drop of 27.3%.
QQQ’s AUM decreased from $210.55 billion on December 9, 2021, to $189.34 billion currently, a drop of just 10.1%.
ARK, Invesco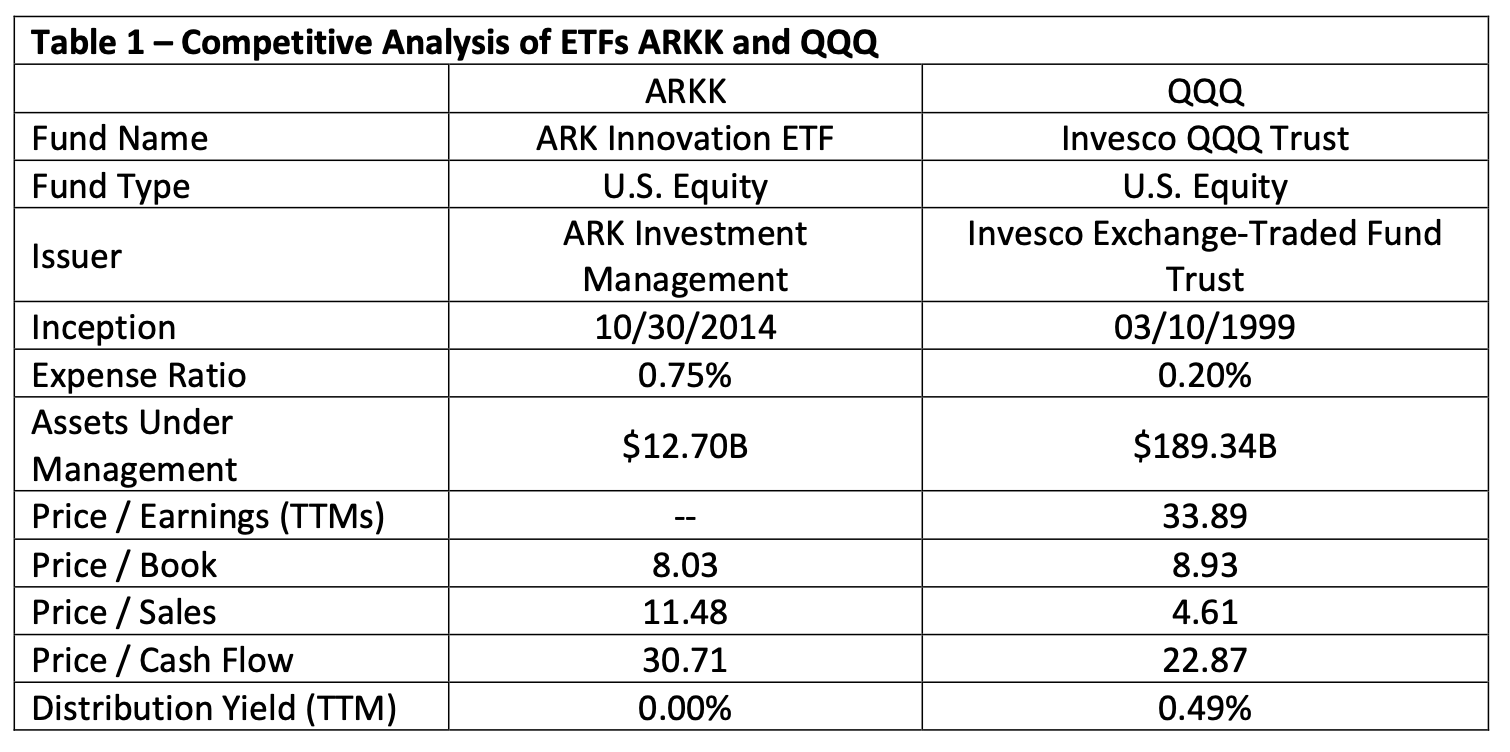
Analyzing ARK Top Holdings
Table 2 is the current (3/24/22) Top 10 holdings for ARKK, showing 3-month stock performance (since my previous article of 12/3/21) and Quant Ranking based on industry.
ARK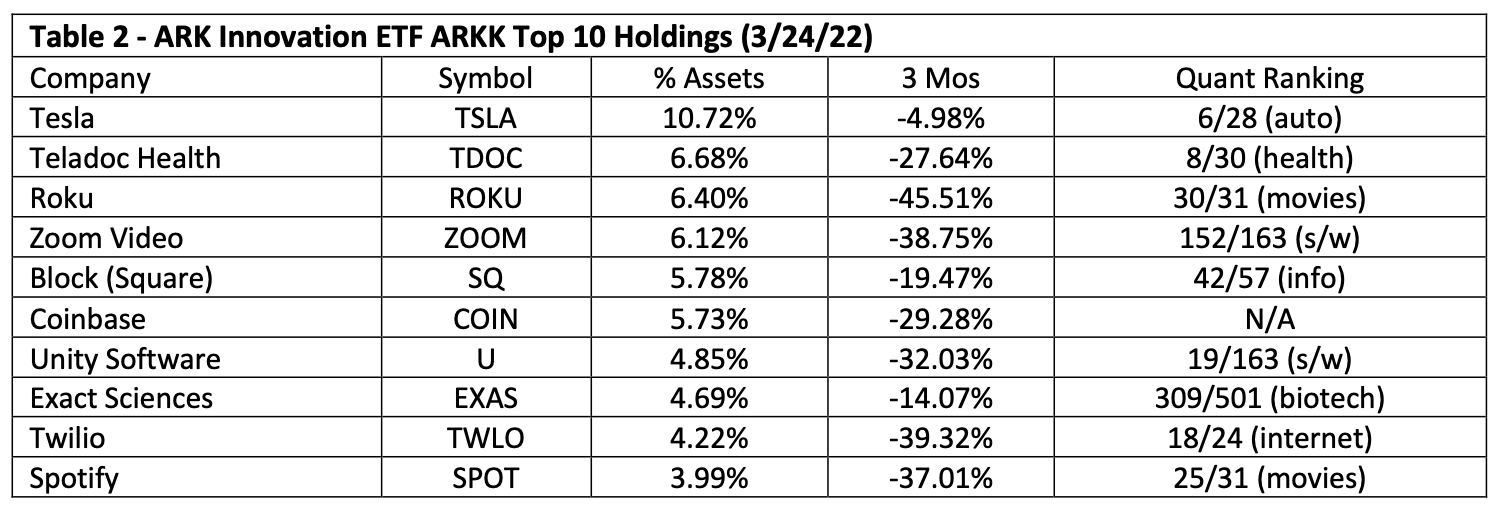
According to data in Table 2 for the past 3-month period with my previous 12/3/21 data for ARKK’s Top 10 companies as detailed in my above referenced Seeking Alpha ARKK vs QQQ article, there are several important issues that are important to the discussion:
- All 10 of the companies on 3/24/22 in the Top 10 were in the Top 10 on 12/3/21.
- Tesla (TSLA) was the only company that had positive stock growth for the previous 1-year period on 12/3/21, only while on 2/24/22 there were zero companies with positive stock growth with Tesla performing best.
- Tesla was the best performing stock on 12/3/21, and its % of Assets understandably increased from 9.98% to 10.72% on 3/24/22.
- Roku (ROKU) was the worst performing stock on 2/24/22, yet its % of Assets surprisingly increased from 5.37% on 12/3/21 to 6.40%.
- Spotify (SPOT) was the only company where its % of assets decreased.
- Teladoc Health (TDOC) and Unity Software (U) were the only two companies where their Quant Rankings had increased.
- TSLA had the highest Quant Ranking but nearly all the rest of the companies were below the 50 percentile.
Chart 4 show stock performance of ARKK versus TSLA on a Price % Change basis for a 5-year period. TSLA stock grew 1,890% compared to 188.3% for ARKK. Thus, ARKK was buoyed by TSLA and continues to do so.
YCharts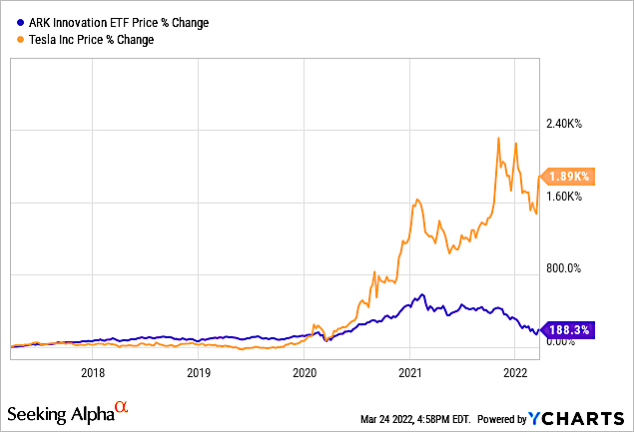
Chart 4
Analyzing QQQ Top Holdings
Table 3 is the current (3/24/22) Top 10 holdings for ARKK, showing 3-month stock performance (since my previous article of 12/3/21) and Quant Ranking based on industry.
Two companies were added to the Top 10 in the past three months – Costco (COST) and Broadcom (AVGO). They replaced PayPal (PYPL) and Adobe (ADBE).
Invesco
Investor Takeaway
Table 4 shows that ARKK stock had a -24.0% growth in 2021 and a -34.4% growth in the past 3-month period.
It also shows that if we include only the Top 10 holdings, ARKK had a -18.8% growth for 2021 and a -28.8% growth for the past 3-month period. This “better” growth for the Top 10 holding is solely attributed to TSLA, as discussed above in Chart 4.
Table 4 also show the average 3-month stock performance for the Top 10 QQQ companies was -7.12% compared to +46.60% for the Top 10 companies in 2021. For the Total QQQ ETF, stock performance was 26.8% for 2021 and -10.1% for the past 3-month period.
This indicates that the ETF manager has been able to maximize performance by choosing the best among holdings for its Top 10 list.
ARK, Invesco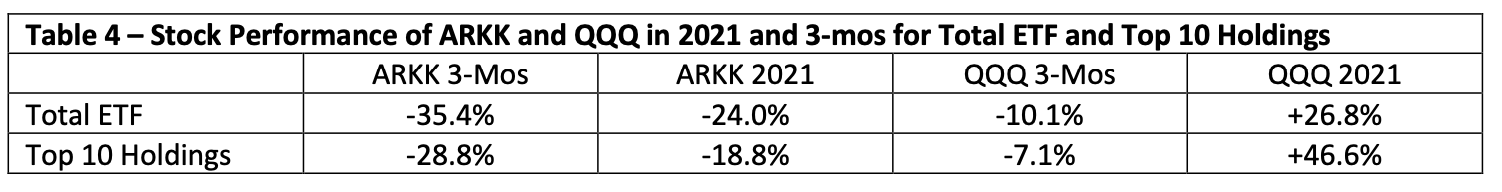
I have shown previously in Chart 3 that ARKK stock performance was tied to the inflation rate in the U.S. Chart 5 shows the 10-year Treasury Rate % Change plotted with ARKK and QQQ Price % Change for the 1-year period.
The 10-year treasury rate has been increasing on inflation fears. The 10-year Treasury yield on March 22, 2024, climbed to its highest level since May 2019, a day after Federal Reserve Chairman Jerome Powell’s hawkish interest rate remarks. Chart 5 shows a strong inverse correlation with ARKK and the 10-year.
YCharts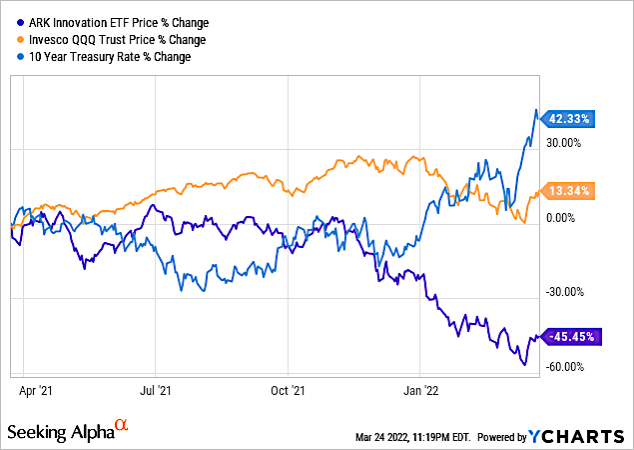
Chart 5
Kiplinger expects that the surge in gasoline prices will boost March inflation to near 10% when the figures are released next month. The inflation rate will likely remain high for the rest of the year, ending at 6.5% or so in December.
With the correlation with ARKK, what the U.S. Federal Reserve does in 2022 will impact the 10-Year Treasury, which could impact ARKK performance in 2022.
Chart 6 shows the Seeking Alpha ETF Grades for ARKK and QQQ. Clearly QQQ is the better ETF.
Seeking Alpha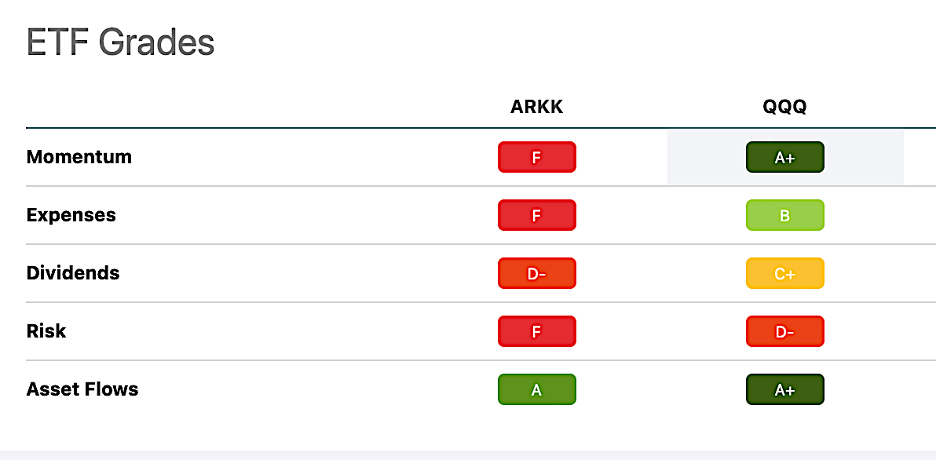
Chart 6
Be the first to comment