

asbe
Cathie Wood’s ARK Innovation ETF (NYSEARCA:ARKK) is an ETF that I have owned before. I sold my position months ago and now I am wondering if it is a good time to start a position. In this article, I will examine some charts to see if now is a good time to invest in ARKK.
Chart 1 – ARKK Monthly
www.stockcharts.com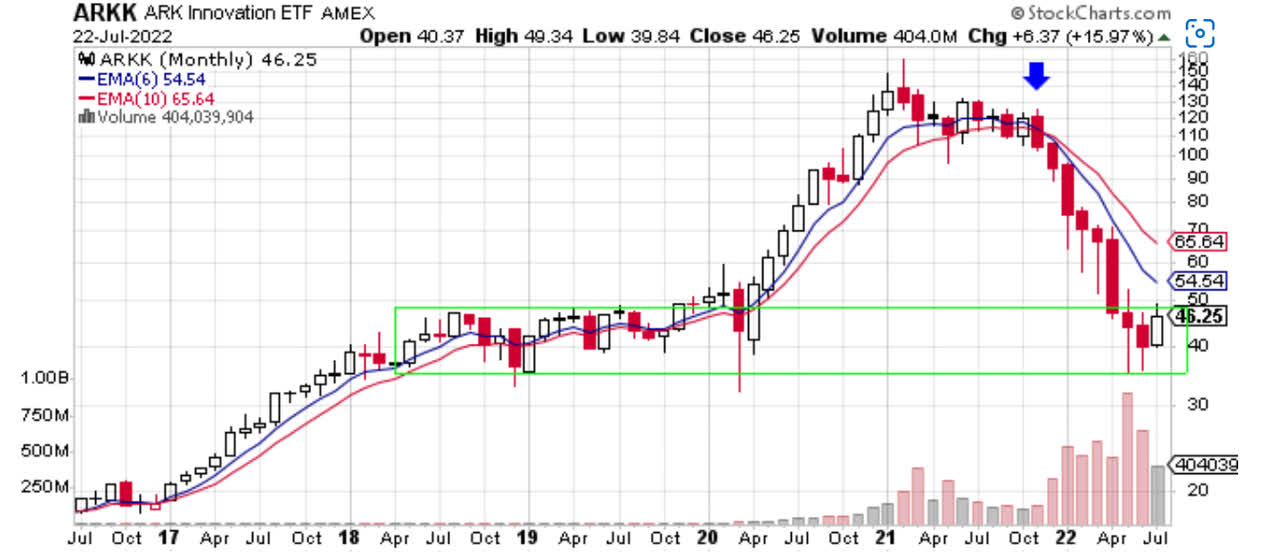
If we look at the big picture first, we can see on the monthly chart how ARKK has sold off from a high of $160 back in February 2021 to its current price. ARKK has lost just over 70% in the past 18 months. The blue arrow on Chart 1 shows the month where the six-month moving average closed below the 10-month moving average. That was an excellent time to sell ARKK. ARKK then closed lower for eight consecutive months. Readers of my other articles know that I put a great deal of value on the long term 10-month moving average. When the stock is above that moving average, I consider the stock bullish. When the stock is below its 10-month moving average, I consider that a bearish indication. Right now, ARKK is well below both the six month and the 10-month moving average. What intrigues me is that ARKK is back to a level where it has based before. Basing occurs before a stock advances. The basing period is when smart money is establishing their positions in the security. Basing also allows the moving averages to decline closer to the price of the stock, and then the moving averages can flatten out before they too start to trend higher. The green box on the chart shows a level where ARKK has spent a great deal of time in the past before it ascended to $160. Could ARKK be in the beginning phase of building another base before it ascends?
Chart 2 – ARKK Weekly and Relative Strength
www.stockcharts.com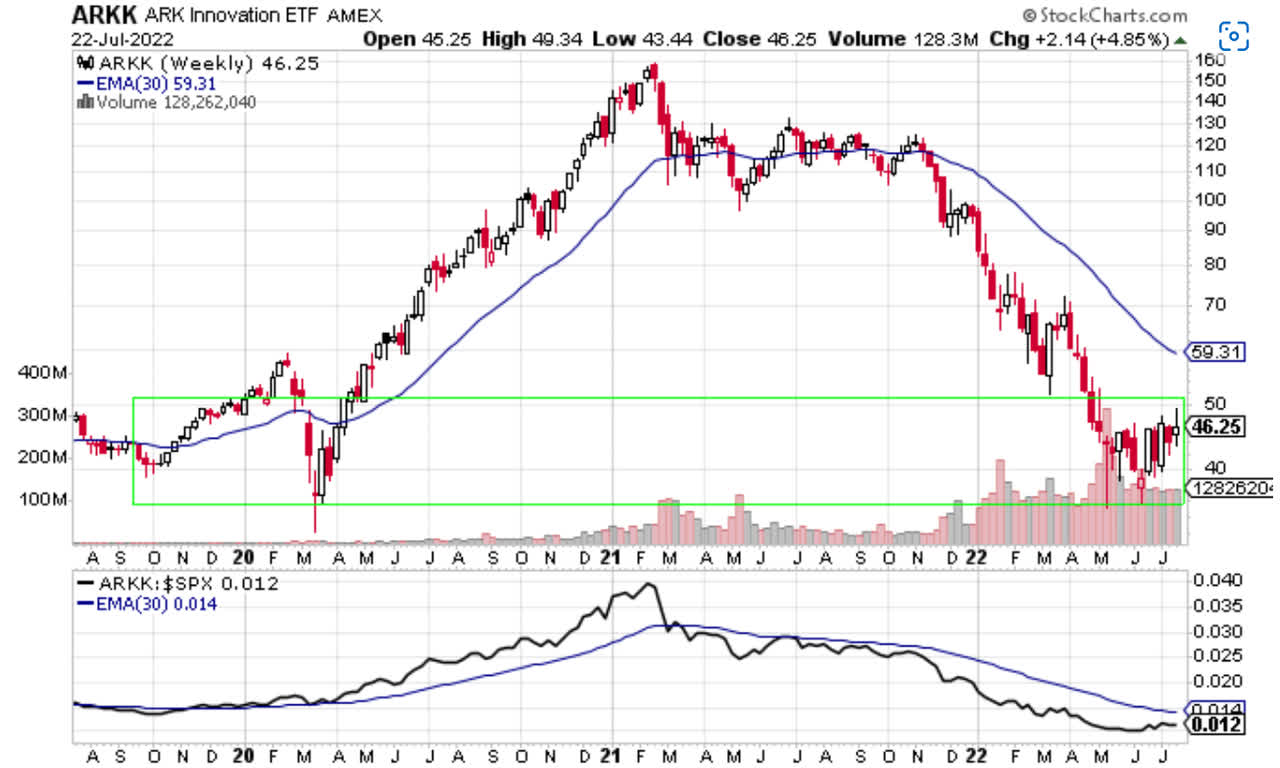
Chart 2 shows ARKK coupled with its 30-week moving average. The same principles apply. When price is above the 30-week moving average, that is bullish. When price is below the moving average, that is bearish. It is easy to see the consolidation taking place as ARKK has held steady around $45 for the past 11 weeks. This was the area that ARKK consolidated at during the COVID low of March 2020. Again, this basing or consolidation phase will allow the 30-week moving average to decline closer to the stock price. Then the 30-week moving average can flatten out and then move higher after price closes above the moving average.
The lower panel of Chart 2 shows the relative strength ratio of ARKK compared to the S&P 500 index. When the black line is rising, that shows that ARKK is outperforming the S&P 500 index. When the black line is falling, that means that ARKK is underperforming the S&P 500 index. After a long period of underperformance, ARKK looks to be doing better against the S&P 500 index. The black line is flattening out or basing. Since May 2022, ARKK has held up well compared with the major index. I consider that a good sign. What I want to see in this chart is the relative strength ratio above the blue 30-week moving average. That would be a good indication that ARKK could be expected to outperform the S&P 500 index for a duration of time. See the period after the COVID low to February 2021.
Chart 3 – ARKK Daily
www.stockcharts.com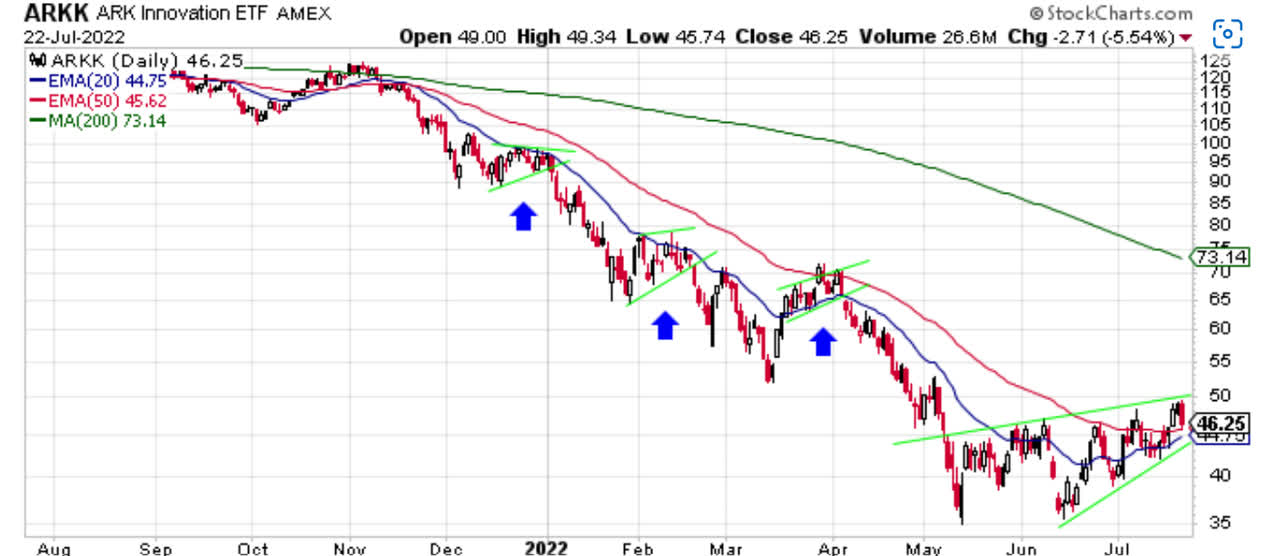
Chart 3 above shows the daily price action of ARKK compared with its 20 day, 50 day, and 200 day moving averages. You can see that ARKK closed below the three moving averages in November 2021 and didn’t look back. ARKK has declined till it reached its recent low back in May at $35. Since then, ARKK has rallied over 30%. There are some bullish developments on the daily chart. ARKK put in a bottom in May at $35 and has made a series of higher highs and higher lows. That is the textbook definition of an uptrend. ARKK closed Friday above both its 20-day and 50-day moving averages. You can see from the chart that that hasn’t occurred much since ARKK’s decline began in November 2021. Another bullish development is that the 20-day moving average is sloping higher. All of these are bullish developments for ARKK.
On the bearish side of the coin, ARKK is still well below its 200-day moving average, which is the declining green line at $73. There is zero indication that the 200-day moving average is flattening out, never mind trending higher. All the daily moving averages are still in bearish alignment. In this case it means that the fastest or shortest term moving average, the 20 day, is below the 50-day moving average, which is below the 200-day moving average. In a long term upward trending market, these would be reversed. The 20 day would be above the 50-day, which would be above the 200-day moving averages. Also, all three moving averages would be sloping or trending higher. We don’t have that condition now. The last bearish development I see is a bearish chart pattern known as a rising wedge. That is outlined by the two green trendlines on the chart. This price pattern often precedes a move downward in price. Three other examples are shown on this chart with the blue arrows.
Once this bear market ends, I want to have a position in ARKK as I believe it will outperform the S&P 500 in the next leg up. What I need to see in ARKK is a few things. First, I need to see ARKK continue to build its base. I do expect ARKK to break lower from here because of the rising wedge. Keep in mind that ARKK could break lower but still not decline below the low of $35 which it set in May. In other words, the low for ARKK in this bear market could already be in place. If ARKK gets back to $40 a share, that could be a good place to initiate a position. Second, I need to see the 20-day moving average get above the 50-day moving average. Third, looking at the weekly chart, I want to see the 30-week moving average flatten out and price get above the 30-week moving average. That would be another good place to add to a position in ARKK or to initiate a position in ARKK. The last sign would be on the monthly chart. When price moves above the 10-month moving average, you can go all in so to speak.
In summary, I use price action to determine when I should buy or sell a stock or an ETF. Over the years I have learned the value of scaling in and out of positions as opposed to being all in or all out at one time. It’s possible that the S&P 500 has already bottomed, and therefore, I want to begin building positions in leading equities for the next leg of the rally. It’s also possible that I am wrong on the bottom being in place. With that in mind, I like to scale into a position at this time, as opposed to going all in at this time. I would look to buy some ARKK at $40 and then monitor the position. If ARKK continues to move lower and go below $35 then I would sell some ARKK as my analysis may be incorrect. However, if ARKK can hold the May low at $35 and continue to base, I would look to add to my position as ARKK moves higher and closes above the 30-week moving average. Then I would be all in when price closes above its 10-month moving average. That is how I am looking to trade ARKK moving forward.
Be the first to comment