

cemagraphics
Yellen on Treasury market illiquidity
It’s interesting that Janet Yellen raised the specter of buying Treasuries this past week, without it being QE. The comments seemed to be born of some illiquidity issues within the Treasury market. This was somewhat reminiscent of 1998 and the Long Term Capital (LTCM) crisis and Greenspan being forced to reduce the Fed funds rate in early October 1998, as cracks were starting to appear between credit spreads and the Treasury relationship. It’s been a while since I read the book on that mess, stemming from John Meriwether and the LTCM debacle where Wall Street was shooting openly at the Long Term Capital Management positions. The UK gilt market and the Liz Truss fiscal policies are also adding to the mix on a global scale. 1994, similar to 2022 in that the AGG and the US Treasury market had its worst year ever, also saw an international incident – the peso devaluation – that started the “great unwind” in terms of the Treasury bear market. Orange County, California declaring bankruptcy was another blow, but it was mainly headlines. Orange County filed for bankruptcy based on a bad interest rate bet. If memory serves correctly, one of the OC operating funds was long zero-coupon Treasuries. I wonder what that same trade would look like today. (A little sidebar on LTCM and Greenspan: it was Wall Street that had to bail out the banks in the early 1990s after the commercial real estate crisis, but with LTCM – as the story goes – Greenspan had to ask the banks to bail out Wall Street. )
From late July ’98 through the low in early October ’98, the Nasdaq corrected 35%… Fun times. I still remember David Faber breaking the story on CNBC…
Midterm election years
Ryan Detrick, now with Carson Group out of Omaha, after leaving LPL Financial, has done yeoman’s work on the pattern of midterm elections and S&P 500 returns. 1994 was a midterm election year (bond bear market), as was 1998 (LTCM talked about above). 2022 is a midterm election year. It’s been grim YTD with the S&P 500 down -23.83% while the AGG is down -15.69%, for a 60% / 40% balanced portfolio YTD return of -20.57%.
S&P 500 Performance Before And After Midterm Elections (@GameofTrades)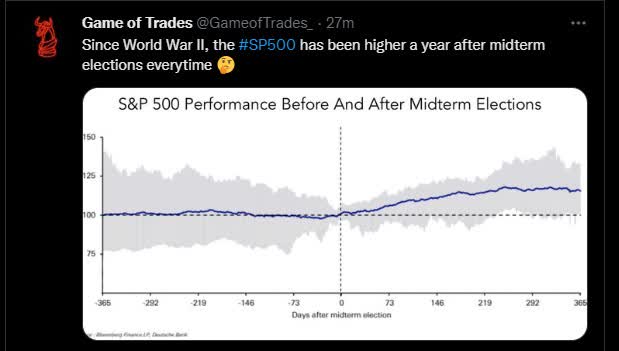
Here’s a chart from @GameofTrades, who notes that the S&P 500 – since WW II – has been higher one year later in every instance.
The chart was sent to clients, with this caveat: the midterm election is on November 8, 2022, thus the S&P 500 could fall considerably before then, leaving an easy compare for 2023, or the S&P 500 could remain punk until mid-2023 or some intermediate point therein and the rally through 11/8/23 to keep the streak alive. The point is, it (the history) says nothing about timing.
However, it’s a strong pattern.
Energy: Reaching a critical level
Great chart by JC Parets on Energy reaching its previous highs from 2014. The sector is at a critical level.
Energy Sector (XLE, XOM) Reaches Previous Highs From 2014 (All Star Charts)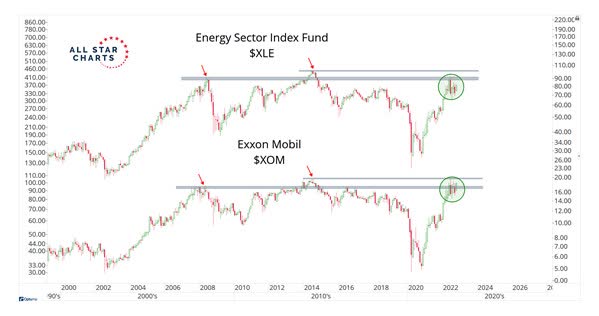
S&P 500 Earnings Yield vs. the risk-free-rate
Posted the S&P 500 earnings update on this blog Saturday and noted that the S&P 500 earnings yield (EY) was at the highest level since 2019. Then, reading Bespoke Sunday morning, Paul Hickey brought up a good point about risk-free rates being between 3% and 4%, which somewhat nullifies the earnings yield.
The thing about the earnings yield calculation is that the forward 4-quarter estimate (FFQE) for the S&P 500 could fall markedly, and thus the yield doesn’t look so hot.
Statistically though, the S&P 500 earnings yield at 6.50% is the highest in 4 years. The EY struck 7% during Christmas week 2018 in the midst of the last Powell monetary policy tightening. The EY might have hit a higher level around the Covid drop in late March 2020, but it didn’t last long, since earnings estimates were already being cut sharply.
Megacap names: This is where the earnings risk resides for the S&P 500 (in my opinion):
Mega Cap Trends (Bespoke Investment Group)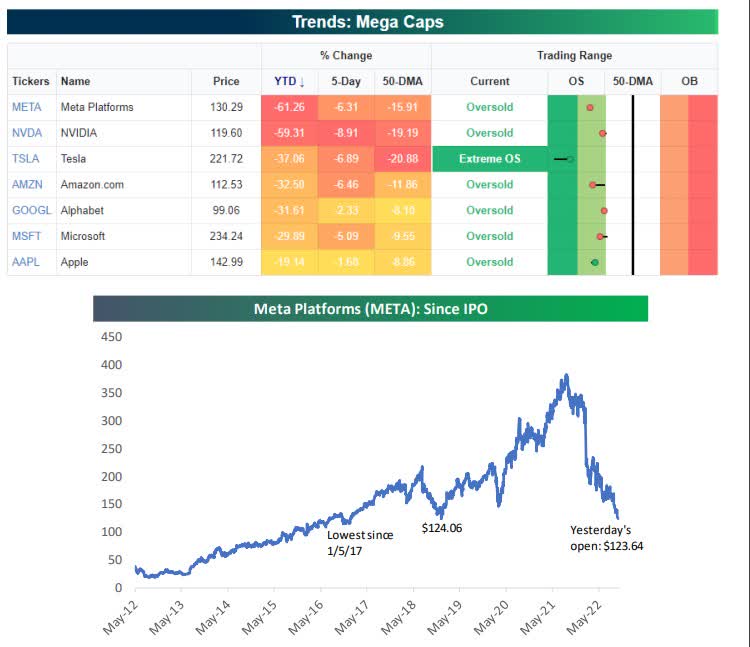
Ed Yardeni originally dubbed this the “megacap 8”, but note the oversold nature of the stocks and the “extreme oversold” nature of Tesla (TSLA). Tesla reports this coming week, and given it’s an auto manufacturer with high fixed costs and a high degree of operating leverage, Wall Street is poised to crush this giant if Q4 delivery and production guidance doesn’t meet expectations. Q3 ’22 deliveries were a little light relative to expectations. Plus, investors have the pressure of Elon Musk selling stock to fund Twitter (TWTR) (and the shorts knowing he must sell to fund the Twitter acquisition), in addition to the federal investigation of Musk announced last week by an unnamed federal agency. It’s a hot mess right now. Still, I think Tesla is one of the most disruptive, transformative companies of this decade. Play the long game…
The megacap names are all reporting in the same week again. (Earnings release date source is Briefing.com)
- Alphabet (GOOG, GOOGL): 10/25/22 AMC (after market close)
- Meta (META): 10/26/22 AMC
- Apple (AAPL): 10/27/22 AMC
- Amazon (AMZN): 10/27/22 AMC
Speaking of Meta, it’s part of the above Bespoke chart. At $125 per share, it’s trading at – are you ready for this – 2.7x book value, 3.3x tangible book value, 5x and 8x cash flow and free cash flow (ex balance sheet cash), and 2.9x sales. The last metric is 5x enterprise value (plus debt less cash) to TTM cash flow.
Peak EPS for Meta was 2021 of $13.92. Meta isn’t expected to pass “peak EPS” until 2025, and that’s using current estimates.
J.P. Morgan On 10-Year Treasury Yields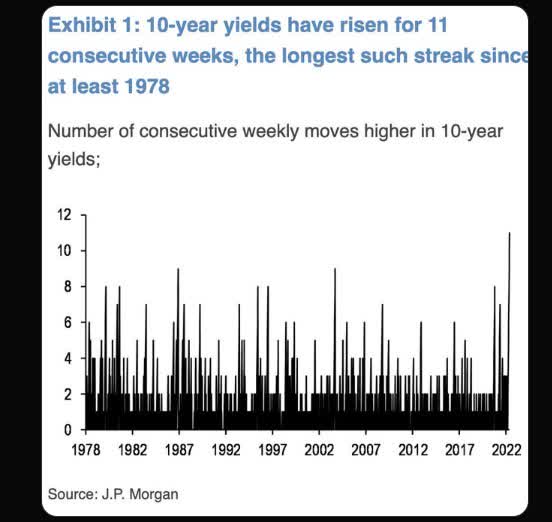
11 straight weeks. That’s grim. Have to think this could have something to do with the first point about Yellen and Treasury illiquidity.
Summary / conclusion
Bear markets are very anxiety-producing, and writing helps to smooth the edges out over the weekends. This is all the stuff rattling around in my head the past few days. It seems like the financial system is getting a little stressed. Do megacap earnings hold up? In 2001-2002, when the secular buildout of corporate technology collapsed in an ash heap after March 2000, the S&P 500 corrected 50% until July 2002, but small-caps, value stocks, emerging markets, China, and commodities were all very robust during the bear market. That’s not happening today: only Energy has had a decent year return-wise, and it’s just now getting to its 2014 peak. Technically, energy – as a sector – is still in an 8-year bear market. The traditional portfolio diversifiers have not helped returns in 2022.
None of this representation to buy, hold or sell anything. Past performance is no guarantee of future results. The above information can change, and this blog may or may not be updated. Capital markets can and do change quickly, for both the better and worse. Evaluate your own appetite for risk.
Thanks for reading.
Editor’s Note: The summary bullets for this article were chosen by Seeking Alpha editors.
Be the first to comment