

Thomas Barwick
I typically don’t write articles that focus on the negatives but there comes a time when controversial things need to be said. I want to preface this article by saying that Archer-Daniels-Midland (NYSE:ADM) is a great company that has served as a phenomenal buy-and-hold investment for decades.
ADM carries many of the desirable characteristics that a dividend income investor/retiree would like to see in an investment. The most desirable characteristics include:
- Low dividend payout ratio
- 49 consecutive years of dividend increases
- Defensive business model (think of it like this, people need to eat!)
While this may sound like the perfect investment, there are a handful of reasons why investors should either sell part of their position (this is what we did) or avoid purchasing shares at these levels. I will spend most of the article focusing on the reasons why ADM is a poor investment choice at this point in time.
At the end of the article, I will review other investment options that provide a more compelling risk/reward scenario (there will be options provided for opportunistic investors willing to engage in more risk as well as those who are retired and looking for secure yields).
Dividend Yield
One of the simplest metrics that I judge investments on is whether or not the dividend yield is consistent with the historical yield. I also like to use the dividend yield whether or not the stock is attractively priced or expensive based on the historical yield. This method works extremely well for stable companies that have an extensive history of paying dividends and consistently raising the dividend payment each year.
For those unfamiliar with using this method, the logic is pretty straightforward.
When the dividend yield is high this typically correlates with the share price being low.
When the dividend yield is low this typically correlates with the share price being high.
As always, there are exceptions to these rules which is why it is important to remember that it works best with companies that have an extensive history of paying dividends and offer consistent increases. Companies that have recently initiated dividend payments or that offer wild swings in their annual increases are two examples that would be difficult to value using this method.
Many of the stocks that I currently cover are trading at their 52-week-lows which means that the dividend yield is at the higher end relative to the historical yield (in other words, we would be able to capture the same great dividend for less money than someone who purchased when shares were close to the 52-week-high). A higher dividend yield for a company that has consistently paid dividends means that it is worth further investigation to see if it is a buying opportunity.
Below are two examples of what I would consider to be yields worth investigating.
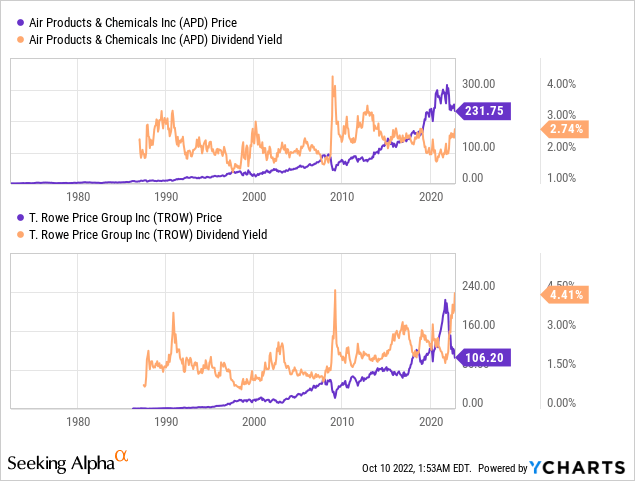
In the case of Air Products and Chemicals (APD) the stock has consistently traded closer to a 2% dividend yield and investors would be lucky to purchase shares at a 3% yield considering the time the stock price was low enough to achieve this is very uncommon going all the way back to the second half of the 1980’s.
T. Rowe Price (TROW) is an even more stark example in that there was only one other short period of time during the 2008 financial crisis that shares were available at a yield close to 4.5%.
ADM currently represents the other end of the spectrum which is to say that the dividend yield is low because the share price is so high.
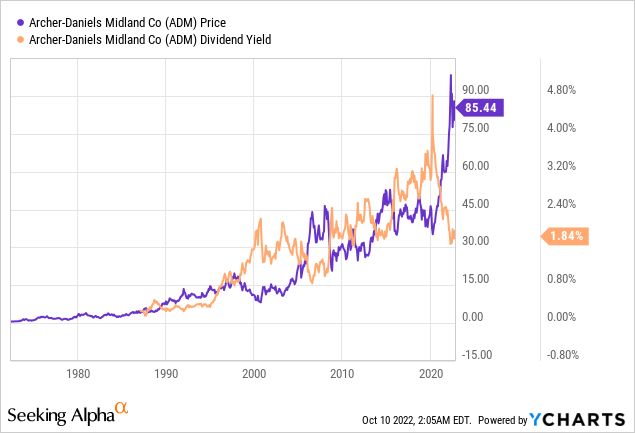
As you can see, ADM’s current dividend yield of 1.87% (YCharts is off slightly in the image above) is nothing to celebrate because for the better part of the last 20 years shares could be purchased at a dividend yield greater than what is currently trading at today.
Future Earnings Pressure
Another area worth exploring is how the stock’s current price compares to its historical price relative to earnings during that timeframe. Using a P/E ratio we are able to show that the current ratio of 13.2x earnings is below the 10-year average of 15.7x earnings which would equate to a share price of $108.20/share. Based on the information above, you might be wondering why the ratios tell us something positive but I am saying that the opposite scenario of potential downside in more likely?
The simple answer is that a P/E ratio by itself is a very weak metric which is why it’s so important to consider other ratios and metrics that can help explain why a P/E ratio may look attractive/unattractive.
ADM – 10 Year (FAST Graphs)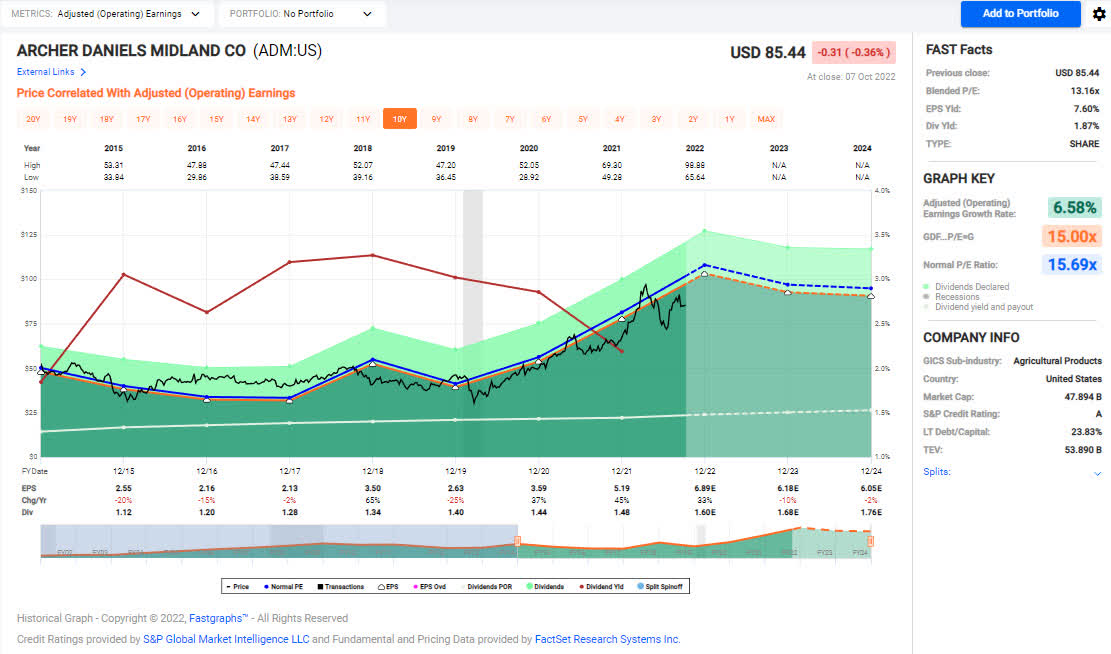
Programs like FAST Graphs can give us future earnings estimates as a way to gauge the trend of the P/E ratio. In the same way that I used the relative dividend yield we can do the same with the relative P/E ratio.
Consider the following bullet points below to better understand why I see a much higher probability of share price downside.
2022 – Current P/E ratio of 13.2x based on $6.89/share of earnings FY-2022. 10-year average P/E ratio of 15.7x would result in a share price of $108.20/share.
2023 – Current P/E ratio of 13.2x based on $6.18/share of earnings FY-2023. 10-year average P/E ratio of 15.7x would result in a share price of $97.03/share.
2024 – Current P/E ratio of 13.2x based on $6.05/share of earnings FY-2024. 10-year average P/E ratio of 15.7x would result in a share price of $94.99/share
The expected earnings pull back in 2023 and 2024 suggests that ADMs current stock price is almost priced for perfection at a 10-year average P/E ratio that is a multiple of 2.5x higher than the current valuation. If the multiple were to remain at current levels of 13.2x the expected share price would be just under $80/share or approximately $5.50/share less than its current price.
Challenges In The Agricultural Industry
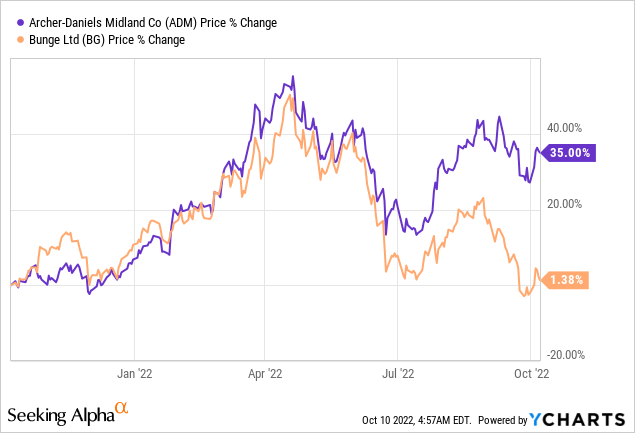
I understand that it is easy to cherry pick companies like APD and TROW when drawing comparisons but when you look at direct competitors, we are seeing weakness during the same future time periods of 2023 and 2024. It should also be noted that ADM is the 1000-pound gorilla in the room with its largest competitor Bunge Limited (BG) weighing in at a market cap approximately 25% of ADMs.
Bunge – 10 Year (FAST Graphs)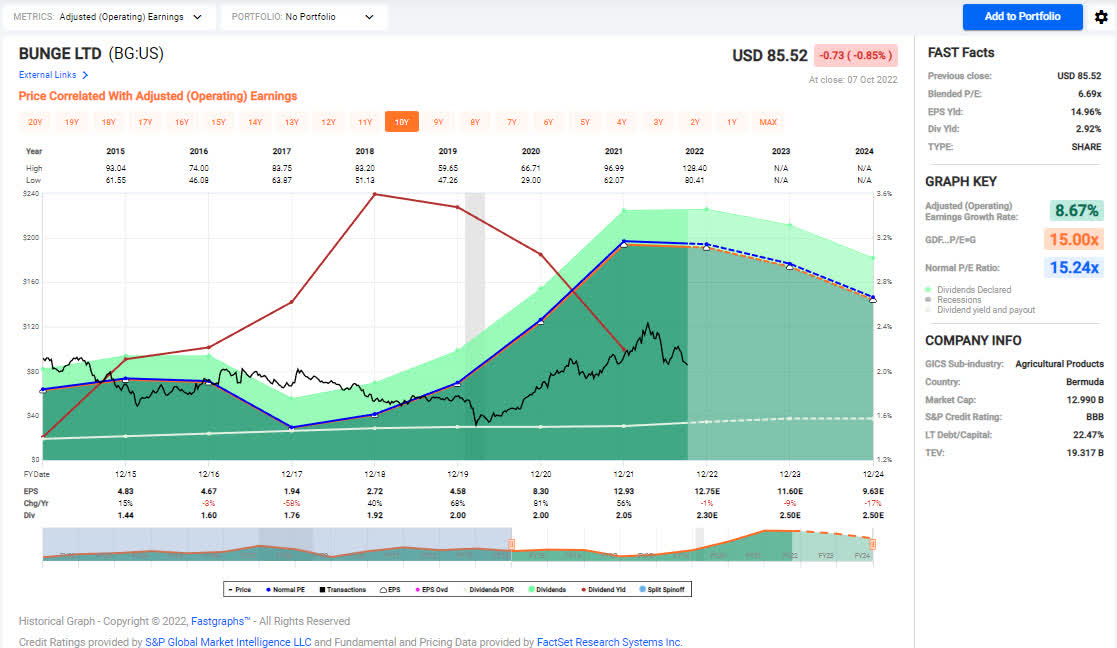
What I find most interesting about BG is that FAST Graphs shows a similar level of weakness in 2023 and 2024 with a significant reduction in earnings. Although BG appears to have more future headwinds impacting potential earnings, the stock price has suffered significantly more than ADM.
The 10-year average P/E ratio for ADM is 15.7x which is comparable to BG’s 10-year average P/E ratio of 15.2x.
As the share price difference continues to expand this has subsequently increased disparity in the dividend yield.
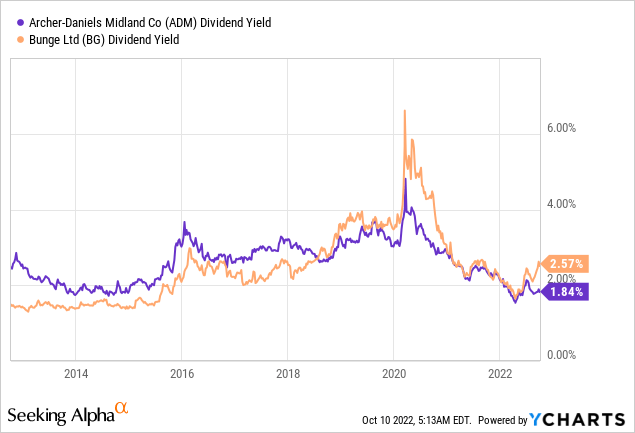
Over the last 10 years the dividend yield between both companies has been similar and dividend growth rates have been nearly identical over the same time frame. ADM’s 10-year average dividend growth rate is 8.4% while BG’s 10-year average dividend growth rate comes in at just under 8%.
I have not performed a significant amount of due diligence on BG but these initial findings make it clear that BG has the potential to be a more compelling investment than ADM, especially if there is nothing in particular that explains/justifies the disparity in share price.
A quick review of SA Authors that cover both stocks show that all of them rank BG and ADM as a Buy in the last 30 days.
Alternative Investment Options
I have broken down alternative investment options based on risk appetite.
Conservative/Retired Income Investor
For my clients John and Jane we opted to sell a chunk of their holdings in ADM and reinvest those in a three-month brokered CD yielding 3.35% APY. John and Jane are already heavily invested in many dividend growth companies and with the increased uncertainty over the last 30 days combined with the increased yield associated with brokered CDs made this choice a no-brainer. At 3.35% John and Jane are able to generate a dividend yield that is nearly 150 basis points higher than the current yield of ADM.
Dividend Growth Investor – 10 Years Until Retirement
For investors who are looking to establish positions in great companies that they can continue to hold into retirement that offer compelling yields with strong annual increases I would strongly consider the following options listed below (some of which have already been mentioned earlier in this article). All of the companies listed below (with the exception of BG) are holdings in my own portfolio and/or in John and Jane’s investment portfolio.
- APD
- TROW
- Parker-Hannifin (PH)
- Honeywell (HON)
- For those willing to do additional research I would also include BG on the list because indicators suggest that it is a much more compelling value than ADM at this point in time.
Dividend Growth Investor – High Yield
The last set of options is for investors who are willing to engage in above average risk in order to obtain an above average yield. I wouldn’t consider any of the businesses listed below to be extremely high risk, but the current buying opportunity is being influenced by special events or are deep value opportunities. All of the companies listed below (with the exception of NEM) are holdings in my own portfolio and/or in John and Jane’s investment portfolio.
- LyondellBasell Industries (LYB)
- 3M (MMM)
- Rio Tinto (RIO)
- Newmont Corporation (NEM) – I have been tracking this for quite some time but have yet to pull the trigger.
Conclusion
ADM is a great company with a great business model but it is trading at a multiple that (IMHO) will result in bare minimum price appreciation in the best-case scenario. I believe it is more likely that ADM’s share price will experience a small loss over the next two years based on 2023 and 2024 estimates.
Based on the information I currently have, I would need to see ADM’s share price drop into the mid-$60/share range before I would consider adding more shares. A share price in this range would generate a dividend yield of approximately 2.5%. Even then, I would still prefer to wait for shares to drop under $60 before I would consider shares of ADM to be very compelling. Barring some unforeseen circumstances I do not see a high likelihood that shares will reach this price point anytime soon.
My clients John and Jane are long ADM, APD, TROW, PH, HON, LYB, MMM, RIO. If you are interested in seeing more about their portfolio, I publish articles monthly for each of their accounts.
Be the first to comment