

Nandani Bridglal
Archer-Daniels-Midland Company (NYSE:ADM) has enjoyed a substantial rally as inflation has surged, and the shares have risen 37% over the past 12 months. Even as inflation appears to be slowing, concerns about global food shortages have the potential to further boost costs of a range of agricultural commodities. ADM reported Q2 results on July 26th, beating expectations on earnings by more than 25%. While the shares have risen since the Q2 report, they are 14% below the 12-month high close of $98.22 on April 20th. The shares fell from this high with increased concerns about a possible recession.
Seeking Alpha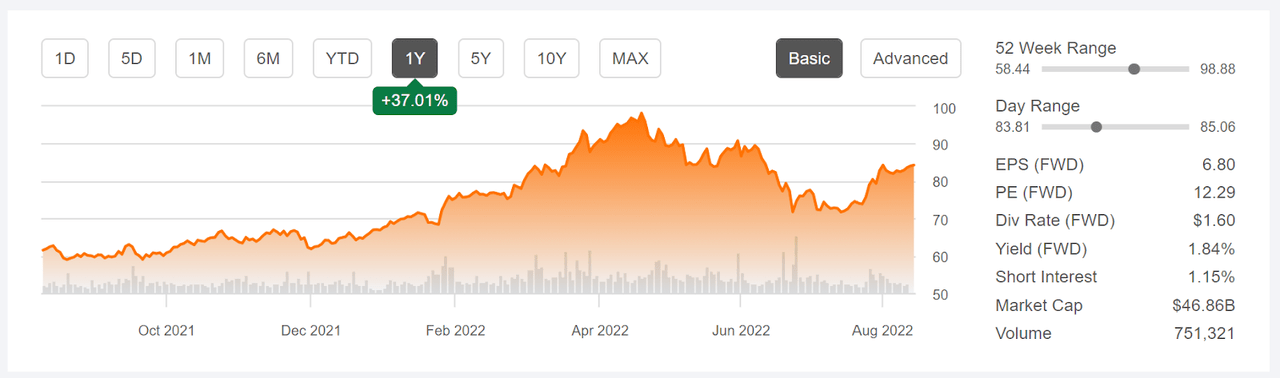
12-Month price history and basic statistics for ADM (Source: Seeking Alpha)
Looking at quarterly earnings shows how rapidly earnings have grown in the past 2 years. EPS for Q2 of 2022 was 1.6 times EPS for Q2 of 2021 and 2.5 times the Q2 EPS for Q2 of 2020. Management attributed Q2’s blockbuster earnings largely to “productivity initiatives that are improving our efficiency and cost structure and innovation work that is powering profitable growth.” Of course, no company wants to acknowledge that it is benefiting from rising inflation that is squeezing American families, even as data demonstrates that many companies have higher margins with higher inflation (also see here).
ETrade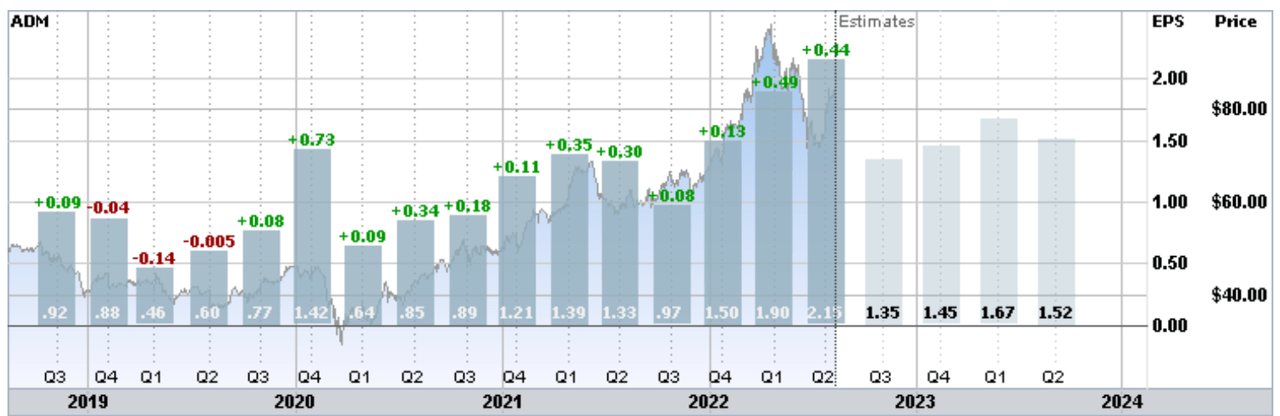
Trailing (4 years) and estimated future quarterly EPS for ADM. Green (red) values are amounts by which EPS beat (missed) the consensus expected value (Source: ETrade)
While ADM’s dividend yield is quite low, at 1.84%, the company anticipates distributing capital to shareholders with $1 Billion in share buybacks in the 2nd half of 2022 (see slide 10).
I last wrote about ADM on April 19th, at which time I downgraded the shares from bullish/buy to neutral/hold. My primary concern at that time was that the shares had gotten too expensive. ADM closed at $95.93 on April 19th, 13.7% above the current share price. At that time, the Wall Street consensus rating on the shares was bullish, although the consensus 12-month price target was 16% to 20% below the share price. The consensus outlook implied by options prices, the market-implied outlook, exhibited a bearish tilt to January of 2023.
For readers who are unfamiliar with the market-implied outlook, a brief explanation is needed. The price of an option on a stock is largely determined by the market’s consensus estimate of the probability that the stock price will rise above (call option) or fall below (put option) a specific level (the option strike price) between now and when the option expires. By analyzing the prices of call and put options at a range of strike prices, all with the same expiration date, it is possible to calculate a probabilistic price forecast that reconciles the options prices. This is the market-implied outlook. For a deeper explanation and background, I recommend this monograph published by the CFA Institute.
With the significant decline in ADM since my last analysis, along with strong earnings reported for Q1 (on April 26th) and Q2 (July 26th), I have calculated an updated market-implied outlook for ADM and compared this with the current Wall Street consensus outlook.
Wall Street Consensus Outlook for ADM
ETrade calculates the Wall Street consensus outlook for ADM using ratings and price targets from just 4 ranked analysts who have published their views over the past 3 months. This is, obviously, a very small sample. The consensus rating is bullish and the consensus price target is $94.67, 11.95% above the current share price. The consensus price target when I analyzed ADM in April was $81.43.
ETrade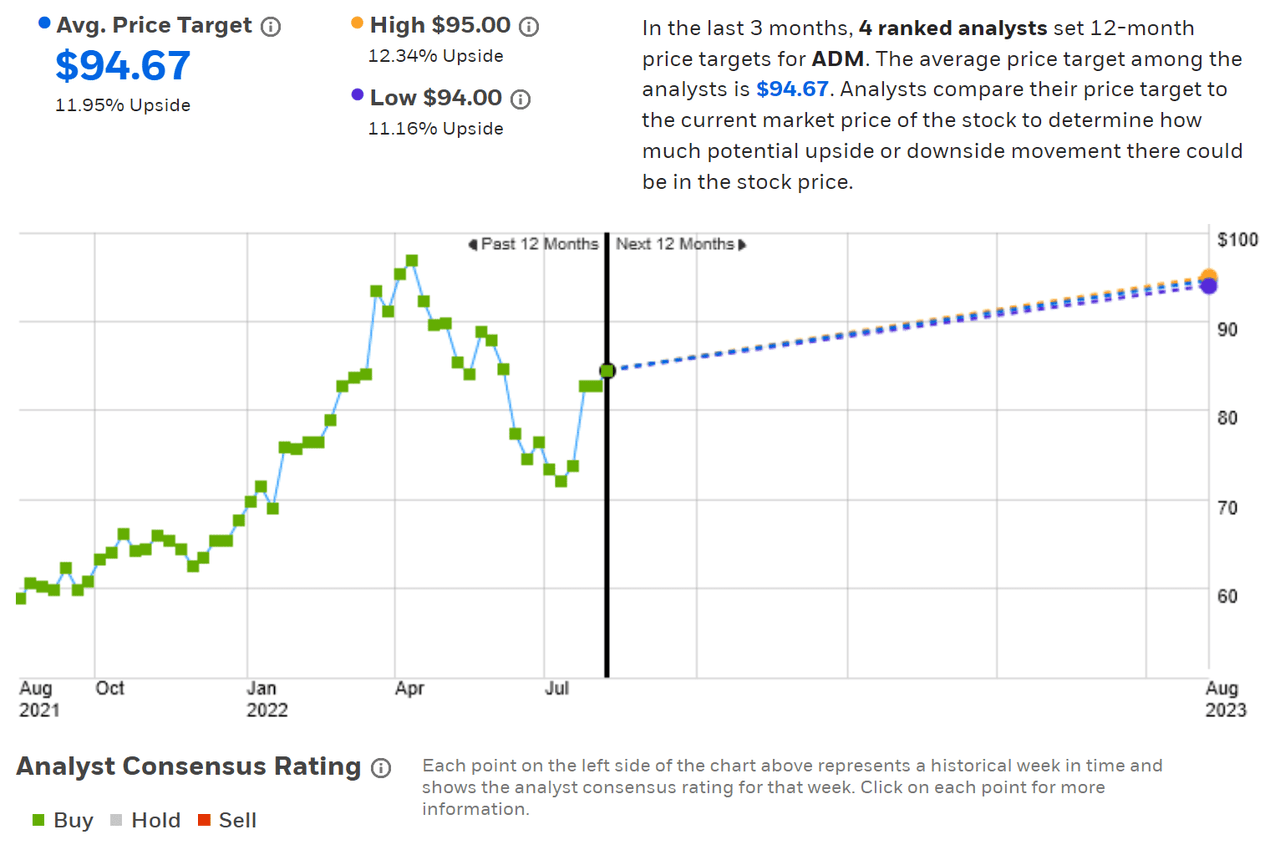
Wall Street analyst consensus rating and 12-month price target for ADM (Source: ETrade)
Seeking Alpha’s version of the Wall Street consensus outlook is based on ratings and price targets from 16 analysts who have published their views over the past 90 days. The consensus rating for ADM is bullish and the consensus 12-month price target is $94.38 (11.6% above the current share price), very close to the result from ETrade even though the sample of analysts is considerably higher.
Seeking Alpha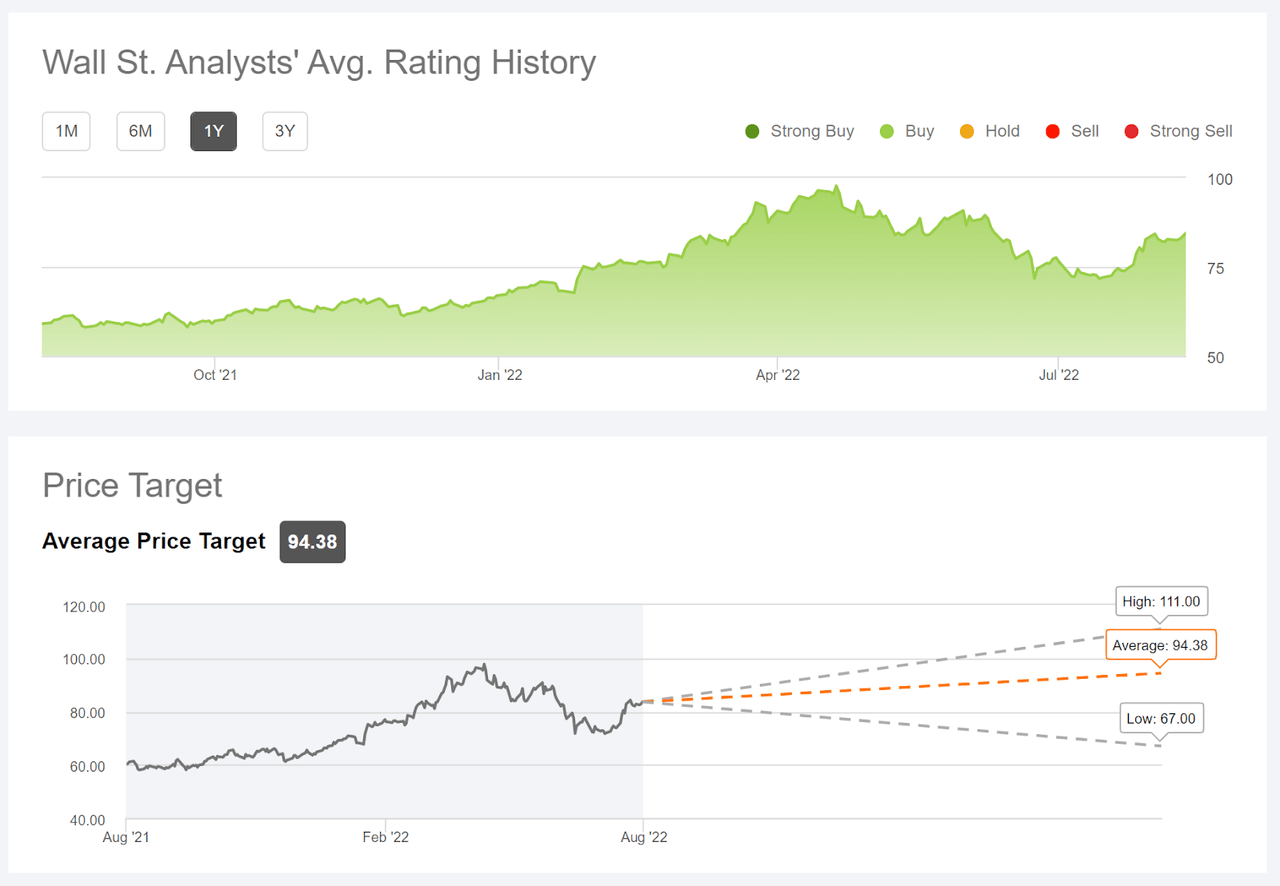
Wall Street analyst consensus rating and 12-month price target for ADM (Source: Seeking Alpha)
Over the 3.8 months since I last looked at ADM, the share price has fallen and the 12-month consensus price target has risen. The Wall Street consensus outlook looks considerably more favorable today, with an expected 12-month total return of 13.6% (averaging the two consensus price targets and adding the dividend).
Market-Implied Outlook for ADM
I have calculated the market-implied outlook for ADM for the 5.3-month period from today until January 20, 2023, using the prices of call and put options that expire on this date. I chose this specific option expiration date to provide a view through the end of 2022 and because the options expiring in January are particularly actively traded.
The standard presentation of the market-implied outlook is a probability distribution of price return, with probability on the vertical axis and return on the horizontal.
Geoff Considine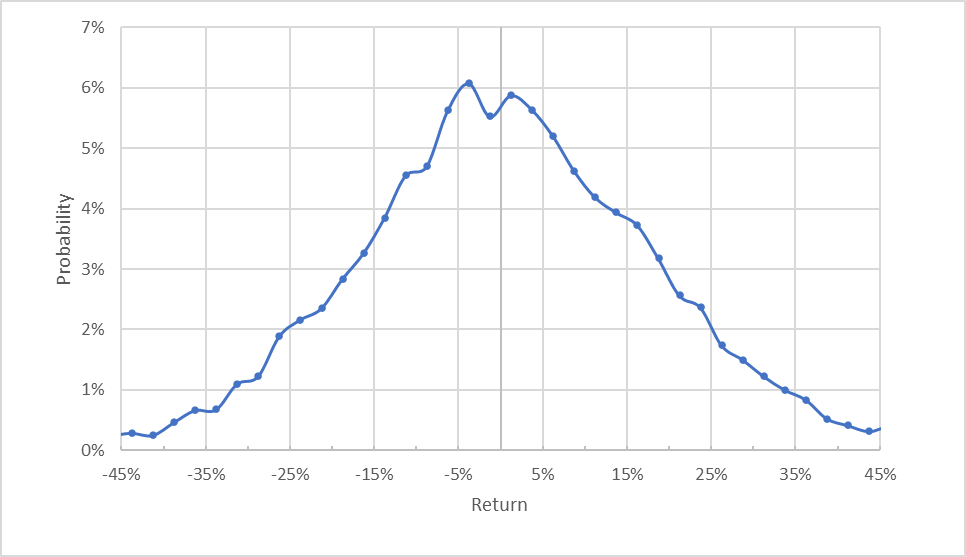
Market-implied price return probabilities for ADM for the 5.3-month period from now until January 20, 2023 (Source: Author’s calculations using options quotes from ETrade)
The probabilities for price returns over the next 5.3 months are generally symmetric, with comparable probabilities of positive and negative returns of the same magnitude. The expected volatility calculated from this outlook is 31.0% (annualized), as compared to 30% from my analysis in April.
To make it easier to compare the relative probabilities of positive and negative returns, I rotate the negative return side of the distribution about the vertical axis (see chart below).
Geoff Considine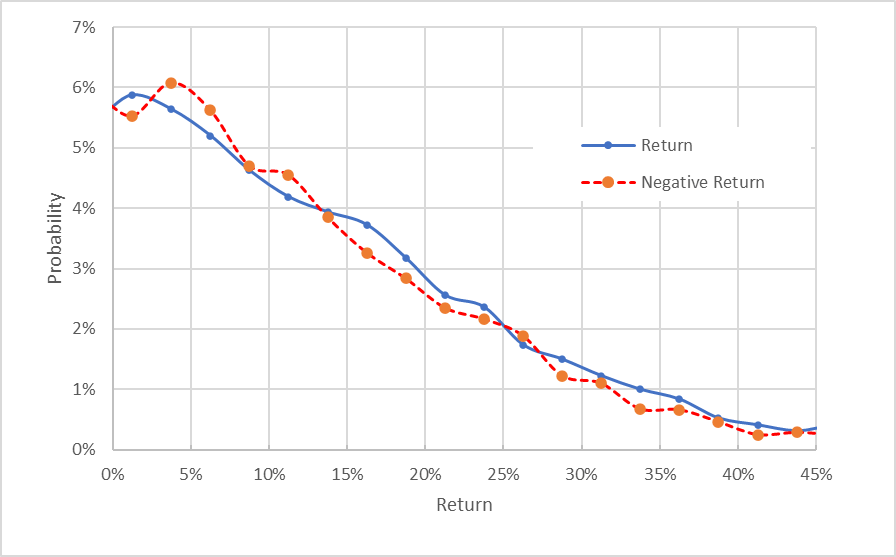
Market-implied price return probabilities for ADM for the 5.3-month period from now until January 20, 2023. The negative return side of the distribution has been rotated about the vertical axis (Source: Author’s calculations using options quotes from ETrade)
This view shows just how closely the probabilities of positive and negative returns match (the solid blue line and the dashed red line track very closely). Back in April, the probabilities of negative returns were elevated relative to those for positive returns, indicating a more bearish tilt. The analysis from April also looked at options expiring on January 20, 2023. The market-implied outlook for ADM has become more favorable.
Theory indicates that the market-implied outlook is expected to have a negative bias because investors, in aggregate, are risk averse and thus tend to pay more than fair value for downside protection. There is no way to measure the magnitude of this bias, or whether it is even present, however. This expected bias makes the current market-implied outlook look slightly bullish.
Covered calls on ADM are worth considering, given the current market conditions. As I write this on August 11th, I bought shares of ADM for $84.38 and sold January 20, 2023 call options with a strike price of $85 for $6.11. The net position provides 7.2% in option premium yield, in addition to 0.95% in anticipated dividend yield (2 payments of $0.4 each) over the next 5.3 months. Unless you expect more than 8.15% in return from ADM over this period (this corresponds to an annualized rate of return of 18.2%), selling these covered calls looks quite attractive.
Summary
Many companies are generating higher earnings with rising inflation, and ADM is in this group. How long the tailwind of rising prices will continue is hard to predict. Even though inflation appears to be moderating, this month’s gain in CPI is still very high by historical standards. ADM’s share price has declined substantially since the 12-month high in April, making the shares more attractive. The Wall Street consensus rating is bullish, with a consensus 12-month price target that implies an expected total return of 13.6% over the next 12 months. As a rule of thumb for a buy rating, I want to see an expected annual total return that is at least 50% of the expected volatility (31% for ADM). ADM is at a ratio of 44%, somewhat short of this threshold. The market-implied outlook for ADM to January of 2023 is slightly bullish and has improved since April. Today’s cheaper share price, the higher consensus price target, and the improved and slightly bullish market-implied outlook, convince me to change my rating on ADM from neutral/hold to bullish/buy. I don’t expect large gains, but I like the inflation-offsetting aspects of owning ADM.
Be the first to comment