


SimonSkafar/E+ via Getty Images
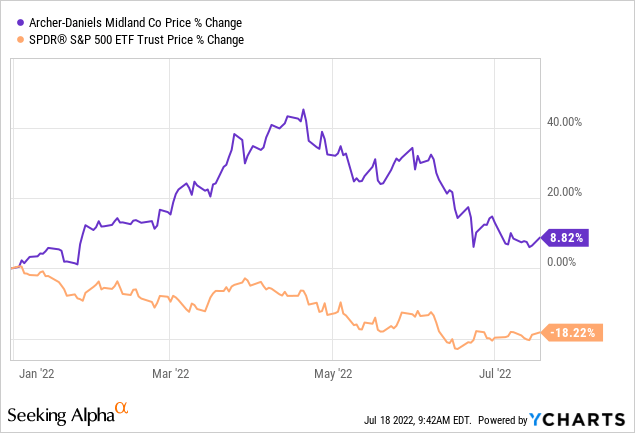
Archer-Daniels-Midland’s (NYSE:ADM) market value has increased by almost 9% year to date, while the broader market has declined by as much as 18%.
In this article, we will focus on how ADM could be performing in the current market environment, in the near term. First, we will take a look at how ADM’s stock has historically performed during times of low consumer confidence. Then, we will use the Gordon Growth Model to determine what the fair value of ADM’s stock could be, and what price-to-earnings ratio could be justified.
1.) Consumer confidence
Consumer confidence – a leading economic indicator – is often used to gauge the potential changes in the spending behaviour of the consumer, in the near future.
Consumer confidence in the United States has been declining steadily over the past months, even falling below levels that were recorded during the 2008-2009 financial crisis.
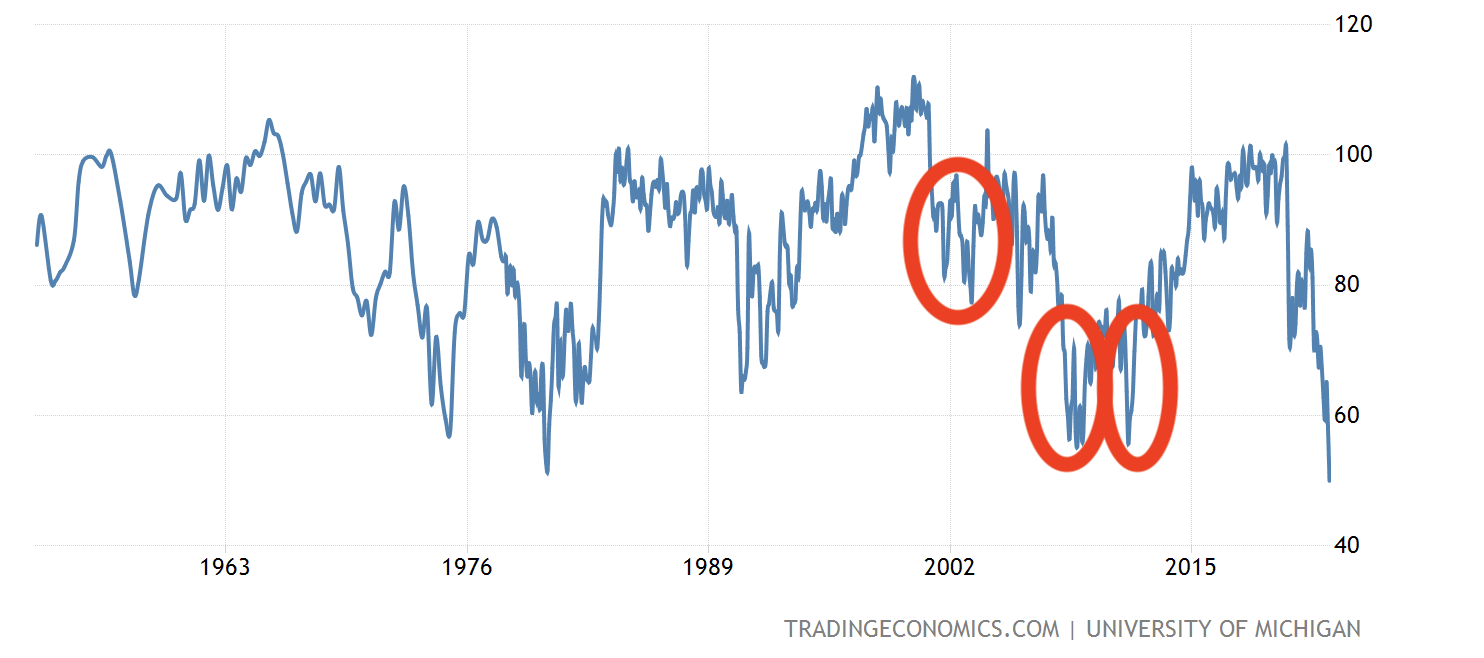
U.S. Consumer confidence (Tradingeconomics.com)
The red circles indicate periods, which have been characterised by relatively low consumer confidence. During such periods, firms that are selling durable, discretionary, non-essential goods are likely to face a decreasing demand for their products. People tend to cut purchases of such items, when their financial outlook becomes more uncertain. On the other hand, firms in the food and agricultural products industry are expected to be less impacted as their products are essential.
We will be focusing on these low confidence periods now, to gauge how ADM’s stock is actually expected to perform in such a macroeconomic environment.
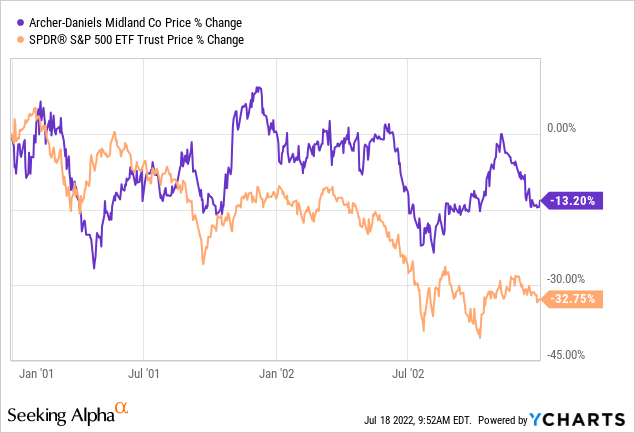
2001-2003
In this period, ADM has outperformed the S&P 500 (SPY) by about 20%. Although both ADM and SPY closed in the negative territory at the end of this two-year period, ADM’s stock price has declined only about 13% compared to the more than 32% decline of the SPY.
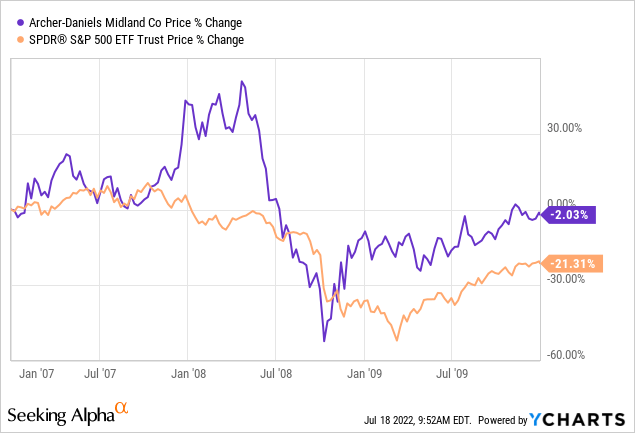
2007-2010
Between 2007 and 2010, ADM once again outperformed the broader market. Despite the sharp drop in the stock price in 2008, ADM has lost only 2% of its market value during this period, compared to the more than 21% decline of the broader market.
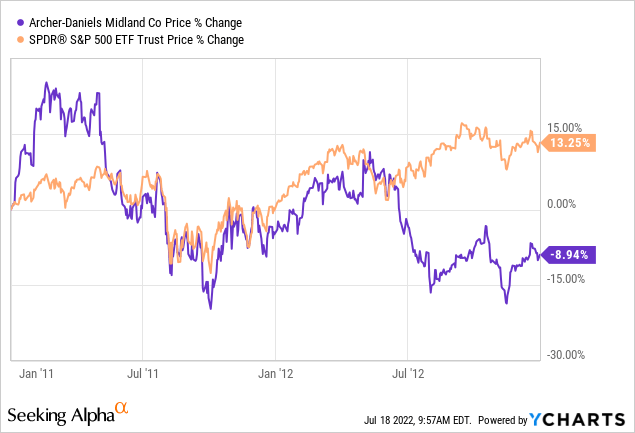
2011-2013
Although ADM has been performing about in-line with the broader market until mid-2012, due to the sharp decline of the stock price in June 2012, the firm eventually underperformed the SPY by about 22%.
To sum up, based on these three periods, we cannot establish a clear relationship between consumer confidence and ADM’s stock price performance. From this perspective, we believe that ADM is not the most attractive option now to consider. If you are looking for a defensive name, which has historically outperformed in such an environment, take a look at our previous article on Conagra (CAG): Conagra Could Be A Safe Haven In Times Of Declining Consumer Confidence.
Let us take a look now on the valuation of the firm using the Gordon Growth Model.
Valuation
Gordon Growth Model
The Gordon Growth Model is a simple dividend discount model, which can be used to value the equity of firms that are paying dividends. The primary underlying assumption of this model is that the dividend grows indefinitely at a constant rate. Because of this criterion, model is particularly suitable for the valuation of firms that are:
-
Paying dividends
-
In the mature growth phase
-
Relatively insensitive to the business cycle
In our opinion, ADM fulfils all these criteria relatively well. Plus, the firm’s strong track record of steadily increasing dividend payments at a stable growth rate could also indicate the suitability of the approach, if the trend is expected to continue in the future.
The Gordon Growth Model is defined by the following formula:
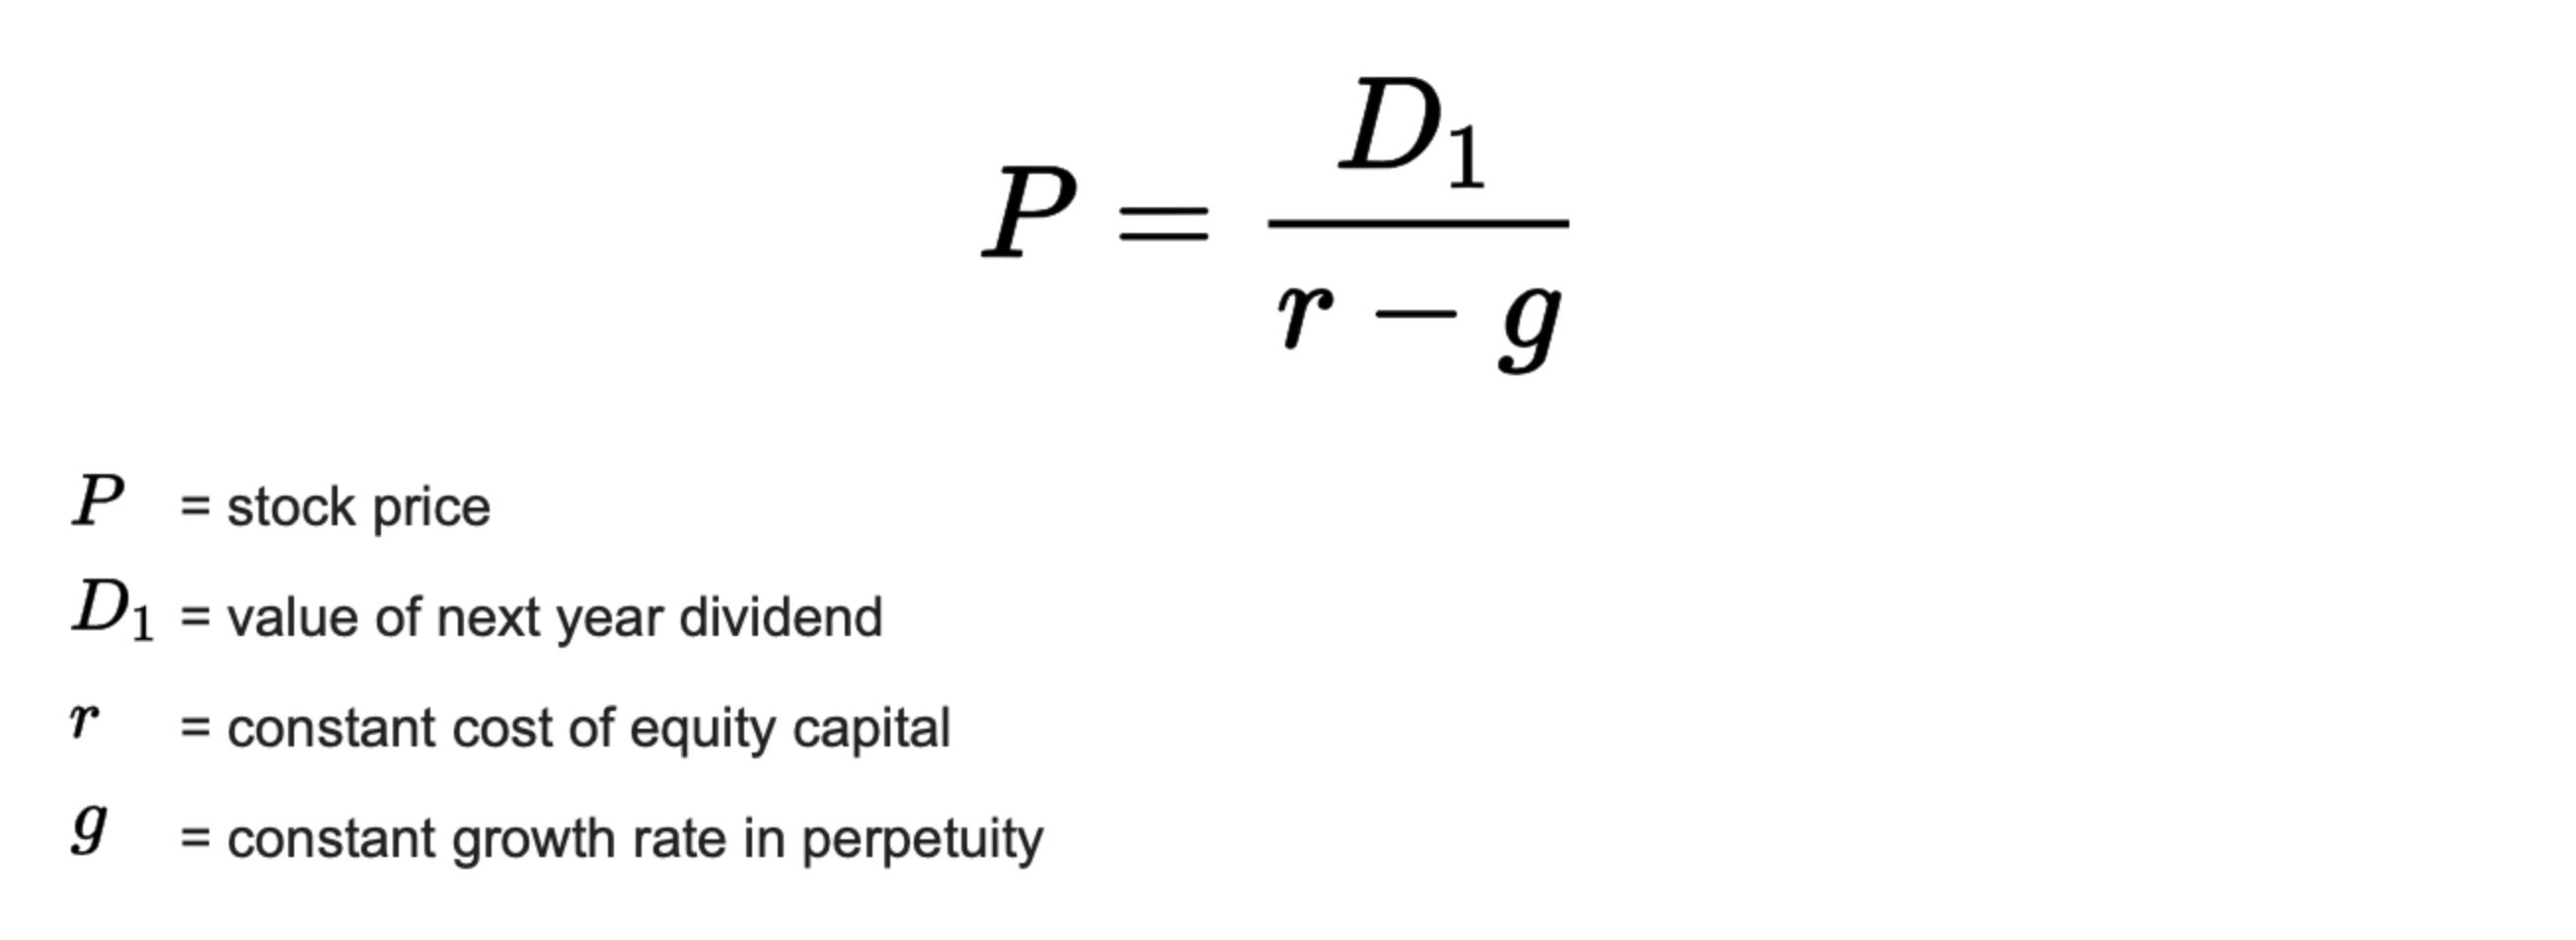
Gordon Growth Model (Wallstreetprep.com)
In order to make a meaningful evaluation of the intrinsic value of the stock, we have to make a few assumptions:
1.) What rate of return is required?
For this calculation, we will be using ADM’s weighted average cost of capital, which is estimated to be in the range of 5.9% to 7.6%. To remain on the conservative side of the range, we will be using 7%.
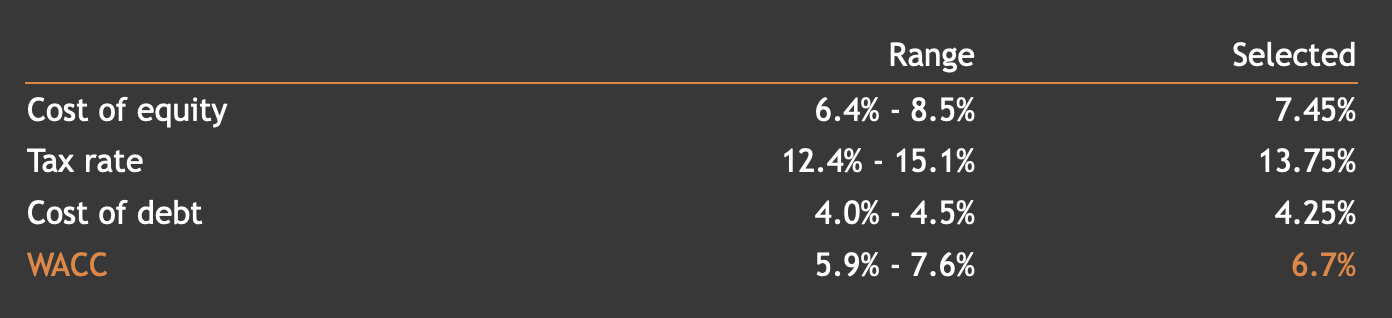
WACC (Valueinvesting.io)
2.) What could be a reasonable perpetual dividend growth rate?
To determine a realistic rate, we have to take a look at FL’s dividend payment history and try to define a reasonable long-term trend.
The following chart depicts ADM’s dividend history. The firm has been paying dividends for 48 years consecutively and have been increasing this dividend in each year in the last 28 years. The current annual dividend payment is $1.6 per share.
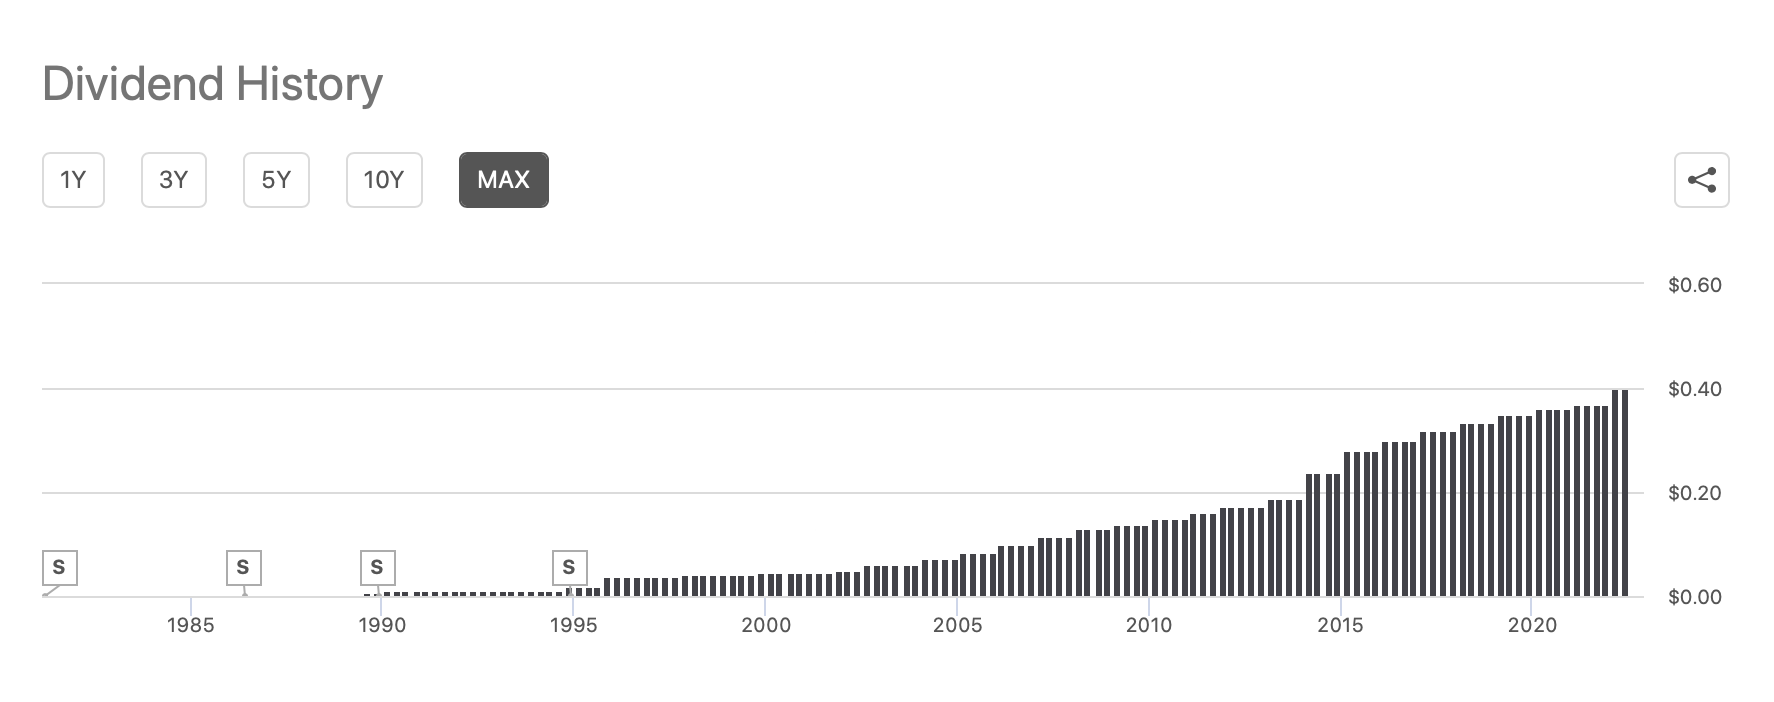
Dividend history (Seekingalpha.com)
To make sure that we take uncertainty into account, we will take a look at a set of growth rate assumptions and try to calculate a range of realistic fair values using historic growth rates.
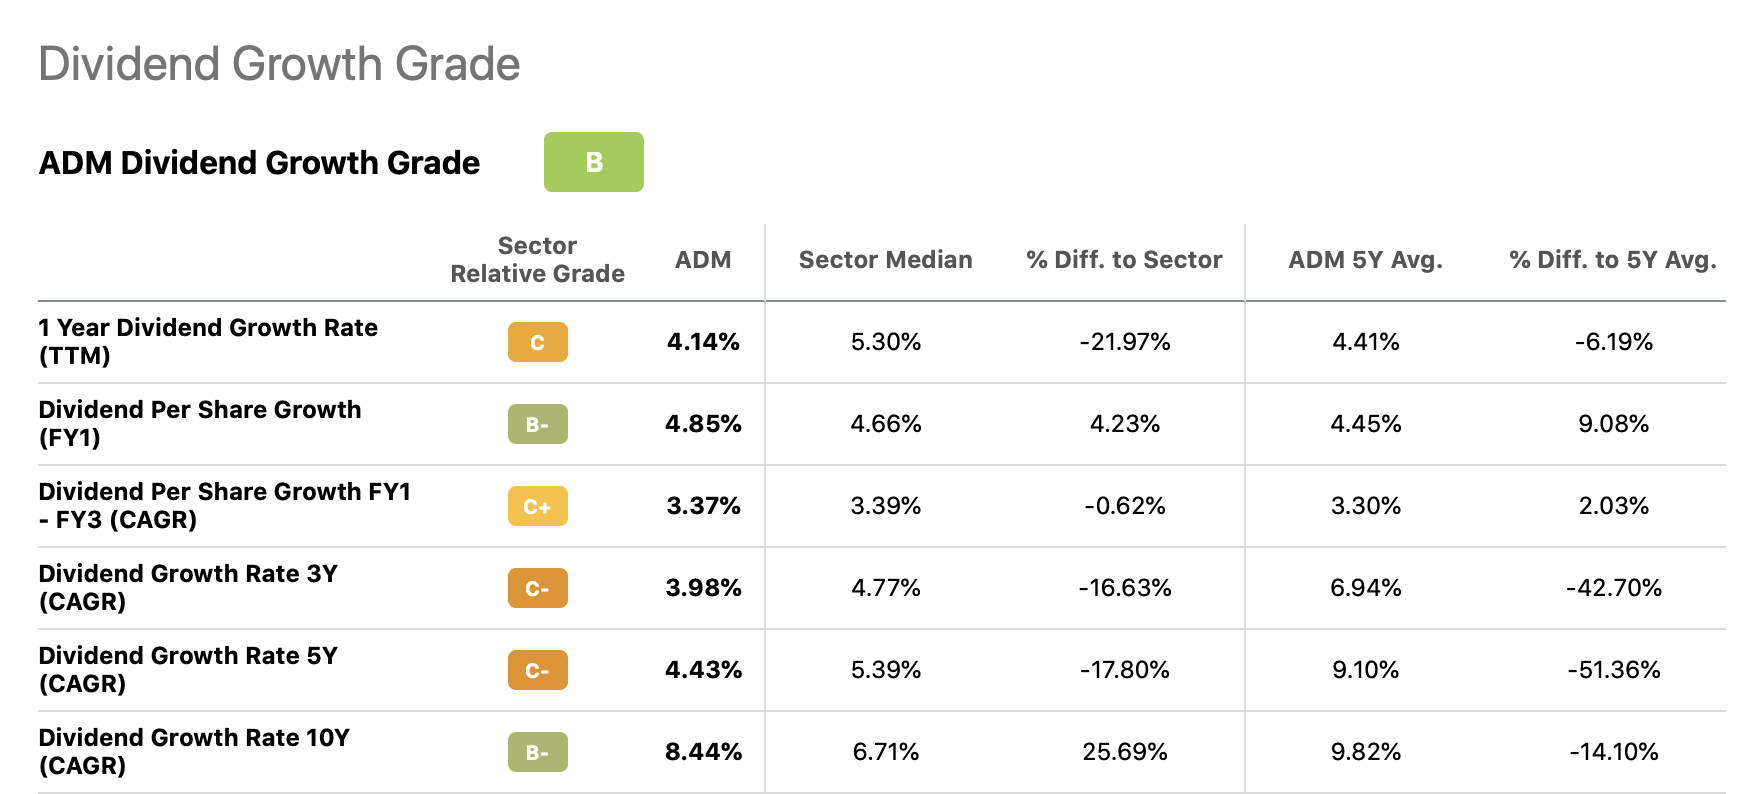
Dividend growth (Seekingalpha.com)
According to the historical dividend growth rates, a range of 3% to 5% appears to be a reasonable choice.
The following table summarizes our results:

Results (Author)
Currently, ADM’s stock is trading around $73 per share, which is on the higher end of our fair value range. Because of this, we believe that ADM is not the most attractive option from a valuation perspective now. But before we conclude, we will also establish a range of P/E multiples, which could be justified for the company.
Justified P/E
Price multiples are often used separately from present value models. On the other hand, the Gordon growth model could be applied to relate fundamentals through a discounted cash flow model. This method makes it possible to determine a so-called justified price to earnings ratio.
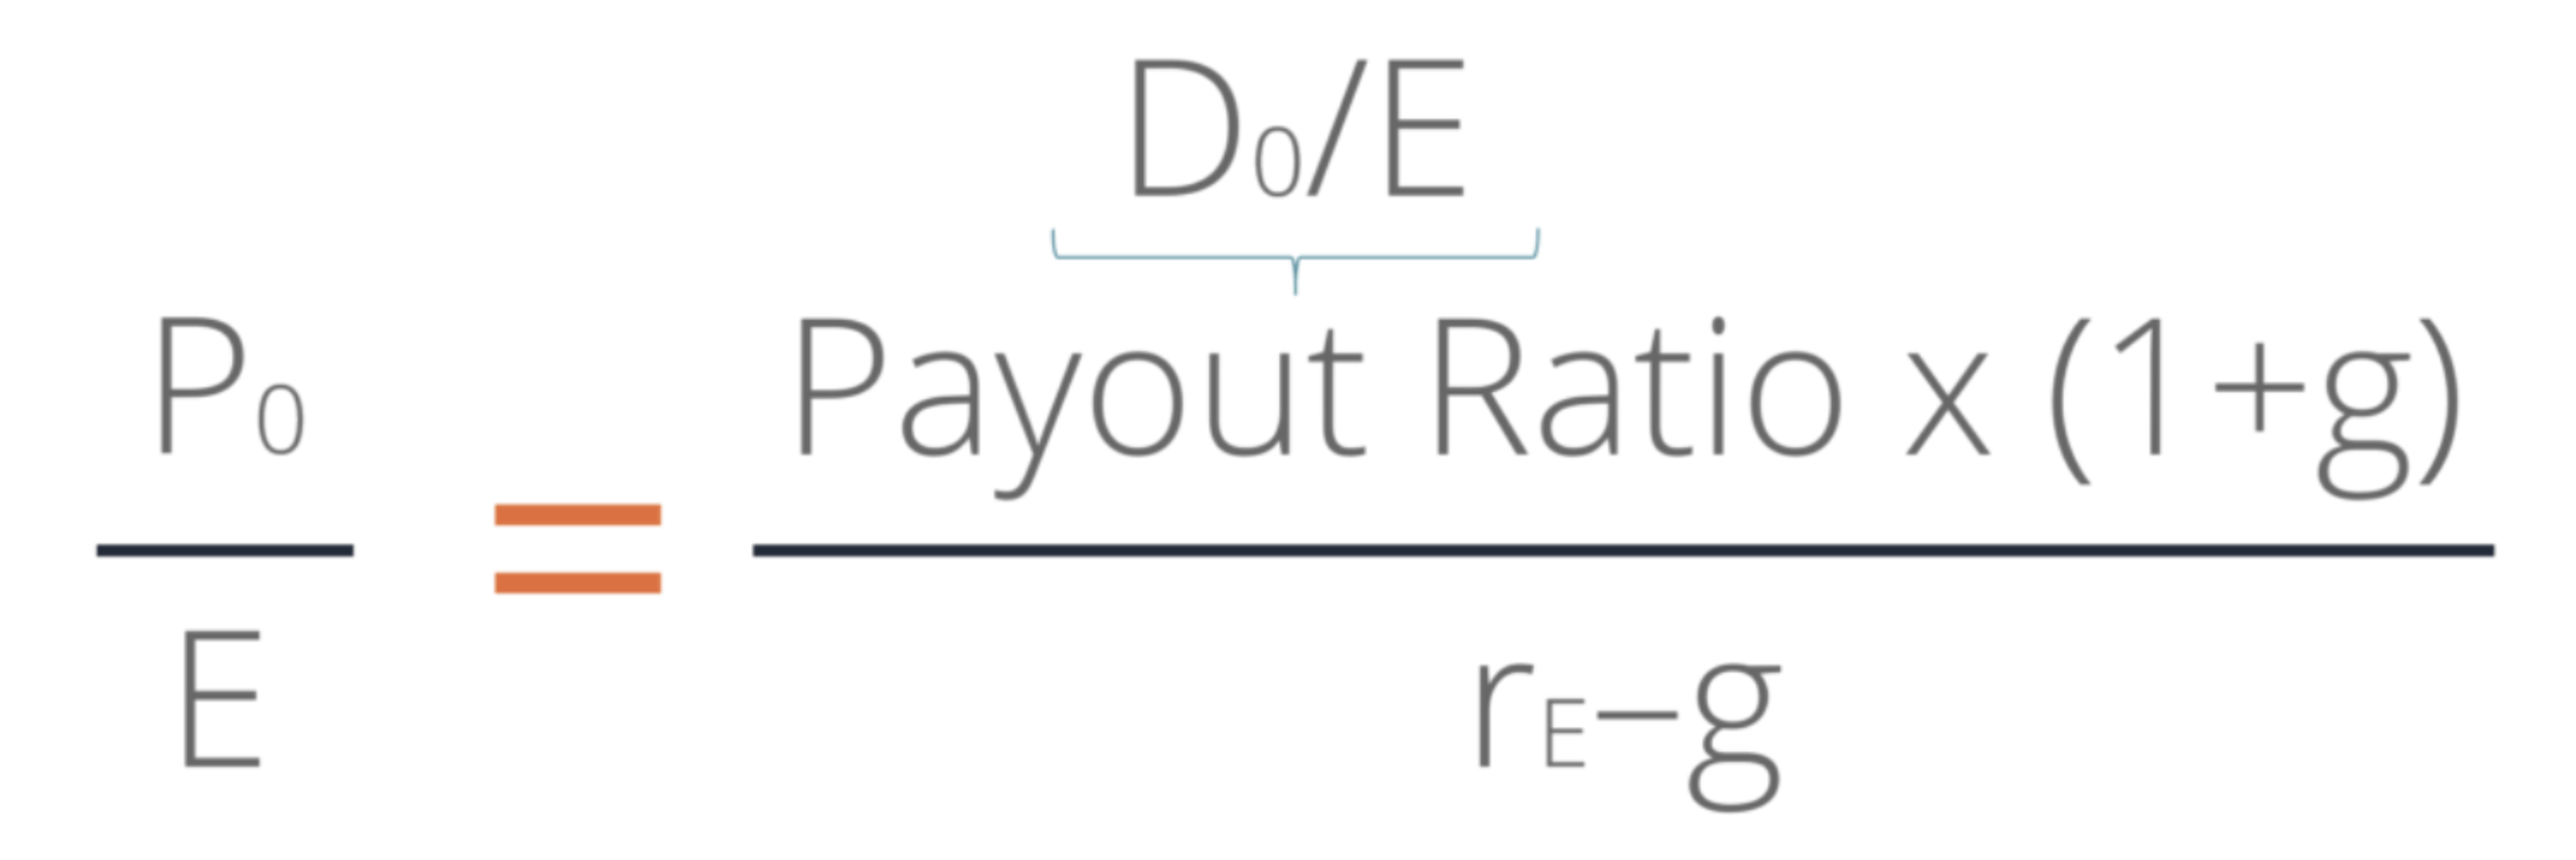
Justified P/E (corporatefinanceinstitute.com)
For this calculation, the we maintain our required rate of return assumption of 7.0%. For the estimated dividend growth rate we also keep our previously determined 3%-5% range.
The following chart and table depict the firm’s dividend payout ratios historically.
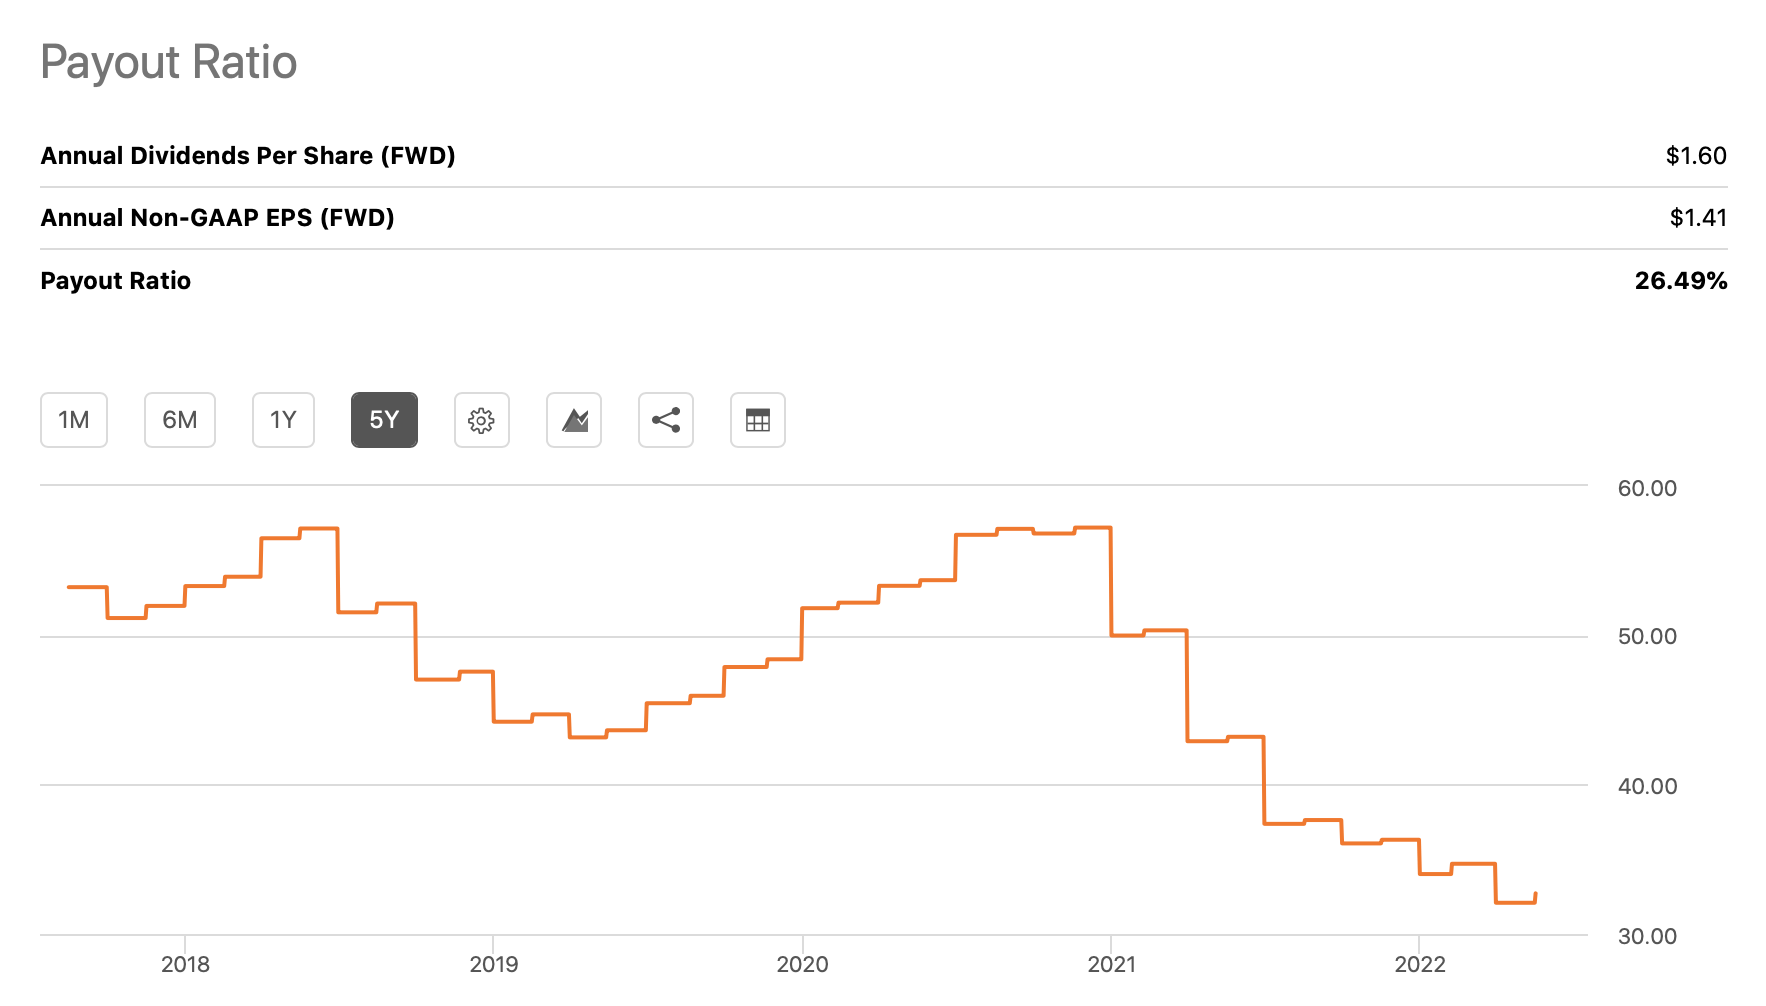
Payout ratio (Seekingalpha.com)
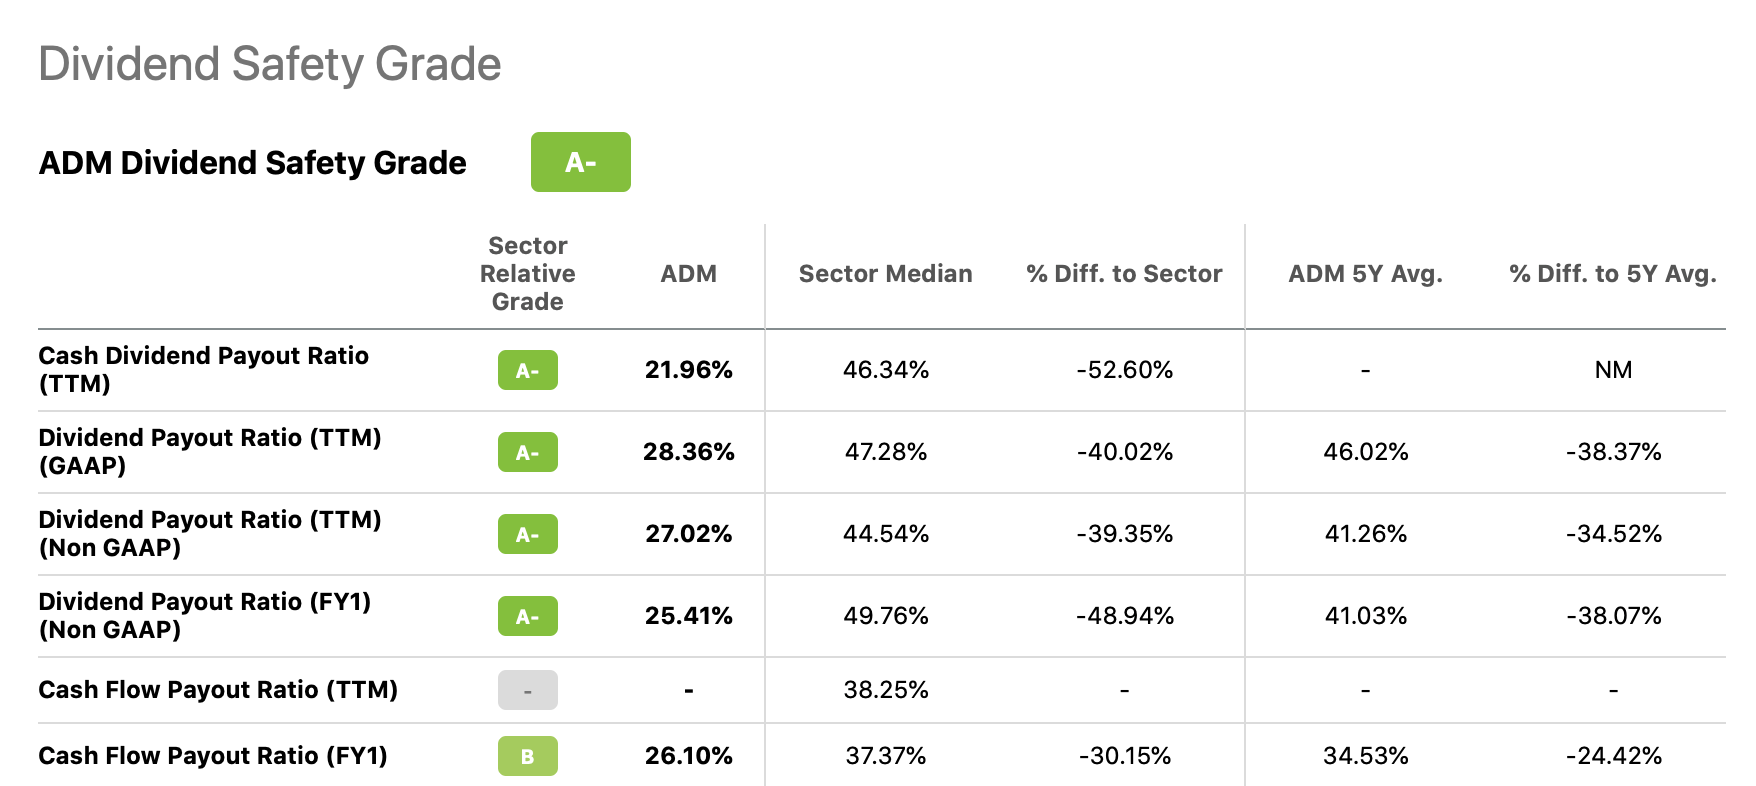
Dividend payout (Seekingalpha.com)
Based on these values, a range of 30% to 55% seems appropriate. We believe that the current payout ratio of less than 30% is a representative assumption for the long term. In our view, a more realistic assumption would be a range of 40% to 50%.
Using these assumptions, the following table summarises our results.
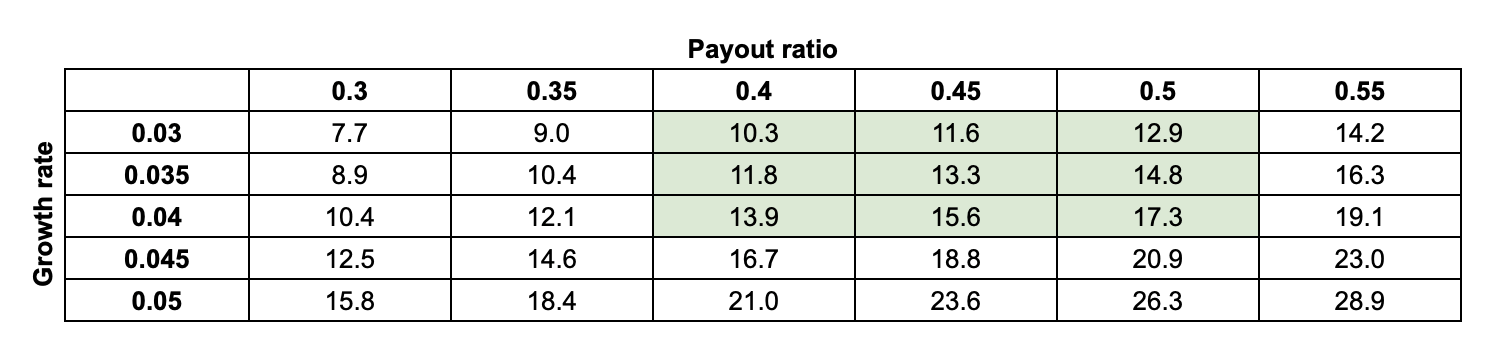
Justified P/E (Author)
As the current P/E ratio falls right in the middle of this range, we conclude that the stock is currently trading at about its fair value.
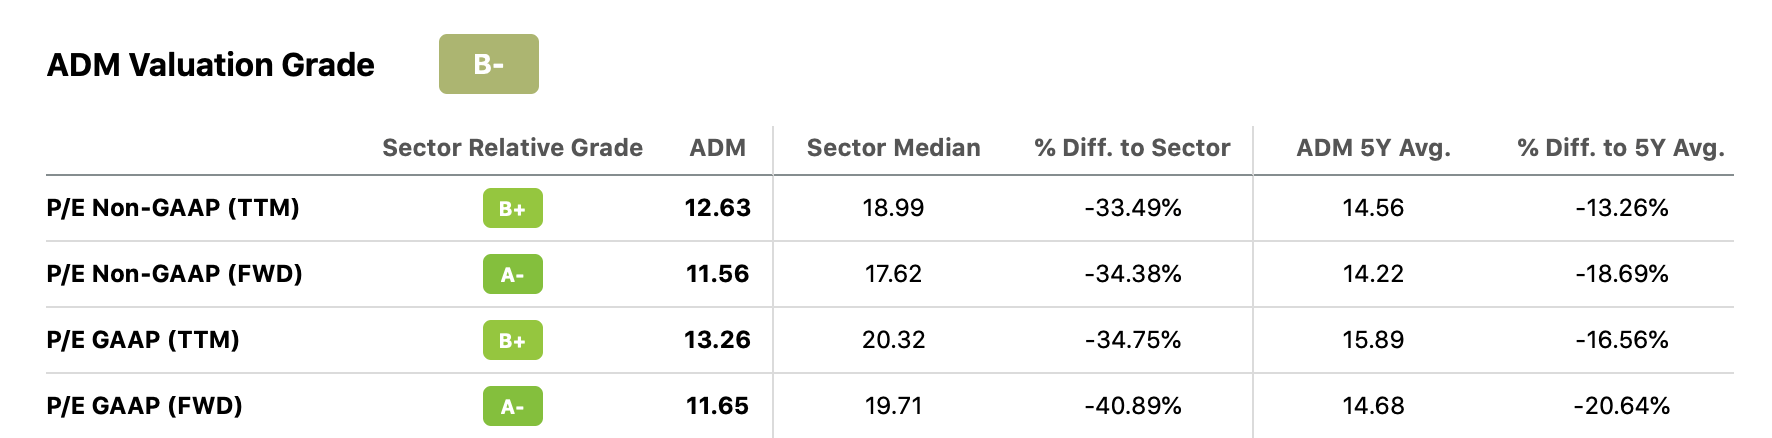
Valuation (Seekingalpha.com)
Based on these calculations, we believe that ADM’s stock does not provide significant upside potential, however it is also not overvalued.
For these reasons, we currently rate the stock as “hold”.
Key Takeaways
Based on the Gordon Growth Model, ADM’s stock appears to be trading close to its fair value at the current price levels. The justified P/E calculation also supports this finding.
ADM does not show a clear tendency of outperforming the broader market during times of low consumer confidence.
For these reasons, we believe that ADM’s stock is currently a “hold”.
Be the first to comment