

shenjun gong
Providing semiconductor manufacturing systems and display manufacturing systems, Applied Materials, Inc.’s (NASDAQ:AMAT) stock price has fallen by 43.9% as compared to its peak. We analyzed the revenue, margins and Capex to determine the intrinsic value of the company and determine if there is a mismatch with its stock price. We also calculated how much Applied Materials could benefit from the U.S. CHIPS Act subsidies.
Semiconductor Systems Drives Overall Revenue Growth in 2022
|
Segment ($ mln) |
2016 |
2017 |
2018 |
2019 |
2020 |
2021 |
|
Semiconductor Systems |
6,873 |
9,517 |
10,903 |
9,027 |
11,367 |
16,286 |
|
Growth |
38% |
15% |
-17% |
26% |
43% |
|
|
% of Revenue |
78% |
65% |
63% |
62% |
66% |
70% |
|
Applied Global Services |
589 |
3,017 |
3,754 |
3,854 |
4,155 |
5,013 |
|
Growth |
412% |
24% |
3% |
8% |
21% |
|
|
% of Revenue |
7% |
21% |
22% |
26% |
24% |
22% |
|
Display and Adjacent Markets |
1,206 |
1,900 |
2,498 |
1,651 |
1,607 |
1,834 |
|
Growth |
58% |
31% |
-34% |
-3% |
14% |
|
|
% of Revenue |
14% |
13% |
14% |
11% |
9% |
8% |
|
Corporate and Other |
157 |
103 |
98 |
76 |
73 |
130 |
|
Growth |
-34% |
-5% |
-22% |
-4% |
78% |
|
|
% of Revenue |
2% |
1% |
1% |
1% |
0% |
1% |
|
Total |
8,825 |
14,537 |
17,253 |
14,608 |
17,202 |
23,263 |
|
Growth |
65% |
19% |
-15% |
18% |
35% |
Source: Applied Materials, Khaveen Investments
To determine the company’s projected revenue, we first computed the revenue growth and % of total revenue for each segment. The 5-year average growth rate for the Applied Global Services (“AGS”) segment was the highest (93.56%). However, this was due to the segment’s growth being boosted by the substantially high growth rate in 2017 (412.22%) which we believe may be due to the semiconductor industry achieving the “highest growth rate in 14 years as of 2017” according to IHS Markit. Therefore, we excluded AGS’s 2017 metrics for all comparisons.
Hence, we arrived at a 4-year average growth rate of 13.89% by excluding the 2017 growth as we believe it is an outlier and compared it with other segments’ 5-year average growth (excluding the Corporate and Other segment). Thus, the Semiconductor Systems segment had the highest average revenue growth (5-year average of 21%) whereas the Display and Adjacent Markets had the lowest 5-year average growth (13.31%).
Additionally, in 2021, the Semiconductor Systems segment had shown the highest growth (43.27%) due to the “strong demand” as mentioned by management. However, in 2019, all segments had negative revenue growth whereas the Display and Adjacent Markets segment had the largest decrease of 36% which we believe was due to the falling LCD panel prices. In contrast, the Applied Global Services segment grew by 3% in 2019 which we believe was due to its subscription nature providing a recurring revenue. Overall, the average growth rate of all segments for the past 3-year average had been much lower than the 5-year average.
Furthermore, for the segment breakdown as % of revenue, the Semiconductor Systems segment remained the largest throughout the 6 years with 70.01% of revenue in 2021 (an increase as compared to the 2017 figure of 65.47%). Additionally, the AGS segment % of revenue increased from 20.75% to 21.55% from 2017 to 2021. In addition, the Display and Adjacent Markets segment% of the total revenue decreased from 2016.
|
Applied Materials Segments Projections ($ mln) |
2022F |
2023F |
2024F |
2025F |
2026F |
|
Semiconductor Systems |
19,707 |
23,846 |
28,855 |
34,916 |
42,250 |
|
Growth |
21% |
21% |
21% |
21% |
21% |
|
% of Revenue |
72% |
74% |
76% |
78% |
79% |
|
Applied Global Services |
5,709 |
6,502 |
7,405 |
8,434 |
9,605 |
|
Growth |
14% |
14% |
14% |
14% |
14% |
|
% of Revenue |
21% |
20% |
20% |
19% |
18% |
|
Display and Adjacent Markets |
1,697 |
1,570 |
1,452 |
1,344 |
1,243 |
|
Growth |
-7% |
-7% |
-7% |
-7% |
-7% |
|
% of Revenue |
6% |
5% |
4% |
3% |
2% |
|
Corporate and Other |
133 |
137 |
140 |
143 |
147 |
|
Growth |
2% |
2% |
2% |
2% |
2% |
|
% of Revenue |
0% |
0% |
0% |
0% |
0% |
|
Total |
27,246 |
32,055 |
37,852 |
44,836 |
53,245 |
|
Growth |
17% |
14% |
12% |
10% |
9% |
Source: Applied Materials, Khaveen Investments
We projected the revenue for each segment based on the historical growth. For the Semiconductor Systems segment, we projected it based on the 5-year average revenue growth of 21% compared to the semiconductor industry forecast (12.2% CAGR by 2029) based on Fortune Business Insights.
We then projected the Applied Global Services segment based on the 4-year average growth rate of 13.89%, as we believe the 2017 figure was an outlier. Besides that, as mentioned by the management,
the systems under the subscription agreement grew by 11% year-over-year
which is in line with our projection of 13.89% for this segment. Furthermore, we believe that the subscription basis of this segment would provide a predictable, recurring and stable revenue for the company.
For the Display and Adjacent Markets segment, as there is a huge difference between its 5-year (13%) and 3-year average growth (-7.00%), we used the 3-year average. As mentioned by the company’s management, the weakening in the
consumer demand for products like smartphones, PCs and TVs
supports our assumption for its growth forecast. Lastly, we projected the Corporate and Other segment based on the 5-year average growth of 2%. With that, we arrived at a projected total revenue of $27,246 mln in 2022 and tapered down its revenue growth for the following years by between 1% to 3% per year through 2026.
Stable Margins from 2023
Applied Materials, Khaveen Investments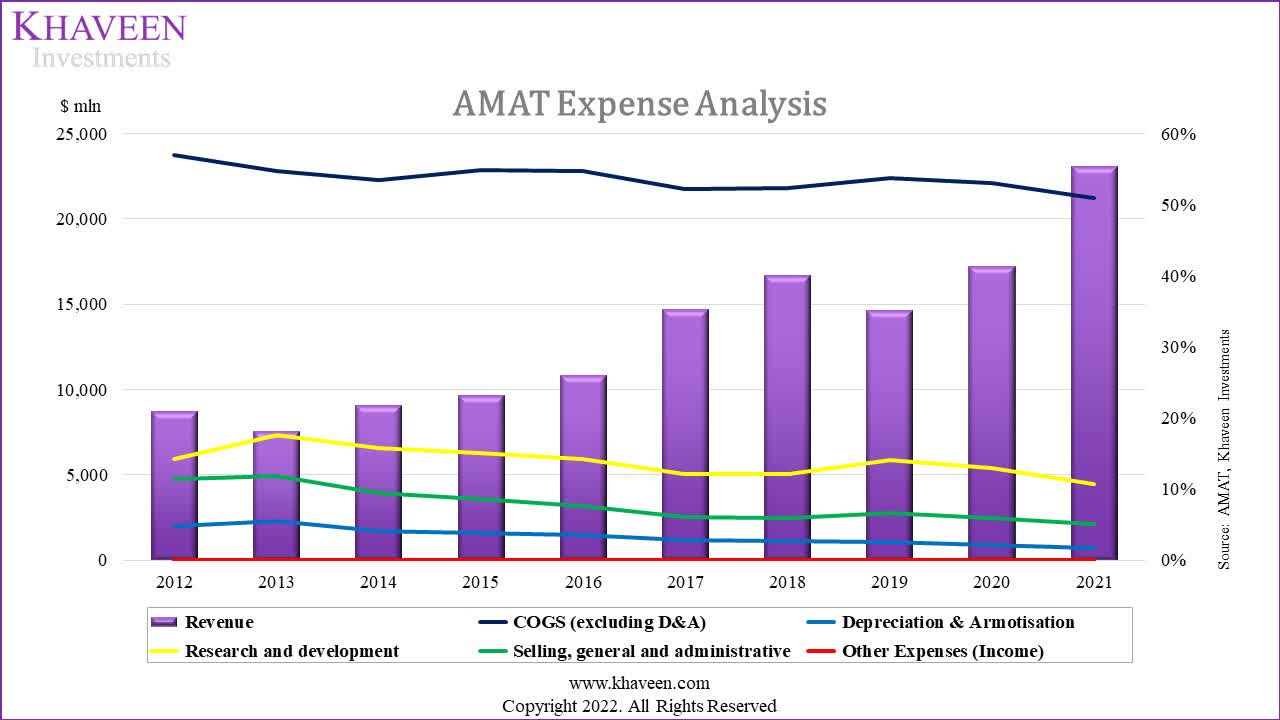
Based on the company’s expense analysis chart, the company’s COGS as a % of revenue was in decreasing trend, thus we used its latest COGS as a % of revenue for our projection. Whereas for SG&A, we used the 5-year average of 5.93% while for R&D expenses, we used the 10-year average of 13.88% as it is higher than the company’s 2021 R&D as a % of the revenue of 10.77%. We expect its R&D expenses to be higher as compared to 2021 as the company’s management mentioned that it was
adding incremental capacity at our R&D and manufacturing sites to increase longer-term efficiency and output.
However, we believe that the CHIPS Act subsidies of
US$11 billion for investment in chip research and development
could decrease the company’s R&D spending.
Applied Materials, Khaveen Investments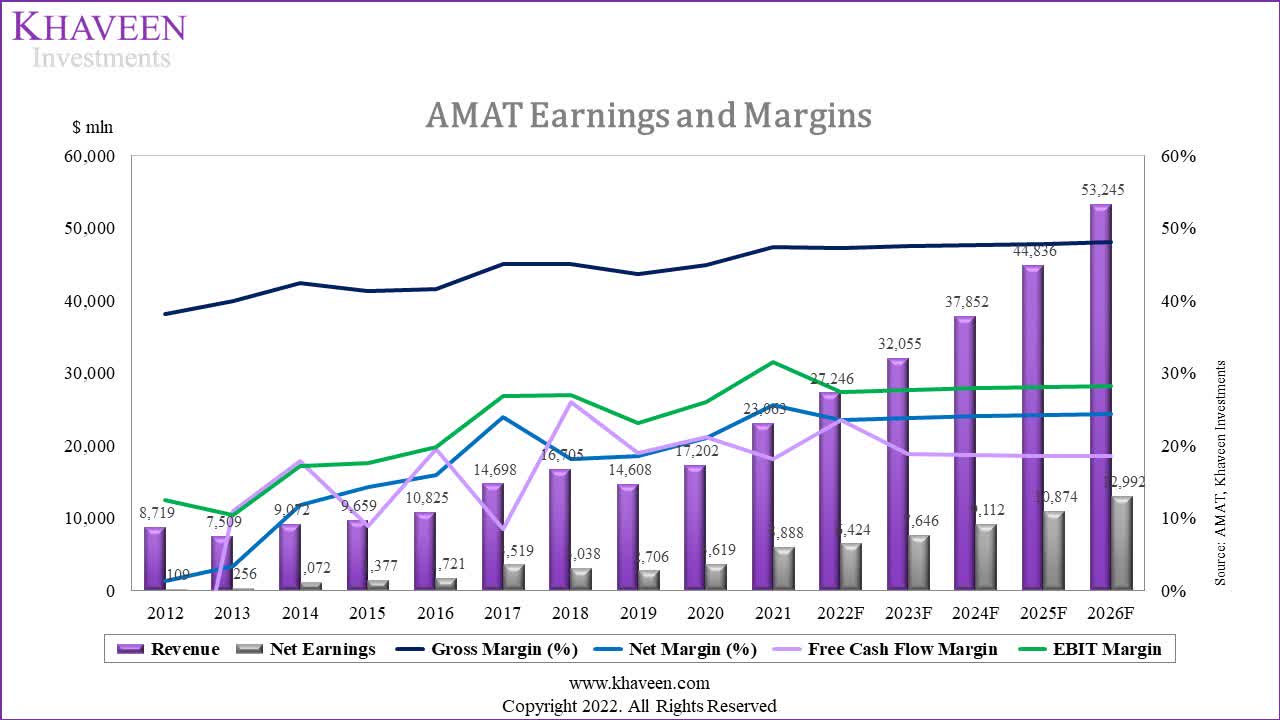
We computed the projected COGS, R&D and SG&A expenses based on the % of our revenue projection that we mentioned above. From our computation, we expect its gross margin, EBIT margin and net margin to be 47.19%, 27.38% and 23.58%, respectively, in 2022. We believe that its gross margin will remain high supported by the company’s following statement.
expect to gradually increase our gross margins beginning in Q4 through a number of actions, including pricing adjustments, manufacturing cost reductions, logistics improvements and product reengineering. – Brice Hill, Chief Financial Officer.
Beneficiary of CHIPS Act Subsidies
|
Efficiency Analysis |
2015 |
2016 |
2017 |
2018 |
2019 |
2020 |
2021 |
5-Year Average |
2-Year Average |
|
Inventory Turnover |
3.12x |
3.05x |
3.08x |
2.63x |
2.18x |
2.47x |
2.86x |
2.81x |
2.66x |
|
Days Sales Outstanding (days) |
64 |
68 |
57 |
52 |
63 |
61 |
65 |
61 |
63 |
|
Days Payables Outstanding (days) |
44 |
45 |
42 |
41 |
45 |
42 |
40 |
43 |
41 |
|
Days Inventory Outstanding (days) |
117 |
120 |
118 |
139 |
167 |
148 |
128 |
132 |
138 |
|
Cash conversion Cycle (days) |
21 |
22 |
16 |
11 |
18 |
19 |
25 |
18 |
22 |
Source: Applied Materials, Khaveen Investments
The company mentioned in its latest earnings briefing that its
backlog continues to grow and we have visibility from our customers extending into 2023 and beyond.
Hence, we analyzed the impact of the supply chain issue on the company’s efficiency. We compared Applied Materials’ latest 2-year average efficiency ratios and the pre-COVID 5-year average to determine the impact of supply constraints on the company. Based on the table above, the company’s average inventory turnover and average payable outstanding were lower during the Covid-19 period while its average days sales outstanding & days inventory outstanding was higher during the Covid-19 period. The increase in days sales outstanding and days inventory outstanding resulted in a higher cash conversion cycle (22 days as compared to 18 days). Therefore, we believe that the supply constraints had affected Applied Materials slightly.
|
Capex Analysis |
2022F |
2023F |
2024F |
2025F |
2026F |
|
Revenue ($ mln) |
27,246 |
32,055 |
37,852 |
44,836 |
53,245 |
|
Adjusted Capex/Revenue % |
2.61% |
2.61% |
2.61% |
2.61% |
2.61% |
|
Capex ($ mln) |
712 |
838 |
989 |
1,172 |
1392 |
|
Estimated additional subsidized Capex ($ mln) |
1,688 |
– |
– |
– |
– |
Source: Applied Materials, Khaveen Investments
We first obtained the company’s average adjusted Capex/Revenue % by dividing its investing cash flow excluding the acquisition and investment in marketable securities by its revenues and arrived at a 10-year average is 2.6%. We then projected the company’s Capex based on our revenue projections in the previous point. We believe the company’s Capex could increase as the company continues to expand actively.
As evidence, in December last year, the company had a joint R&D investment of $286 mln with A*Star according to The Strait Times. In May 2022, the company built a new semiconductor manufacturing center in Montana and the company reported to be considering conducting a $2.4 bln facility expansion in Hutto. However, we believe that although the company is believed to conduct active expansion, its expansion in the US such as Montana may be partially subsidized by the CHIPS Act. Under the act, there are
US$2 billion of subsidies for the US chip industry and US$11 billion for investment in chip research and development.
We then calculated our estimated subsidized Capex of $1,688 mln by subtracting the expected $2.4 bln expansion in Hutto and our 2022 projected Capex ($712 mln).
Risk: High Customer Concentration
As stated in its annual report, Samsung Electronics (OTCPK:SSNLF) accounts for 20% of its revenue. Hence, we believe that the high customer revenue concentration could pose a risk to the company as its revenue would be largely impacted by the loss of its major customers such as Samsung.
Verdict
We valued the company with a discounted cash flow (“DCF”) as we continue to expect the company to generate positive free cash flows (“FCFs”) with a forward 3-year margin of 20.31%. For the terminal value, we based it on the average semiconductor equipment manufacturing industry EV/EBITDA of 14.05x.
SeekingAlpha, Khaveen Investments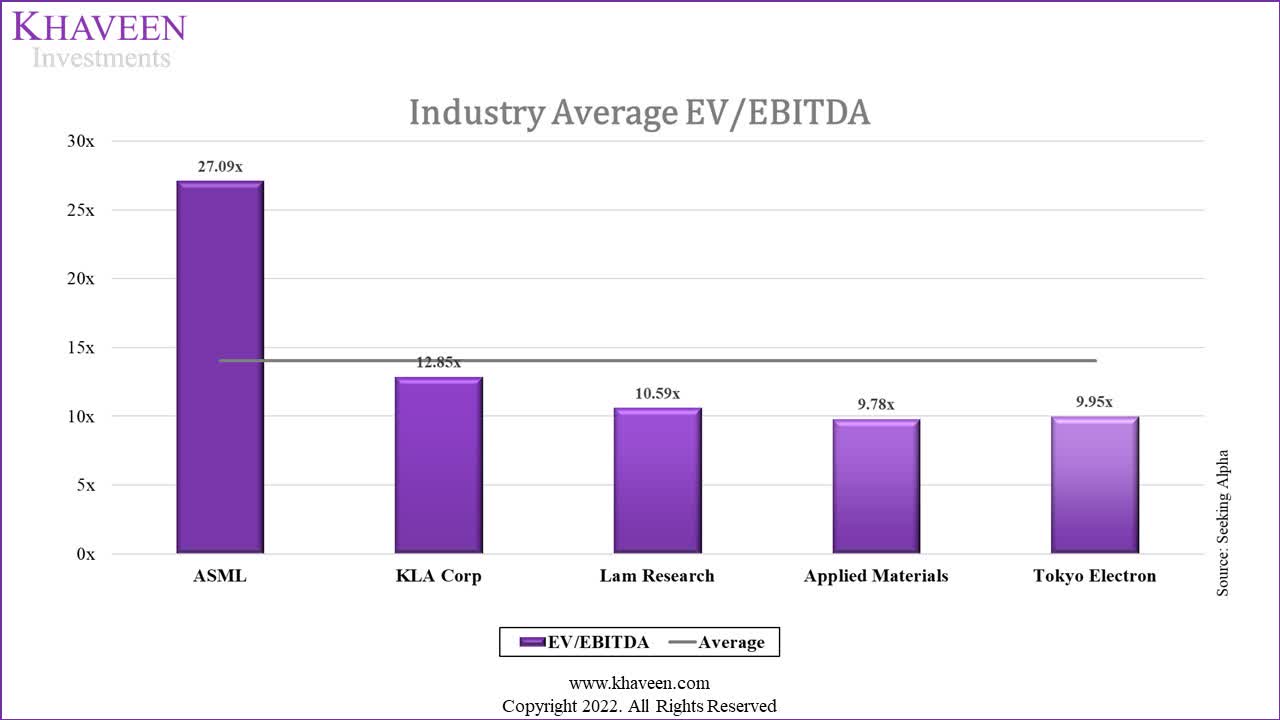
Based on a discount rate of (10.6%), our model shows AMAT’s shares are undervalued by 106%.
Khaveen Investments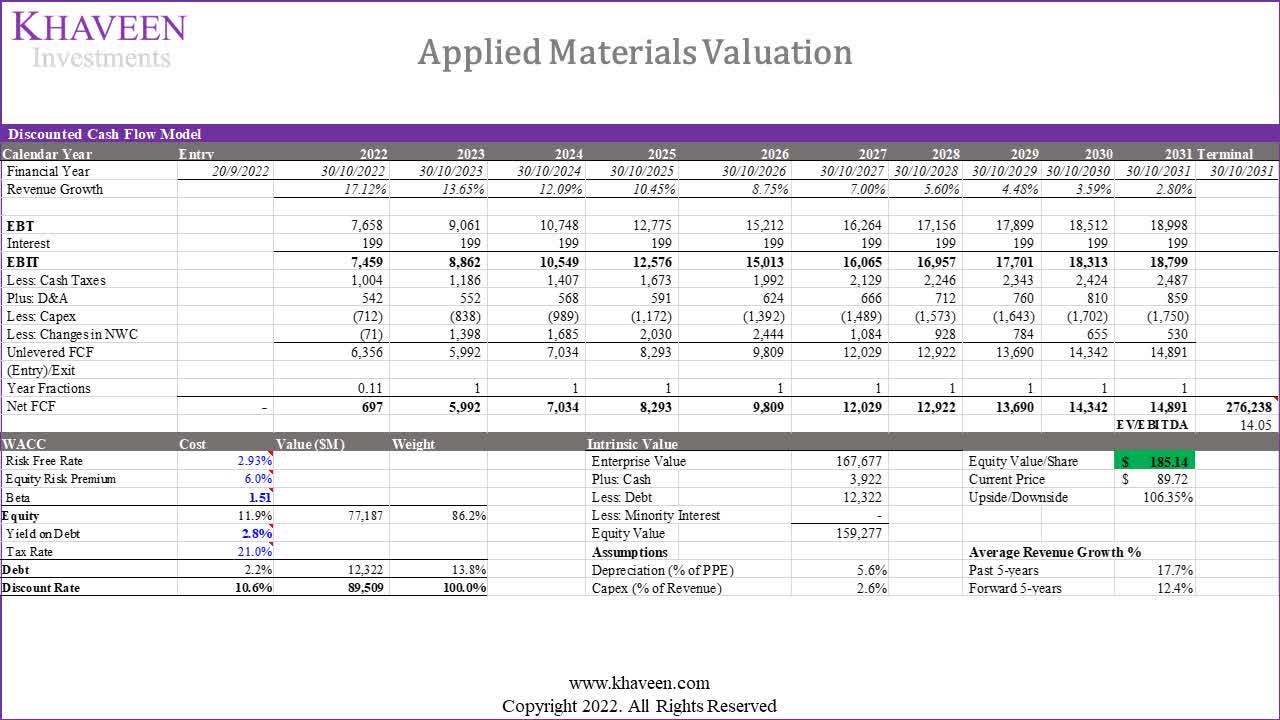
To conclude, we projected Applied Material’s total revenue of $27,246 mln in 2022 which represents a growth rate of 17% but tapering down beyond that. Furthermore, in terms of margins, we modeled its gross margin, EBIT margin and net margin to be 47.19%, 27.38% and 23.58% respectively in 2022 but expect its long-term margins to remain stable. Additionally, we believe that Applied Materials would benefit from the CHIPS Act subsidies and we estimated subsidized Capex of $1,688 mln for its expansions in 2022.
Overall, we revised our rating from Buy to Strong Buy for Applied Materials with a target price of $185.14 which represents a 106% upside and is higher as compared to our previous analysis ($135.25). We believe that the higher upside is also due to the decline of its share price YTD of 43.9% and its lower EV/EBITDA ratio compared to its competitors of 9.78x compared to 14.05x which is also below its 5-year average of 13.43x.
Be the first to comment