

Shahid Jamil
Introduction
Apple is the largest company in the world, with a $2 trillion-plus market cap. They participate in the hardware phone industry, computer, and other related services. Apple’s global market share has been stable over the years against Asian competitors. Apple’s premium pricing also makes their hardware the most expensive in the industry. Will it maintain its profit margin with high inflation and dropping global demand?
Fundament shows market cap strength but drops profit margin
Ratios
The current and quick ratios over the last five years have been dropping, which is quite surprising for a company like Apple based on its size.
|
Unnamed: 0 |
2018 |
2019 |
2020 |
2021 |
2022 |
|
Period |
FY |
FY |
FY |
FY |
FY |
|
Current ratio |
1.124 |
1.540 |
1.364 |
1.075 |
0.879 |
|
Quick ratio |
0.987 |
1.384 |
1.218 |
0.910 |
0.709 |
|
Cash ratio |
0.222 |
0.462 |
0.361 |
0.278 |
0.154 |
Source: Financial Modelling Prep
Growth
Revenue growth and gross profit have been mixed over the last five years. Only net income growth was strong for Apple in 2021. This should be a big concern for long-term Apple investors. Is this due to a slowdown in iPhone sales? Or are they too expensive for most people in this highly inflationary world?
|
Unnamed: 0 |
2018 |
2019 |
2020 |
2021 |
2022 |
|
Period |
FY |
FY |
FY |
FY |
FY |
|
Revenue growth |
0.159 |
-0.020 |
0.055 |
0.333 |
0.078 |
|
Gross profit growth |
0.155 |
-0.034 |
0.067 |
0.456 |
0.117 |
|
Ebit growth |
0.156 |
-0.098 |
0.037 |
0.644 |
0.096 |
|
Operating income growth |
0.156 |
-0.098 |
0.037 |
0.644 |
0.096 |
|
Net income growth |
0.231 |
-0.072 |
0.039 |
0.649 |
0.054 |
|
Eps growth |
0.296 |
-0.003 |
0.106 |
0.713 |
0.085 |
Source: Financial Modelling Prep
Enterprise Value
The share price nearly doubled between 2019 and 2021. Also, the stock price growth has almost risen 50% since then. Market capitalization has more than doubled over the last five years, showing excessive growth. The question of concern is the profitability of Apple in general over the years.
|
Unnamed: 0 |
2018 |
2019 |
2020 |
2021 |
2022 |
|
Symbol |
AAPL |
AAPL |
AAPL |
AAPL |
AAPL |
|
Stock price |
53.060 |
62.263 |
115.050 |
148.640 |
149.450 |
|
Number of shares |
19.822 B |
18.471 B |
17.352 B |
16.701 B |
16.216 B |
|
Market capitalization |
1.052 T |
1.150 T |
1.996 T |
2.482 T |
2.423 T |
|
Add total debt |
114.483 B |
108.047 B |
112.436 B |
124.719 B |
120.069 B |
|
Minus cash and cash equivalents |
25.913 B |
48.844 B |
38.016 B |
34.940 B |
23.646 B |
|
Enterprise value |
1.140 T |
1.209 T |
2.071 T |
2.572 T |
2.520 T |
Source: Financial Modelling Prep
Estimates
Regarding forward guiding estimates, revenues will remain strong over the next six years. Dividend growth is expected to remain flat, but how will it affect the long-term stock price of Apple? EBITDA will continue to strengthen over the next six years. The concerning question about Apple is profitability and its impact on its stock price. Seeing such growth from a $2+ trillion market cap is impressive, but is it sustainable?
|
YEARLY ESTIMATES |
2022 |
2023 |
2024 |
2025 |
2026 |
2027 |
|
Revenue |
392,777 |
407,094 |
430,401 |
448,581 |
502,151 |
565,588 |
|
Dividend |
0.91 |
0.99 |
1.05 |
1.15 |
1.03 |
1.06 |
|
Dividend Yield (in %) |
0.66 % |
0.72 % |
0.76 % |
0.84 % |
0.75 % |
0.77 % |
|
EPS |
6.10 |
6.25 |
6.83 |
7.11 |
7.96 |
8.20 |
|
P/E Ratio |
22.52 |
21.98 |
20.10 |
19.30 |
17.25 |
16.74 |
|
EBIT |
119,031 |
118,745 |
125,307 |
129,182 |
144,326 |
– |
|
EBITDA |
130,905 |
130,761 |
137,379 |
142,184 |
158,798 |
175,329 |
Source: BusinessInsider
Technical Analysis Show Now Strong Current Momentum
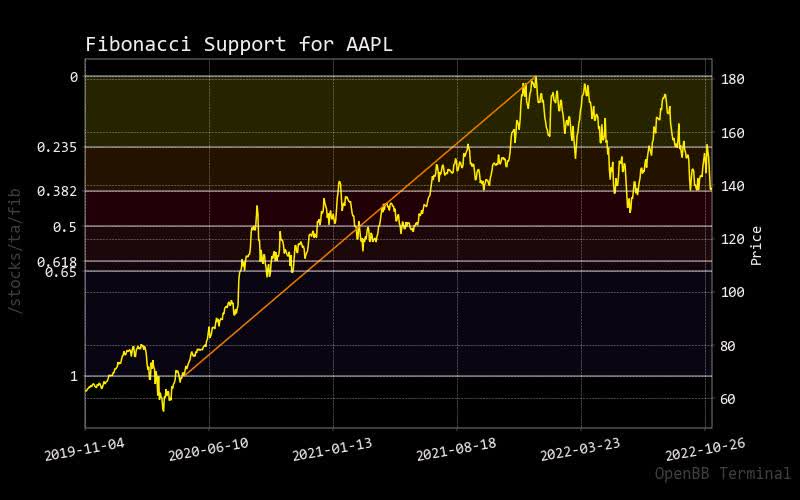
Fibonacci
The Fibonacci trendline peaked roughly last year while Apple stock price was in rangebound. Apple has not collapsed in stock price compared to other big tech companies, which shows how well the product line has been tightly managed.
fibonacci apple (custom platform)
Bollinger Bands
There is only a little to say here about Bollinger Bands other than that Apple’s stock price appears to be pushing toward the upper band. This could easily hint towards a potential short-term increase in Apple’s share price.

bollinger apple (custom platform)
MACD
MACD line shows that the compressed stock price of Apple has been rangebound between $100 and $150. Will the momentum return to the share price of Apple?
With the most recent activity on the zero line, you can easily see that price declined as momentum was not strong enough to sustain a stock price increase.

macd apple (custom platform)
RSI
Like the MACD chart, the RSI has had similar moves, whereas the share price is currently approaching oversold. If momentum returns to the USA market indices, one can expect Apple stock price should continue to build. When you compare other technology companies, Apple has somewhat underperformed to certain ones but, as said, has not collapsed in stock price.

rsi apple (custom platform)
Prediction via AI
Monte Carlo
This Monte Carlo simulation does show a potential 30% return in price with a higher probability of predicted paths. On the other hand, in the normalized distribution chart, there is a higher likelihood of stock price expectation with a potential 20% (on average) increase.

monte carlo apple (custom platform)
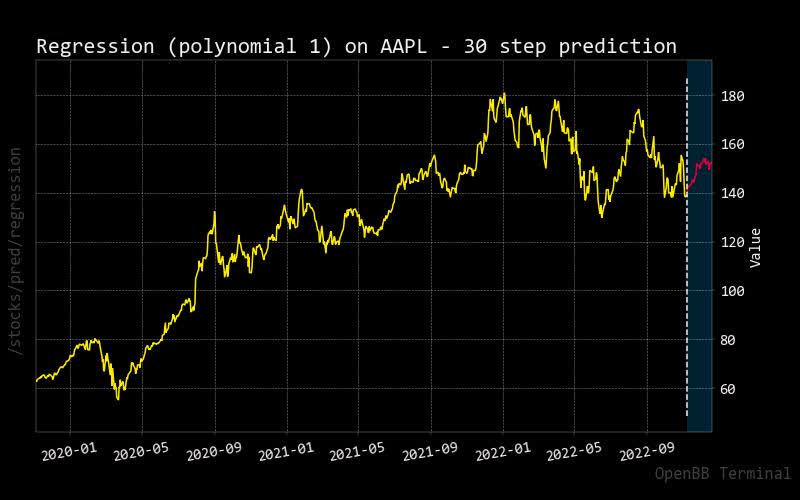
Regression
With regression analysis, the red line over the next 30 days shows that Apple stock price may stay rangebound during this period.
regression apple (custom platform )
Risk shows clear uncertainty
Price vs. Short Volume
There appears to be no shorting concern as it is below 50% of the total trading volume. This has been historically the same since the summer of this year.
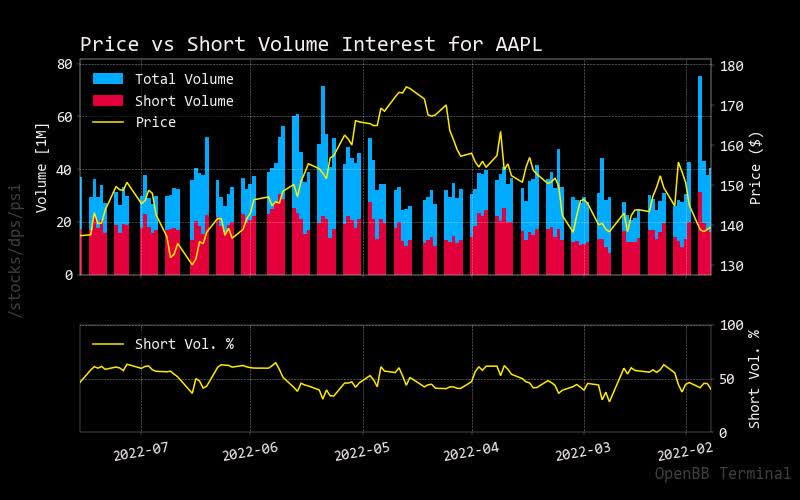
shorting apple (custom platform )
Source: StockGrid
Insider
Insider Stats
As Apple executives continue to sell the stock, this only confirms that stock prices may continue to fall as global markets weaken. This is another way of saying that global demand for Apple products is either overpriced or just dropping in this rising inflation world.
|
Unnamed: 0 |
X |
Filing Date |
Trading Date |
Ticker |
Insider |
Title |
Trade Type |
Price |
Quantity |
Owned |
Delta Own |
Value |
|
0 |
nan |
2022-11-01 18:30:34 |
2022-10-28 |
APPL |
Maestri Luca |
SVP, CFO |
S – Sale |
$155.95 |
-176,299 |
110,673 |
-61% |
-$27,493,275 |
|
1 |
D |
2022-10-18 18:33:15 |
2022-10-17 |
APPL |
O’Brien Deirdre |
SVP |
S – Sale+OE |
$142.45 |
-8,053 |
136,290 |
-6% |
-$1,147,150 |
|
2 |
D |
2022-10-04 22:05:07 |
2022-10-03 |
APPL |
O’Brien Deirdre |
SVP |
S – Sale+OE |
$142.16 |
-176,299 |
136,290 |
-56% |
-$25,062,882 |
|
3 |
D |
2022-10-04 22:02:25 |
2022-10-03 |
APPL |
Adams Katherine L. |
SVP, GC, Secretary |
S – Sale+OE |
$141.41 |
-181,139 |
427,334 |
-30% |
-$25,615,117 |
|
4 |
A |
2022-08-22 18:43:18 |
2022-08-17 |
APPL |
Maestri Luca |
SVP, CFO |
S – Sale |
$174.96 |
-96,735 |
110,673 |
-47% |
-$16,924,259 |
|
5 |
nan |
2022-08-19 18:30:27 |
2022-08-17 |
APPL |
Maestri Luca |
SVP, CFO |
S – Sale |
$174.96 |
-96,735 |
110,673 |
-47% |
-$16,924,259 |
|
6 |
nan |
2022-08-05 18:30:49 |
2022-08-03 |
APPL |
Adams Katherine L. |
SVP, GC, Secretary |
S – Sale |
$164.77 |
-25,000 |
427,334 |
-6% |
-$4,119,155 |
Source: Open Insider
Insider Activity
|
Date |
Shares Traded |
Shares Held |
Price |
Type |
Option |
Insider |
Trade |
|
2022-09-30 |
365,600.00 |
476,273.00 |
nan |
Buy |
No |
Maestri Luca |
365600.0 |
|
2022-09-30 |
365,600.00 |
501,890.00 |
nan |
Buy |
No |
Maestri Luca |
365600.0 |
|
2022-09-30 |
177,870.00 |
677,392.00 |
138.2 |
Sell |
No |
Maestri Luca |
-177870.0 |
|
2022-09-30 |
189,301.00 |
286,972.00 |
138.2 |
Sell |
No |
Maestri Luca |
-189301.0 |
|
2022-09-30 |
184,461.00 |
608,473.00 |
138.2 |
Sell |
No |
O’BRIEN DEIRDRE |
-184461.0 |
|
2022-09-30 |
189,301.00 |
312,589.00 |
138.2 |
Sell |
No |
O’BRIEN DEIRDRE |
-189301.0 |
|
2022-09-30 |
365,600.00 |
792,934.00 |
nan |
Buy |
No |
KONDO CHRIS |
365600.0 |
|
2022-10-02 |
5,400.00 |
603,073.00 |
138.44 |
Sell |
No |
O’BRIEN DEIRDRE |
-5400.0 |
|
2022-10-02 |
13,199.00 |
589,874.00 |
139.15 |
Sell |
No |
KONDO CHRIS |
-13199.0 |
|
2022-10-02 |
27,669.00 |
562,205.00 |
140.34 |
Sell |
No |
O’BRIEN DEIRDRE |
-27669.0 |
|
2022-10-02 |
56,271.00 |
505,934.00 |
141.19 |
Sell |
No |
O’BRIEN DEIRDRE |
-56271.0 |
|
2022-10-02 |
65,350.00 |
440,584.00 |
142.45 |
Sell |
No |
O’BRIEN DEIRDRE |
-65350.0 |
|
2022-10-02 |
13,250.00 |
427,334.00 |
142.93 |
Sell |
No |
Adams Katherine L. |
-13250.0 |
|
2022-10-02 |
66,880.00 |
203,316.00 |
142.17 |
Sell |
No |
Adams Katherine L. |
-66880.0 |
|
2022-10-02 |
67,026.00 |
136,290.00 |
142.83 |
Sell |
No |
Adams Katherine L. |
-67026.0 |
|
2022-10-02 |
42,393.00 |
270,196.00 |
141.09 |
Sell |
No |
Adams Katherine L. |
-42393.0 |
|
2022-10-14 |
13,136.00 |
58,104.00 |
nan |
Buy |
No |
Adams Katherine L. |
13136.0 |
|
2022-10-14 |
16,612.00 |
152,902.00 |
nan |
Buy |
No |
Adams Katherine L. |
16612.0 |
|
2022-10-14 |
6,399.00 |
51,705.00 |
138.38 |
Sell |
No |
O’BRIEN DEIRDRE |
-6399.0 |
|
2022-10-14 |
8,559.00 |
144,343.00 |
138.38 |
Sell |
No |
Adams Katherine L. |
-8559.0 |
|
2022-10-16 |
8,053.00 |
136,290.00 |
142.45 |
Sell |
No |
Maestri Luca |
-8053.0 |
|
2022-10-27 |
14,274.00 |
272,698.00 |
154.7 |
Sell |
No |
WILLIAMS JEFFREY E |
-14274.0 |
|
2022-10-27 |
85,147.00 |
187,551.00 |
155.63 |
Sell |
No |
O’BRIEN DEIRDRE |
-85147.0 |
|
2022-10-27 |
69,678.00 |
117,873.00 |
156.46 |
Sell |
No |
Adams Katherine L. |
-69678.0 |
|
2022-10-27 |
7,200.00 |
110,673.00 |
157.2 |
Sell |
No |
Maestri Luca |
-7200.0 |
Source: BusinessInsider
Recommendations
Recommendations show that most analysts indicate neutral calls, which I agree with. There seems to be no collapse in Apple’s share price, but again, if markets rise, Apple may underperform in the short run. This should improve once inflation dies off, when people will begin to buy overpriced Apple products again.
|
Interval |
RECOMMENDATION |
BUY |
SELL |
NEUTRAL |
|
One month |
SELL |
5 |
13 |
8 |
|
One week |
NEUTRAL |
9 |
7 |
10 |
|
One day |
NEUTRAL |
9 |
8 |
9 |
Source: Trading View
Conclusion
Apple has been a reasonably impressive stock performer over the years; it is also remarkable how this company can maintain its market cap. As shown in the fundamentals, there should be concerns about profitability dropping with a lower margin. Despite the company’s growth over the next five to six years, investors should ask themselves how this will impact their long-term profitability and Apple share price. Will there be a better hardware manufacturer for both phones and computers that will continue to eat into Apple’s market share? Or will they be a general commoditization of the industries Apple is currently involved with? There is also an understanding of how Apple is diversifying into other product lines of health through its services division and a new car to compete in the automobile industry. If this happens, Apple will continue to grow with diversified new product revenue. As for now, Apple should remain on hold but will return to a buy once inflation and weak global demand pass.
Be the first to comment