

Spencer Platt
Introduction
Houston-based APA Corporation (NASDAQ:APA) released its second quarter of 2022 results on August 3, 2022.
Note: I have followed APA quarterly since 2017 with 25 articles and counting. This new article is a quarterly update of my article published on January 24, 2022.
Also, on August 23, 2022, Apache Corporation announced the first discovery in Block 53 Offshore Suriname and provided an update on Block 58 Operations.
Baja-1 was drilled to a depth of 5,290 meters (17,356 feet) and encountered 34 meters (112 feet) of net oil pay in a single interval within the Campanian. Preliminary fluid and log analysis indicates light oil with a gas-oil ratio (GOR) of 1,600 to 2,200 standard cubic feet per barrel, in good quality reservoir.
Apache Corp. owns producing assets in the US and the North Sea, Egypt. Also, the company is involved with two blocks in Suriname.
APA Map assets location Presentation (Apache Corp)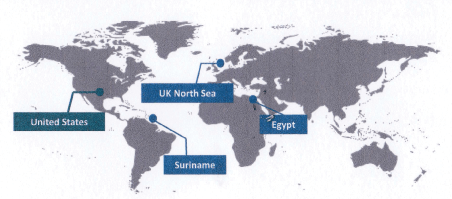
1 – 2Q22 results snapshot
During the second quarter of 2022, APA reported a net income attributable to common stock of $926 million, or $2.71 per share, on a fully diluted basis. When adjusted for certain items that impact the comparability of results, APA’s second quarter earnings totaled $811 million or $2.37 on a diluted share.
APA highlights 2Q22 (Apache Corp)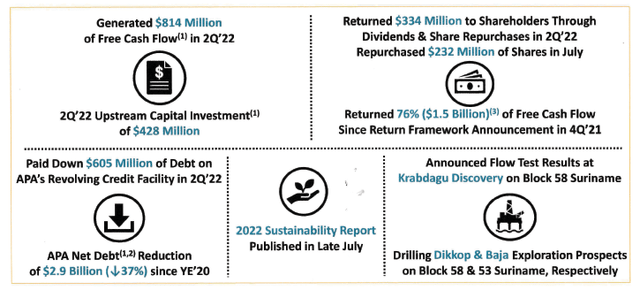
The net cash provided by operating activities was $1,535 million, and adjusted EBITDAX was $1,957 million in 2Q22. Total Production was 384.6K Boepd in 2Q22.
APA 2Q22 metrics Presentation (Apache Corp)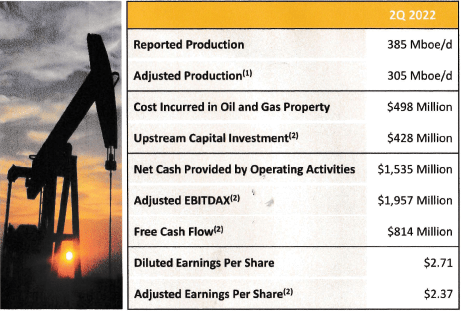
CEO John Christmann said in the conference call:
the pullback in oil prices from the second quarter peak is healthy for both consumers and producers. We continue to have a positive outlook on the long-term fundamentals for natural gas and oil and view APA stock as a compelling value today.
2 – Stock performance
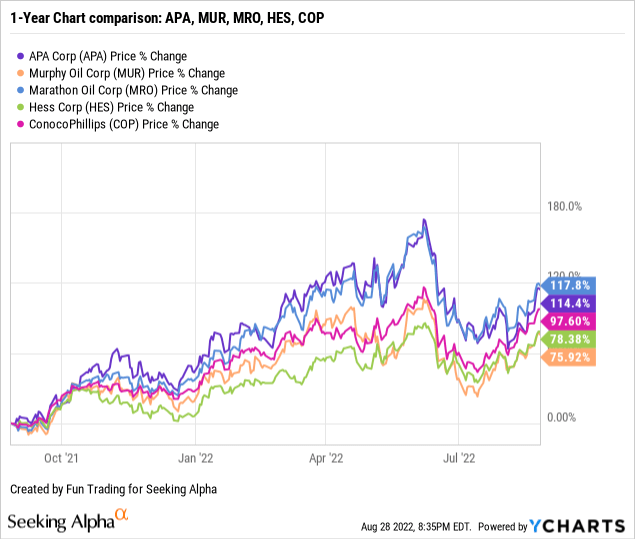
Let’s compare APA to a few other E&P oil and gas companies (e.g., Murphy Oil (MUR), Hess Corp. (HES), ConocoPhillips (COP) or Marathon Oil (MRO), etc.).
We can see that APA has followed the group and is up 114% on a one-year basis, down from a recent peak in June.
Balance sheet and production history for 2Q22: The raw numbers
| APA | 2Q21 | 3Q21 | 4Q21 | 1Q22 | 2Q22 |
| Revenues from oil and gas in $ billion | 1.756 | 2.059 | 2.299 | 2.669 | 3.047 |
| Total Revenues and others in $ Billion | 1.782 | 1.651 | 2.403 | 3.828 | 3.052 |
| Net Income in $ Billion | 0.340 | -0.083 | 0.471 | 1.813 | 0.926 |
| EBITDA $ Billion | 0.95 | 0.56 | 1.08 | 2.68 | 1.81 |
| EPS diluted in $/share | 0.82 | -0.30 | 1.05 | 5.43 | 2.71 |
| Cash from Operating activities in $ Million | 969 | 771 | 1,085 | 891 | 1,535 |
| CapEx in $ Million | 306 | 236 | 315 | 379 | 388 |
| Free Cash Flow in $ Million | 663 | 535 | 770 | 512 | 1,147 |
| Total cash $ Billion | 1.25 | 0.38 | 0.30 | 0.23 | 0.28 |
| Total LT Debt in $ Billion | 8.64 | 7.41 | 7.51 | 5.89 | 5.29 |
| Dividend per share in $ | 0.025 | 0.025 | 0.125 | 0.125 | 0.125 |
| Shares outstanding (diluted) in Million | 379 | 379 | 363 | 347 | 342 |
| Oil Production | 2Q21 | 3Q21 | 4Q21 | 1Q22 | 2Q22 |
| Total Oil Equivalent in K Boepd | 395.2 | 389.0 | 385.6 | 404.0 | 384.6 |
| International | 153.7 | 151.5 | 187.6 | 193.1 | 184.4 |
| USA | 241.5 | 237.5 | 228.0 | 211.0 | 200.3 |
| Global liquid price ($/Boe) | 66.40 | 71.72 | 78.52 | 100.23 | 113.79 |
| Global Natural gas price ($/MMBtu) | 2.99 | 3.87 | 4.95 | 4.70 | 5.65 |
Source: Company filing
Note: historical data since 2015 are only available to the Gold and Oil Corner subscribers.
Analysis: Revenues, Earnings Details, Free Cash Flow, And Oil Production
1 – Revenues and others were $3,052 million in 2Q22
APA Quarterly Revenues history (Fun Trading)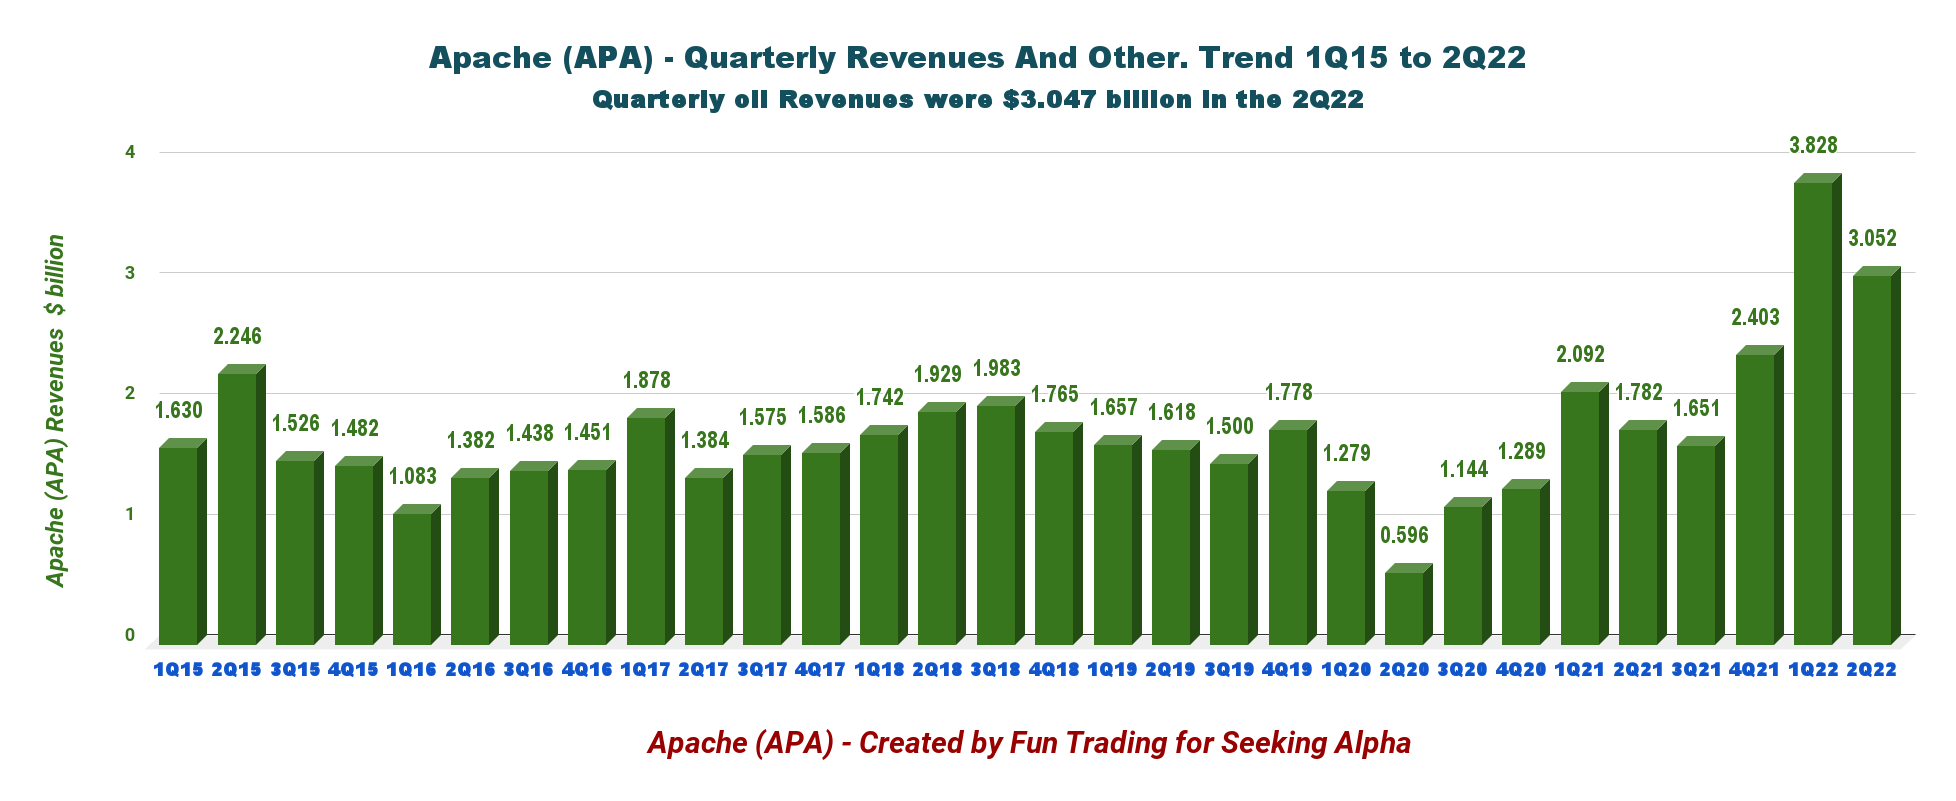
2Q22 total revenues and others were $3.052 billion (with oil revenues of $3.047 billion), up from $1.756 billion the same quarter a year ago.
One crucial positive element is that the global liquid price jumped again to a record of $113.79 per barrel in 2Q22 compared to $66.40 in 4Q21, as shown in the chart below.
APA Quarterly price oil and NG (Fun Trading)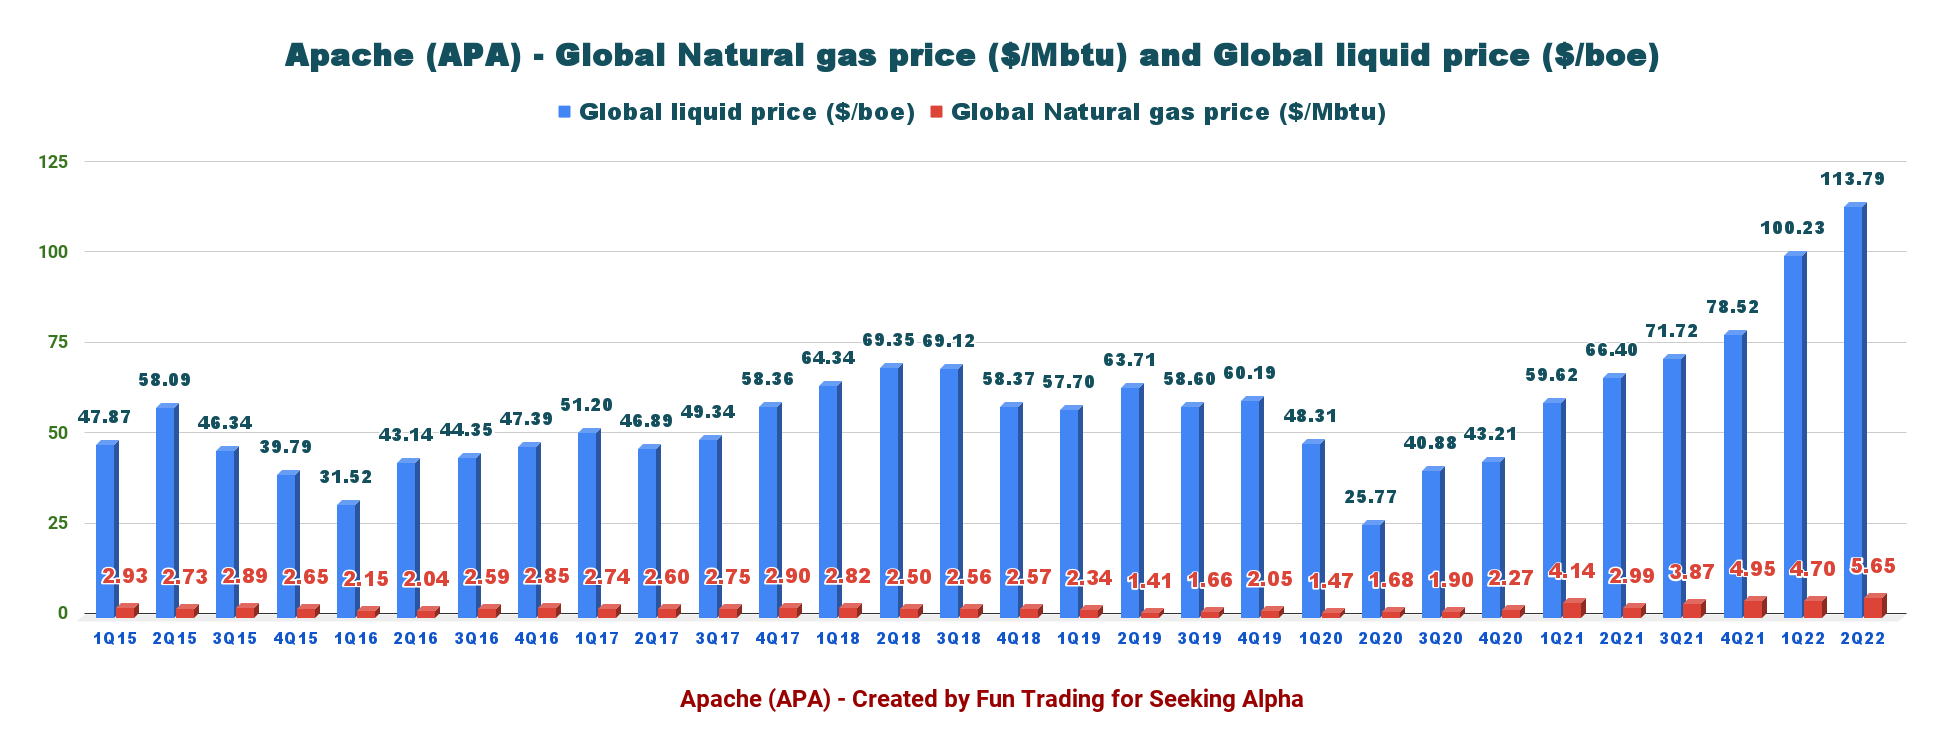
2 – Free cash flow was a gain of $1,147 million in 2Q22
APA Quarterly Free cash flow history (Fun Trading)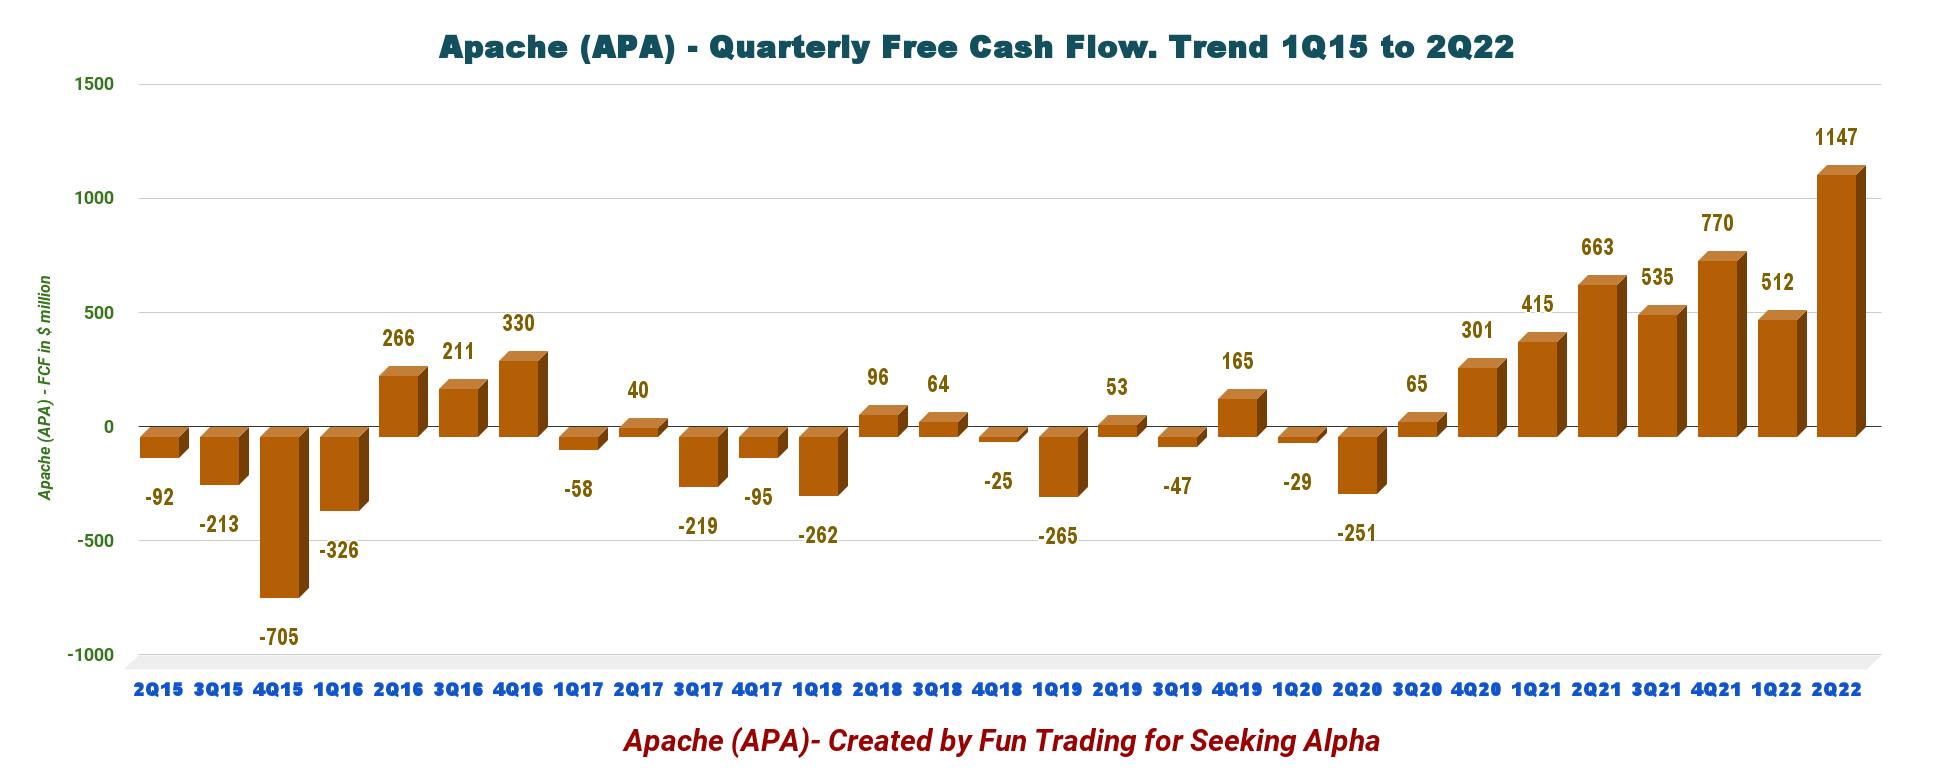
Trailing 12-month free cash flow is now $2,963 million, with a free cash flow of $1,147 million for the second quarter.
APA repurchased 7 million shares of common stock during the quarter at an average price of $41.59 per share. Also, APA has repurchased 45.4 million shares since October 2021 at an average of $30.78.
Details are indicated below:
APA Dividend and Share buyback (Apache Corp)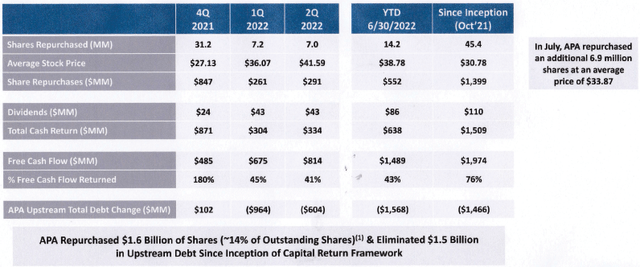
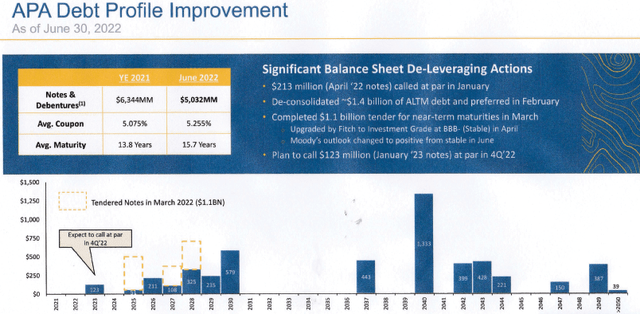
3 – Net debt dropped significantly to $5.0 billion in 2Q22
APA Quarterly Cash versus Debt history (Fun Trading) APA was deleveraging its debt profile and did an excellent job in the second quarter of 2022. The net debt is now $5.0 billion, down from $5.66 billion in 1Q22. In the second quarter, APA paid down $605 million on its revolving credit facility, which brought the balance down to $275 million on June 30. However, the recent Delaware acquisition will increase the balance again in 3Q22. APA Debt Profile Presentation (Apache Corp)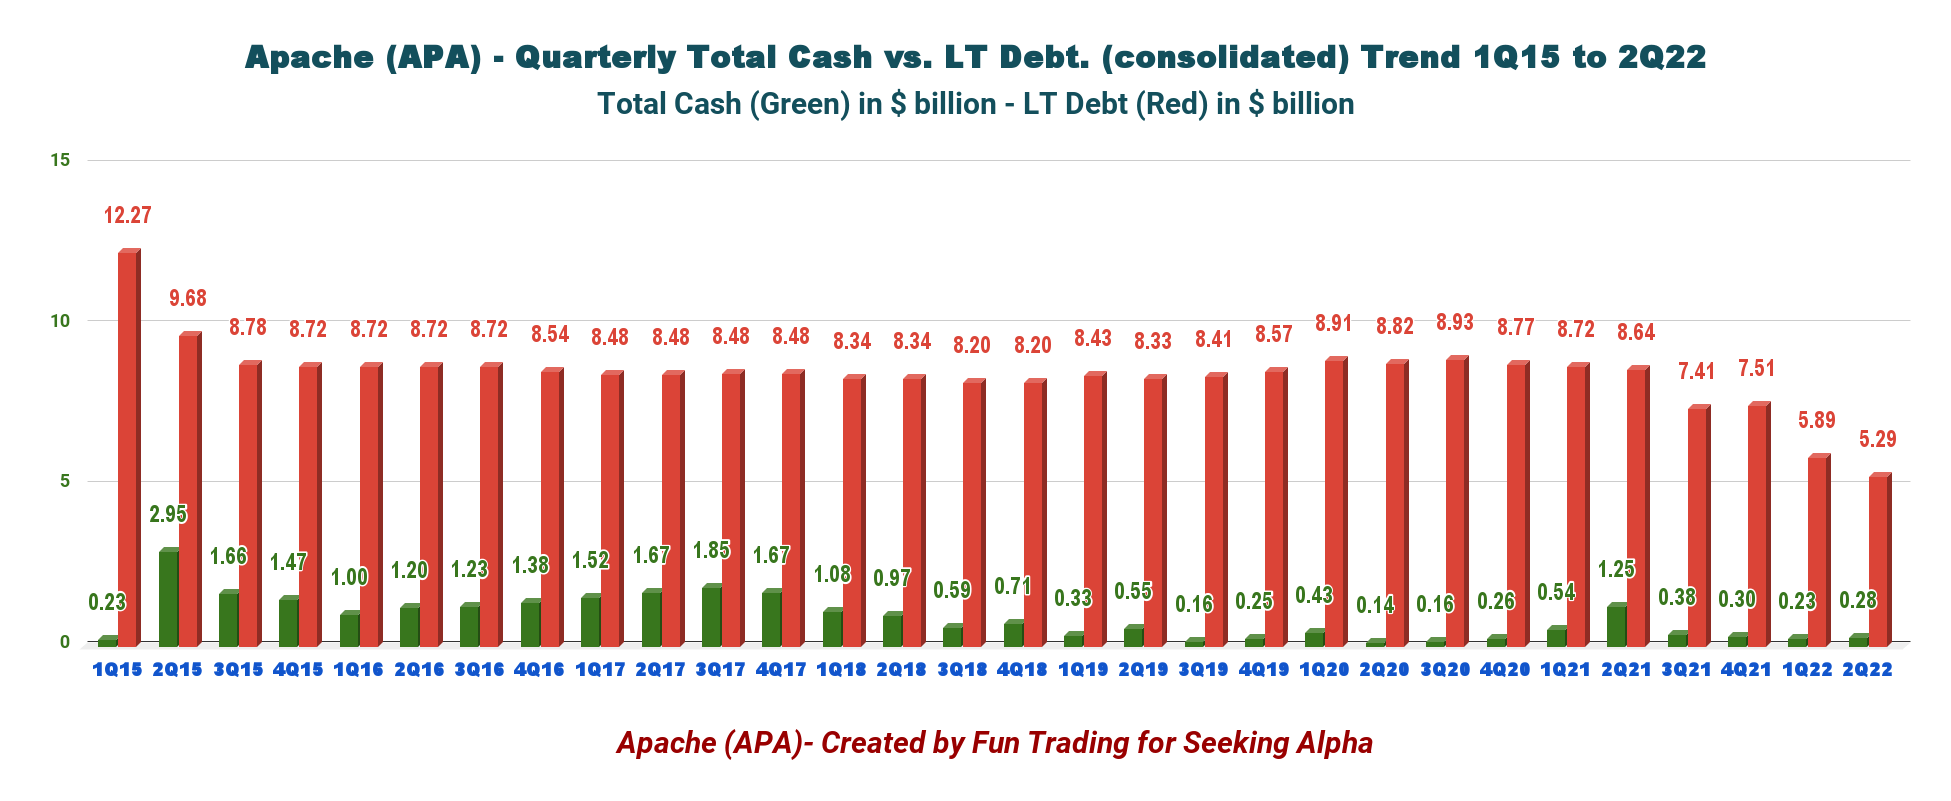
4 – Oil-equivalent production was 384.627K Boepd in 2Q22 which comprises 63% liquids (oil + NGL).
4.1 – Production Details
APA Quarterly Production details history (Fun Trading)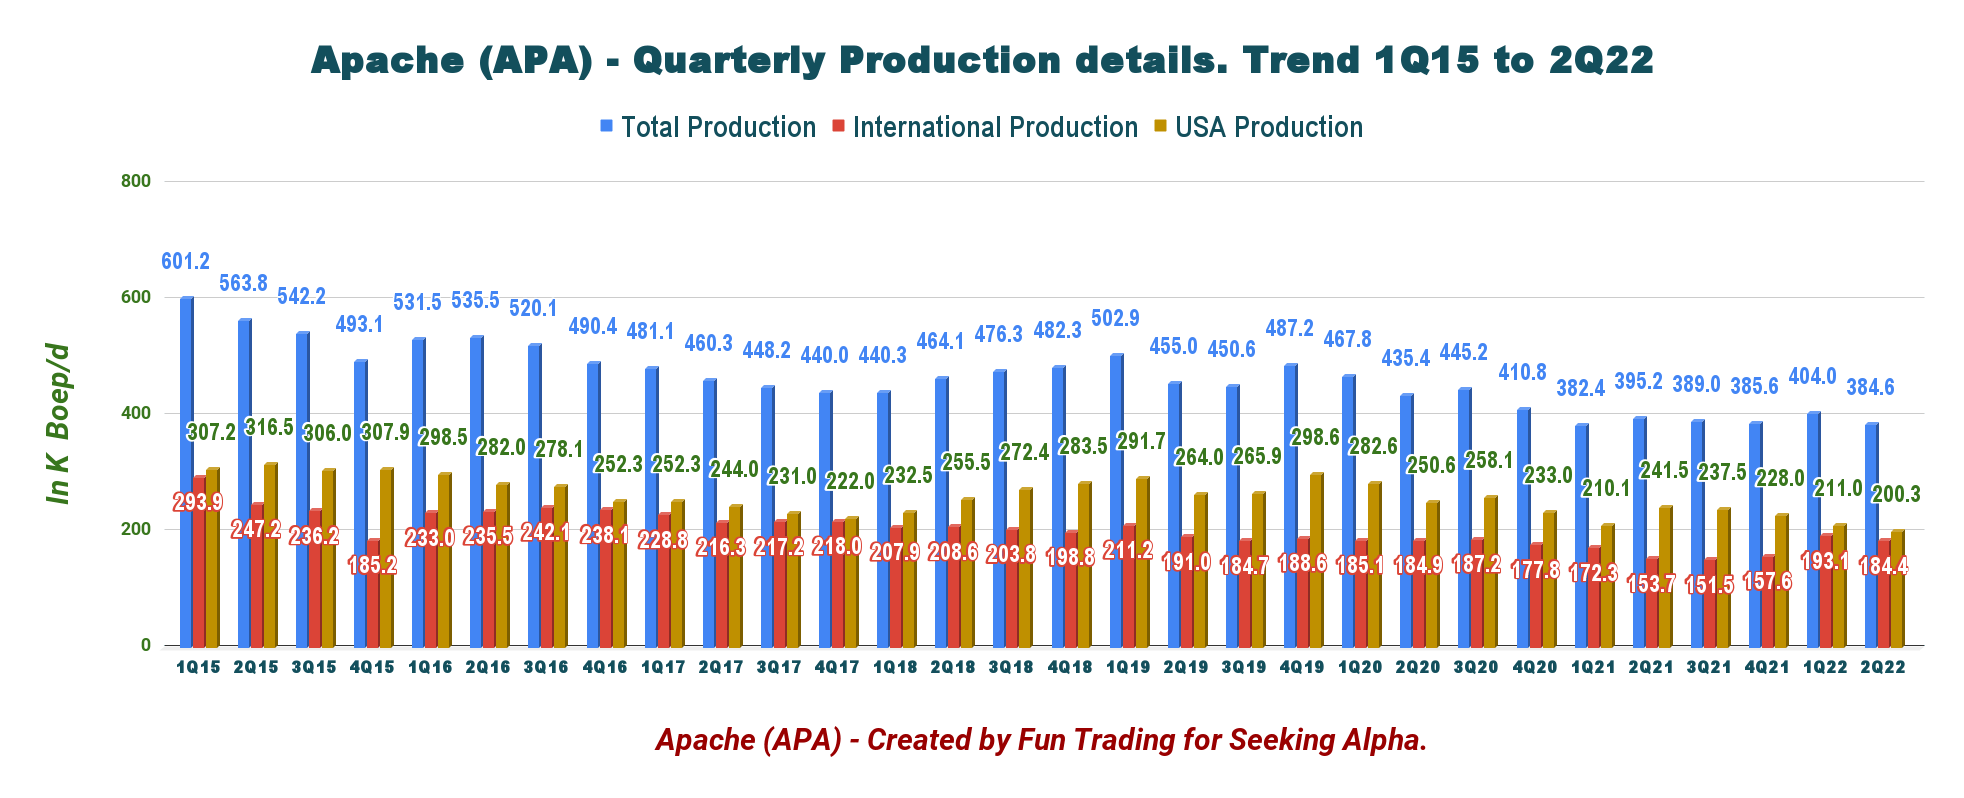
- The company added a third rig in the Permian Basin in the U.S.A., which is now drilling at Alpine High (mainly gas).
- Internationally, the company increased gross oil production in Egypt by more than 7K Boepd from the first quarter and achieved a 92% drilling success rate.
- In the North Sea, maintenance turnaround at the Forties Field was delivered safely and on budget. Total depth was reached on the Garten-3 well at Beryl, expected to provide a substantial volume increase in the year’s second half. Note: Guidance for U.K. tax expense has increased to reflect the $130 million incremental cost for the energy profits levy.
- Also, during the quarter, the company acquired properties in the Texas Delaware Basin (primarily in Loving and Reeves counties) near existing operations. The purchase price was $505 million, and the transaction closed on July 29 for a total cost of $555 million, with expected production of 12K to 14K Boepd for the remaining five months of the year.
APA Quarterly Production equivalent history (Fun Trading)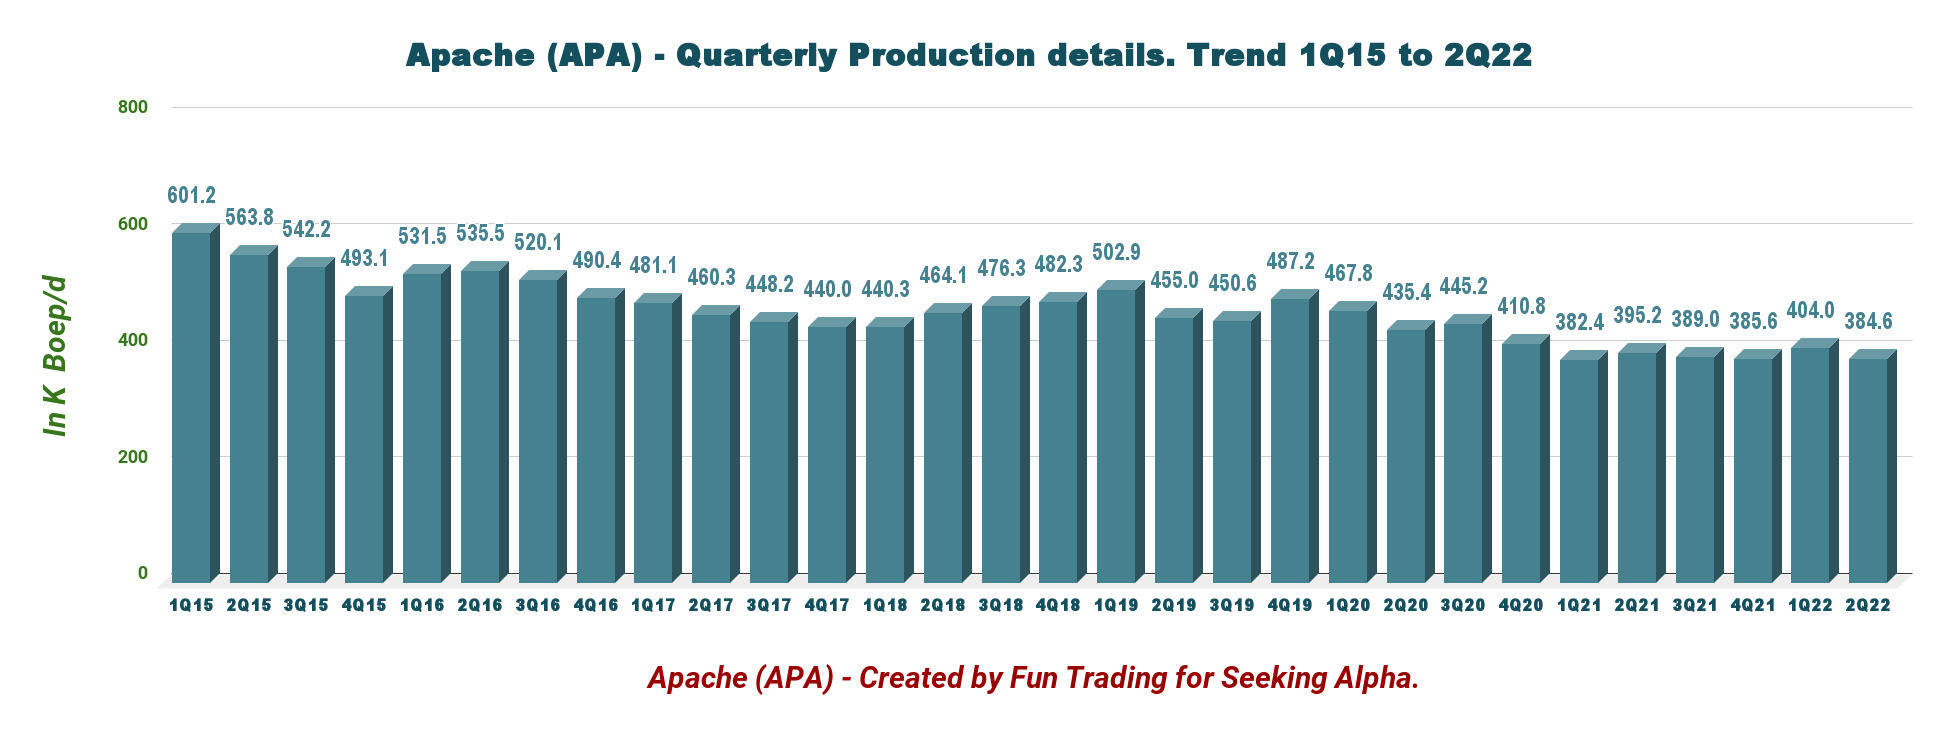
Production in the USA is the most important for the company, with 200.3K Boepd in 2Q22, or 52.1% of the total output.
APA Production US (Fun Trading)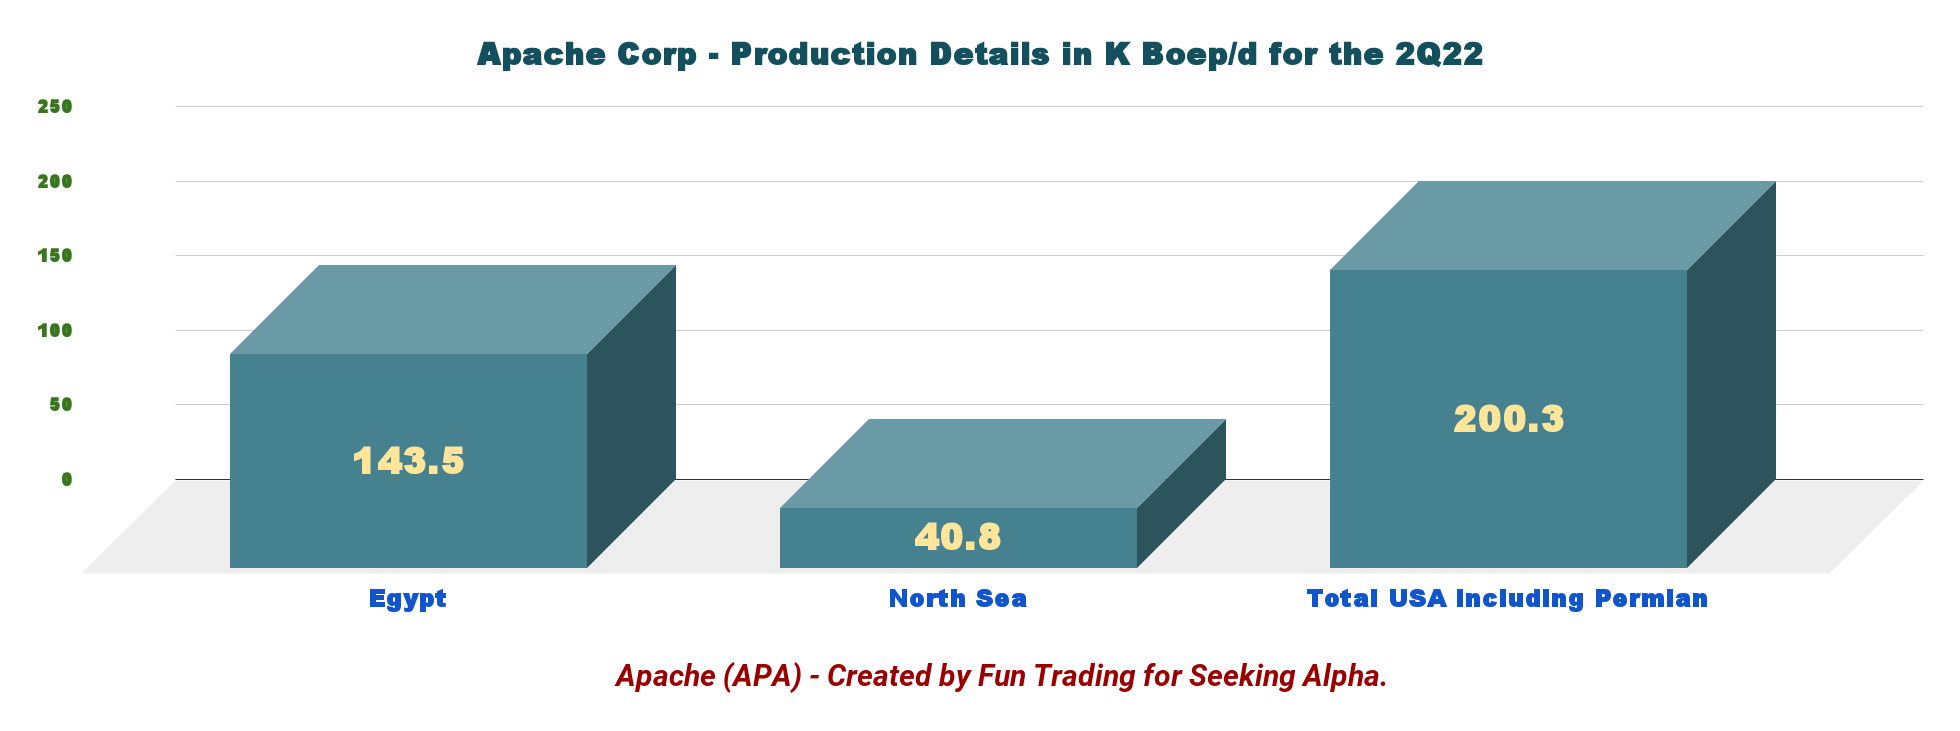
A few production highlights this quarter:
APA Production detail Presentation (Apache Corp)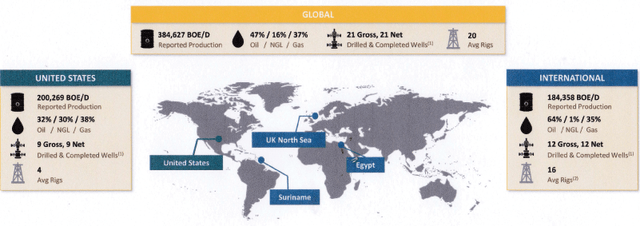
4.2 – Block 58 in Suriname continues to be very promising, and the first discovery was announced in Block 53.
Highlight in 2Q22:
APA announced earlier the discovery at the Krabdagu exploration well on Block 58 offshore Suriname, but the recent drilling of the Dikkop well was a disappointment.
The company is now focusing on the Maka discovery with the Awari exploration prospect and the Sapakara field to drill a second appraisal well at Sapakara South, where the joint venture conducted a successful flow test late last year.
Also, Apache Corp announced that it completed the Baja-1 well in Block 53. It is an exciting discovery that opens exploration in Block 53.
APA is operator and holds a 45% working interest in Block 53, with Petronas holding a 30% working interest and CEPSA holding a 25% working interest. Baja-1 was drilled using the Noble Gerry de Souza in water depths of approximately 1,140 meters (3,740 feet).
The drillship will mobilize to Block 58 following the completion of current operations, where it will drill the Awari exploration prospect, approximately 27 kilometers (north) of the Maka Central discovery.
Our success at Baja marks the 6th oil discovery we have participated in offshore Suriname, and the first on Block 53,” said John J. Christmann.
APA Suriname Presentation (Apache Corp)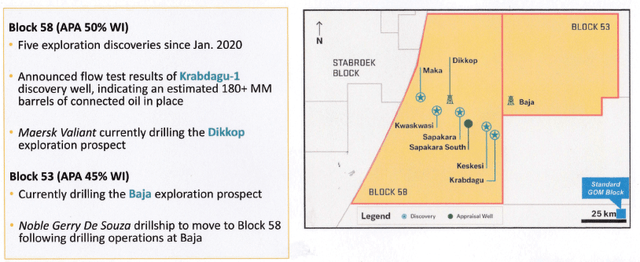
As a reminder, in December 2019, APA and TotalEnergies (TTE) formed a joint venture to develop the project off Suriname. Under the Suriname deal, Apache and Total hold 50% working interest in Block 58. Also, APA Suriname is the operator of Block 53 (45%) with PETRONAS Carigali Sdn Bhd (30%) and Cepsa (25%).
5 – 2022 Guidance
APA 2022 Guidance (Apache Corp)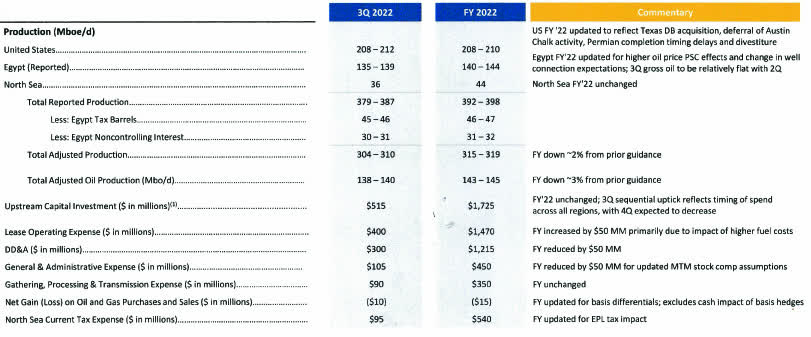
Our CapEx program of $1.725 billion remains unchanged for the year. In terms of adjusted production, our new full year guidance range for Egypt is 63,000 to 65,000 BOEs per day, which is down about 7% from prior expectations.
We’ve also encountered some completion delays on Permian operated and nonoperated wells and recently divested a small package of Permian properties. The net effect of these items is a slight downward revision to our full year 2022 U.S. production guidance.
In the U.K. our near-term activity plan and full year 2022 production guidance remains unchanged… I will note that the new energy profits levy recently became effective in the U.K. This reduces our free cash flow outlook going forward.
Commentary and Technical Analysis
APA TA Chart short-term (Fun Trading)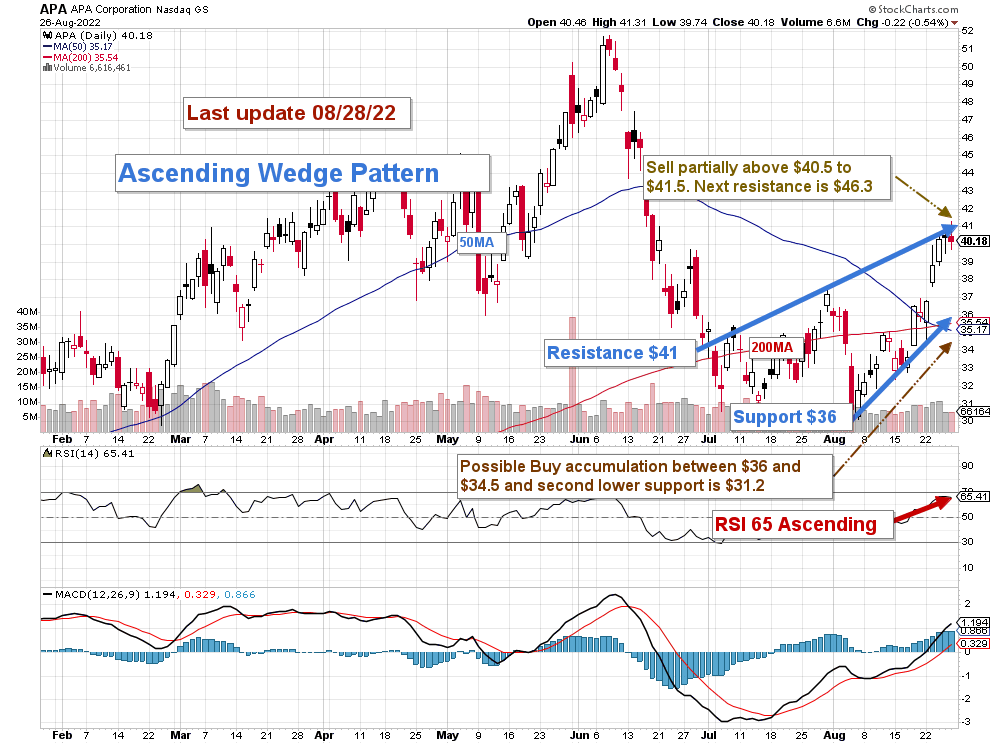
Note: The chart has been adjusted for the dividend.
APA forms an ascending broadening wedge pattern with resistance at $52 and support at $36. An ascending broadening wedge is a bearish chart pattern (considered a reversal pattern).
The short-term strategy is regularly trading LIFO at about 30%-35% of your position. I suggest selling above $52 and waiting for a retracement below $36.
However, the pattern is broadening, and it is doubtful that APA will reach the resistance indicated above short-term, and a better short-term strategy should be to take profits at the 50MA at around $42-43.
Also, if we look at the RSI, we can see that APA is close to an oversold position which gives another reason to accumulate at or below $36 with potential lower support at $33.
However, this simple strategy will have to be adjusted depending on the situation in Ukraine and the growing risk of stagflation which could significantly hurt the oil stocks that have been overheating over the past few months.
Watch oil prices like a hawk.
Note: The LIFO method is prohibited under International Financial Reporting Standards (IFRS), though it is permitted in the United States by Generally Accepted Accounting Principles (GAAP). Therefore, only US traders can apply this method. Those who cannot trade LIFO can use an alternative by setting two different accounts for the same stock, one for the long-term and one for short-term trading.
Warning: The TA chart must be updated frequently to be relevant. It is what I am doing in my stock tracker. The chart above has a possible validity of about a week. Remember, the TA chart is a tool only to help you adopt the right strategy. It is not a way to foresee the future. No one and nothing can.
Author’s note: If you find value in this article and would like to encourage such continued efforts, please click the “Like” button below to vote for support. Thanks.
Be the first to comment