


adventtr
Introduction
We review our Hold rating on ANSYS, Inc. (NASDAQ:ANSS), after management announced new medium-term targets in early August and shares again fell to levels near their April 2020 trough:
|
Ansys Share Price (Last 5 Years) 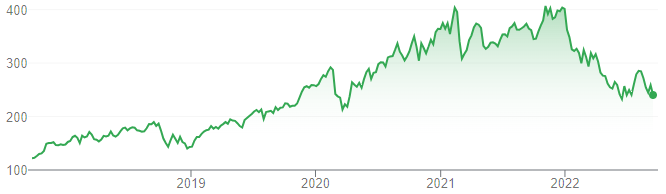 Source: Google Finance (16-Sep-22). |
We downgraded our rating on Ansys from Buy to Hold in May 2020, when the share price was $263.51. After a strong run, Ansys’ share price has fallen 42% from its 52-week high and is currently 9% lower than at our downgrade.
We remain cautious on Ansys because of valuation. New medium-term targets represent a significant improvement, with Annual Contract Value (“ACV”) growth accelerating to 12% and EBIT margin stabilizing, and current valuation looks superficially reasonable at approximately 31x 2022 guided Non-GAAP EPS. However, once we include Share-Based Compensation (“SBC”) costs, the P/E is closer to 45x. We expect shares to de-rate and, even assuming medium-term targets are met, expect a total return of just 21% (6% annualized) by 2025 year-end. Avoid.
Ansys’ New Medium-Term Targets
At its investor update on August 9, management announced new medium-term targets that we believe imply a low-teens Non-GAAP EPS CAGR, based on a 12% ACV CAGR and a stable EBIT margin.
ACV is expected to grow at an ex-currency CAGR of 12% in 2022-25, compared to 11% in 2019-22, with the core simulation market growing at a CAGR of 8-10% from both new and traditional use cases, and Ansys continuing to grow faster than the market, including with 1-2 ppt of growth from acquisitions annually on average:
|
Core Simulation Total Addressable Market (2017-25E) 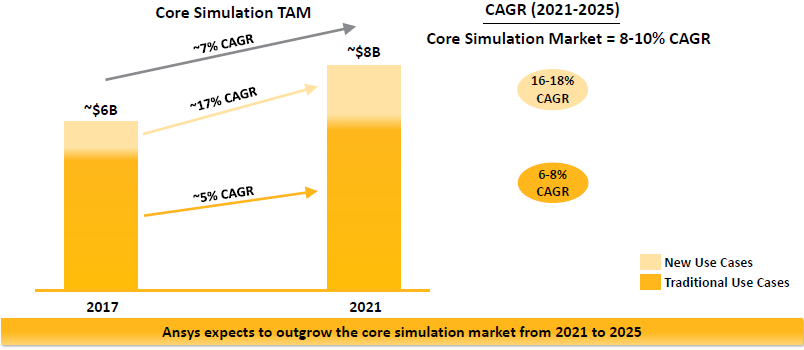 Source: Ansys investor update (09-Aug-22). |
EBIT margin is implied to be stable, as both revenues and operating expenses are expected to grow at similar rates that are both below ACV growth, improving from 2018-21 when EBIT margin shrunk 6 ppt from 47.4% to 41.4%.
|
Ansys Key Growth Rates – Past vs. Future 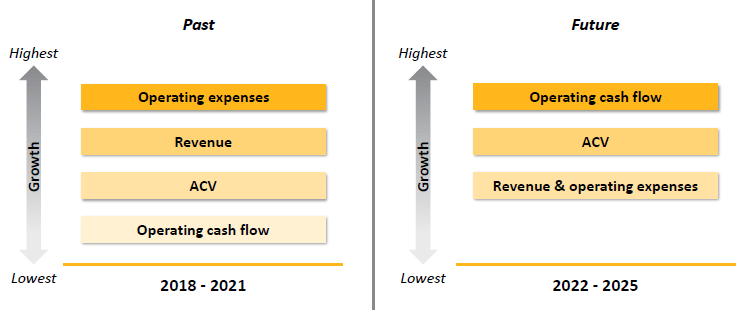 Source: Ansys investor update (09-Aug-22) |
As a reminder, ACV is a management metric that basically reflects the annualized value of bookings starting in each time period. ACV is a better metric for Ansys’ size and growth than revenues, because the latter can be artificially boosted by the upfront recognition of revenues in large multi-year contracts:
|
Ansys Annualised Contract Value Definition  Source: Ansys results presentation (Q2 2019). |
Management also expect Ansys’ total cumulative Operating Cash Flows to be approximately $3bn in 2022-25, much larger than the approximately $2bn achieved in 2018-21.
However, while we believe the new medium-term targets are achievable, we expect annualized investor returns to still be below our 10% target and unsatisfactory.
Ansys Likely To Return Around 6% Annually
With shares at $240.74, we expect a total return of 21% (5.9% annualized) by 2025 year-end from Ansys stock, even after we raise our forecasts to effectively assume that new medium-term targets will be achieved:
|
Illustrative Ansys Return Forecasts 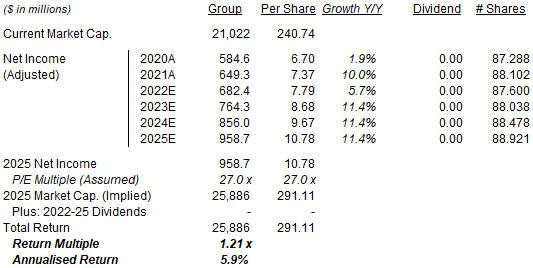 Source: Librarian Capital estimates. |
Our updated key assumptions for Ansys are as follows:
- 2022 EPS to be $7.79 (was $7.80), in the upper quartile of the latest guidance ($7.50-7.88)
- From 2023, Net Income to grow by 12% annually (was 10%)
- 2022 share count to be 87.6m (was 87.7m)
- From 2023, share count to grow by 0.5% annually (unchanged)
- P/E at 27.0x at 2025 year-end (was 25.0x)
Our new 2025 Non-GAAP EPS forecast is 5.4% higher than before ($10.23), and implies a 2021-25 CAGR of 10.0%. The stock’s forecasted annualized return is 4 ppt below this because of the de-rating assumed.
We review each of the key assumptions in our forecasts, starting with valuation.
Ansys Stock Valuation
While Ansys’ current valuation looks superficially reasonable, it is much more expensive once Share-Based Compensation costs are included, and we expect a significant de-rating.
At $240.74, relative to 2021 Non-GAAP Net Income, Ansys stock is trading at a P/E of 32.4x:
|
Ansys Net Income & Cashflows (2016-21) 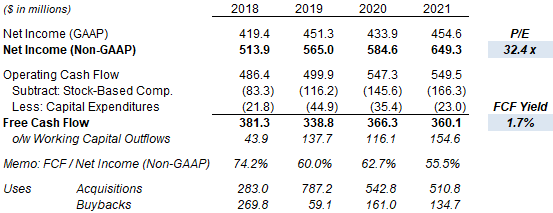 Source: Ansys company filings. |
However, in 2021, Ansys’ GAAP Net Income was 30% ($194.7m) lower than its Non-GAAP Net Income, mostly due to SBC costs of $166.3m. SBC costs are a real expense for shareholders, albeit a non-cash one. Free Cash Flow (“FCF”) Yield, which in our definition is after deducting SBC costs, is just 1.7%, implying a 58.4x multiple.
Similarly, relative to the mid-point of 2022 guidance, Ansys stock is trading at a P/E of 31.3x relative to Non-GAAP EPS, but a FCF Yield of just 1.9%, implying a 53.1x multiple:
|
Ansys Cashflows & Valuation (2022E) 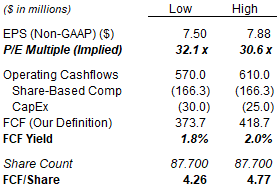 Source: Ansys company filings. NB. Assume share-based compensation costs to be the same as 2021. |
We have assumed 2022 SBC costs to be the same as 2021. So far in H1 2022, SBC costs were slightly (3.7%) down year-on-year, and together with related excess payroll taxes represented 29% of Non-GAAP Net Income:
|
Ansys Financials – GAAP vs. Non-GAAP (H1 2022)  Source: Ansys results release (Q2 2022). |
Large SBC costs are the key reason why we assume a P/E of “only” 27.0x (on Non-GAAP EPS) for 2025 year-end. Adjusted for SBC costs assumed to be 30% of Non-GAAP Net Income, we are in reality assuming a 38.6x P/E for 2025 year-end. Similarly, while Ansys stock is currently trading at 31.3x guided 2022 EPS (at mid-point), making the same adjustment with SBC costs would imply a “real” P/E of 44.7x.
This de-rating that we expect is the biggest reason why annualized return is lower than EPS growth in our forecasts.
Ansys’ Low-Teens EPS CAGR
Our forecasted EPS CAGR effectively assumes that Ansys will meet the new medium-term forecasts.
We believe the new ACV CAGR target of 12% to be achievable. Ansys’ ACV growth had an arithmetic average of 13% (excluding currency) in 2018-21, falling below 10% only in the COVID-disrupted 2020; it is guided to be 11.3-13.5% in 2022 and was 12.1% for H1 2022:
|
Ansys ACV Growth (ex-Currency) (2018-22E) 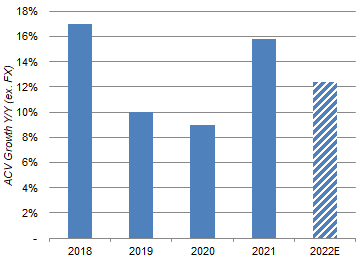 Source: Ansys company filings. |
Management’s new target of having operating expenses growing in line with revenues and below ACV represents an improvement from its recent track record. During 2017-21, while ACV grew with a CAGR of 13.6% (including currency), revenues grew at a CAGR of 15.2% but operating expenses grew at a CAGR of 18.6%:
|
Ansys ACV, Revenues & Costs (2017-21) 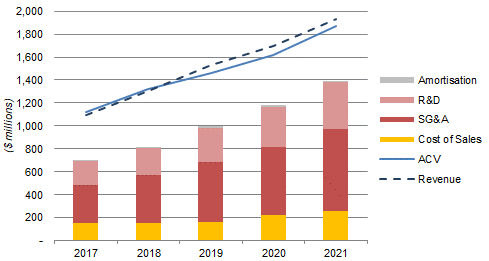 Source: Ansys company filings. |
Ansys’ EBIT margin has continued to shrink in H1 2022, falling 15 bps year-on-year for H1 (and 100 bps year-on-year for Q2) as costs again grew faster than both revenues and ACV:
|
Ansys P&L and Cashflows (Q2 and H1 2022 vs. Prior Periods)  Source: Ansys company filings. NB. Al figures are non-GAAP unless otherwise stated. |
However, we believe management can lower its operating expense growth while still achieving its targeted ACV and revenue growth. Ansys is a high-quality business, selling mission-critical software to a diversified set of industries globally and is the market leader across its markets. We also suspect at least some of the high historic expense growth was due to poor discipline during a period of boom in the Technology industry.
Management targets of ACV growing at 12%, and revenues as well as operating expenses both growing less quickly (and at similar rates to each other), imply a Net Income growth of less than 12%. We assume 12% for our forecasts.
Ansys’ Expanding Share Count
We assume an 0.5% annual expansion in Ansys’ share count, compared to an average of 0.4% in 2018-21:
We assume an 0.5% annual expansion in Ansys’ share count, compared to an average of 0.4% in 2018-21:
|
Ansys Share Count & Share Count Growth (2018-21) 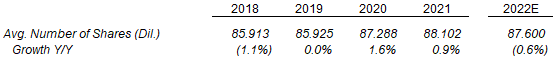 Source: Ansys company filings. |
We believe this is a reasonable assumption, given acquisitions are expected to continue to contribute to revenue growth and SBC costs are expected to remain material.
Management currently guides to a diluted share count of 87.6m for 2022, 0.6% lower than in 2021. However, this is after $156m of share repurchases in H1, and the 87.6m figure also implies an increase from H1 (when it was 87.5m).
No significant acquisitions using stock has been announced year-to-date. Ansys’ most recent large deal, the $412m acquisition of Zemax completed in October 2021, was all-cash; the last material use of Ansys equity in M&A was the $720m acquisition of AGI completed in December 2020, for which $207m of stock was issued.
Where We Can Be Wrong
The main areas where we may be too conservative on Ansys are valuation, costs and strategic interest.
Our 27x P/E assumption may prove too conservative. Ansys stock had traded at above 60x at various points, for example when it first peaked at $413.19 in February 2021. While we believe that such high multiples were enabled by ultra-low interest rates and strong speculative interest that have disappeared, they can appear again (if only briefly).
Ansys’s cost profile may improve more than we expect. We have always been puzzled by the deterioration in Ansys’ profit margins, as software businesses should have at least some operational leverage and, in Ansys’ case, the growing percentage of recurring ACV (81% in 2021) should help both SG&A and R&D margins. Management now predicts a stabilization in the EBIT margin, but there may be further room for improvement.
A strategic buyer may acquire Ansys at a significant premium to the current valuation. In some ways this represents a variation of the two aforementioned scenarios, as a strategic buyer can justify a much higher valuation for Ansys because they can extract large synergies from Ansys’ current cost structure, or indeed can simply decide to buy Ansys for more than it is actually worth.
We do not believe any of the above is sufficiently likely to change our Hold rating, but will continue to monitor the situation.
Is Ansys a Buy? Conclusion
Our base case forecasts show a return that is below our target, and we reiterate our Hold rating on Ansys stock.
Be the first to comment