

Gold (XAU/USD) Price, Chart, and Analysis
- The US dollar nudges higher in subdued trading conditions.
- Fibonacci resistance continues to keep gold at bay.
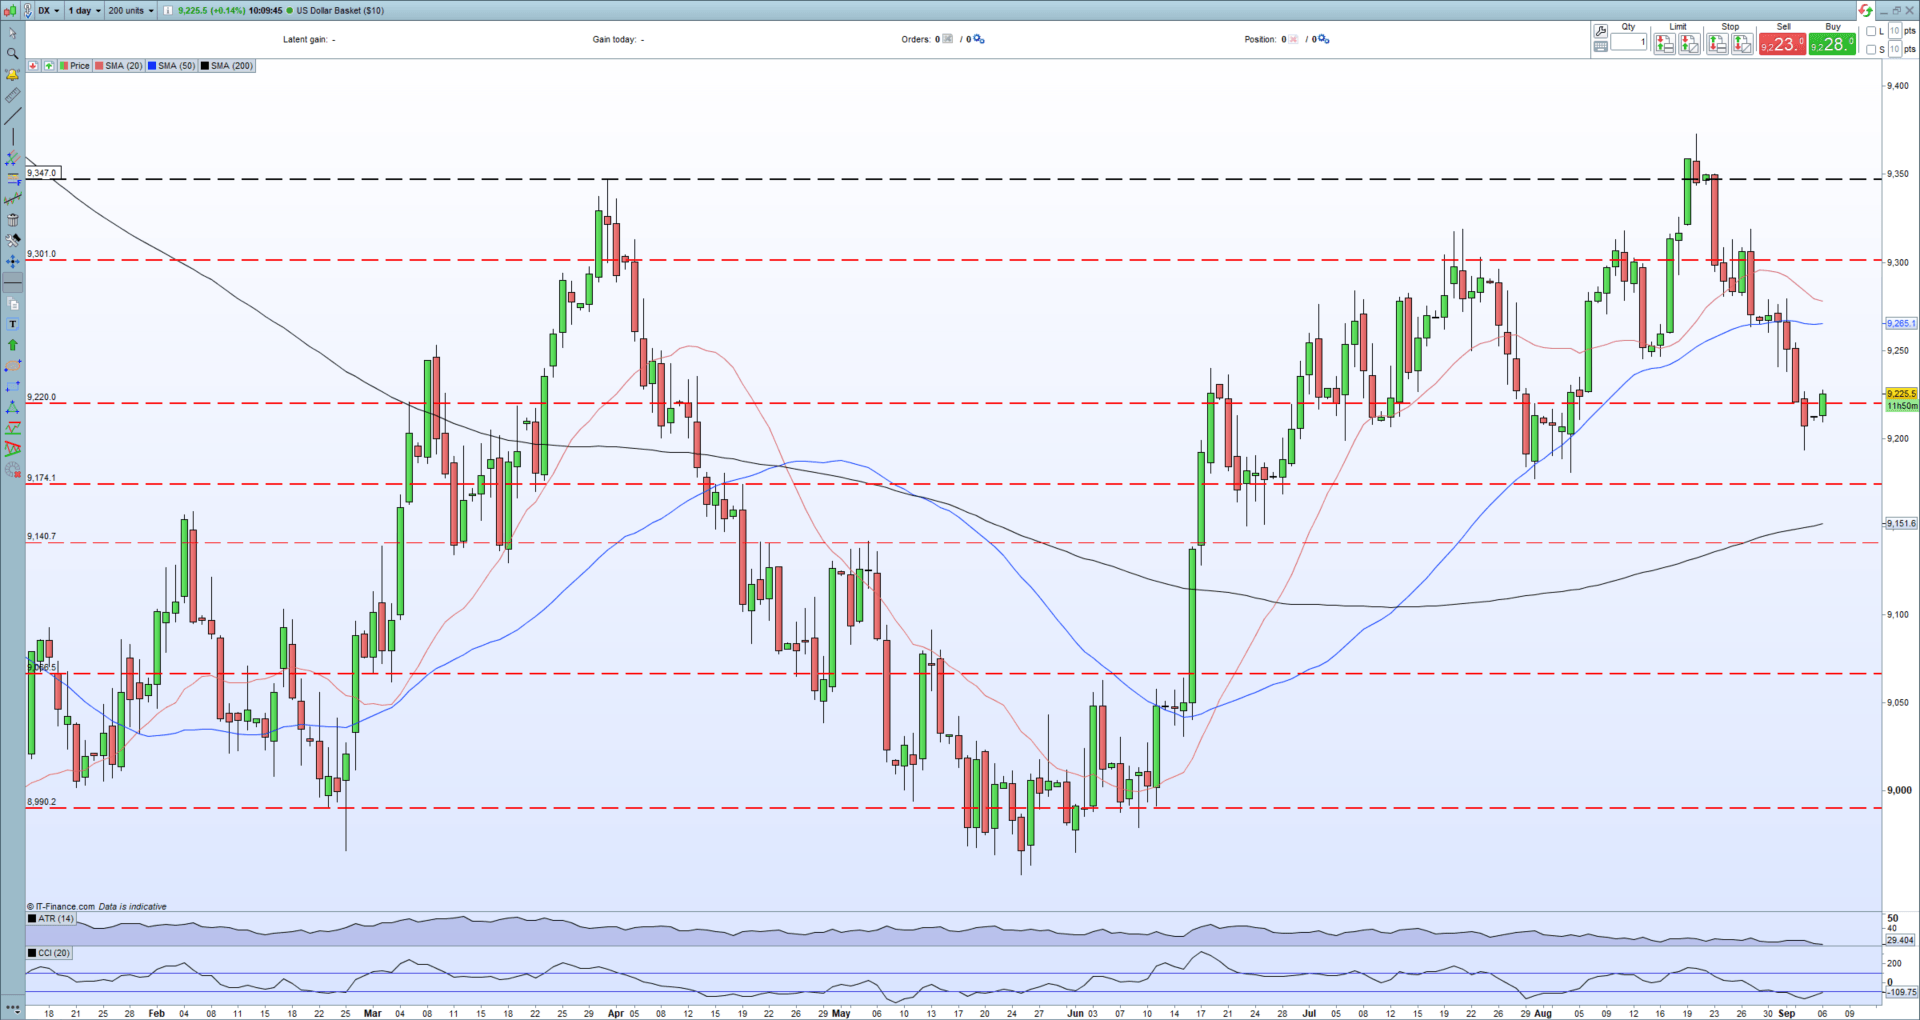
The US dollar is squeezing gently higher in US-holiday thinned trade Monday and has recovered all of Friday’s post-NFP sell-off. The greenback remains in a notable downtrend with a series of lower highs and lows present on the daily chart. From a technical point of view, the DXY needs to remain above last Friday’s low print at 91.94 and close above last Friday’s high at 92.26 to start to break the downtrend in the coming days. The chart shows that the US dollar is still oversold (CCI) although it is not at the extremes seen at the end of last week.
There is little in the way of market-moving US data releases this week, leaving the US dollar basket (DXY) vulnerable to other major currency moves. Keep up to date with all market-moving data releases and events by using the DailyFX Calendar
US Dollar Basket (DXY) Daily Price Chart September 6, 2021
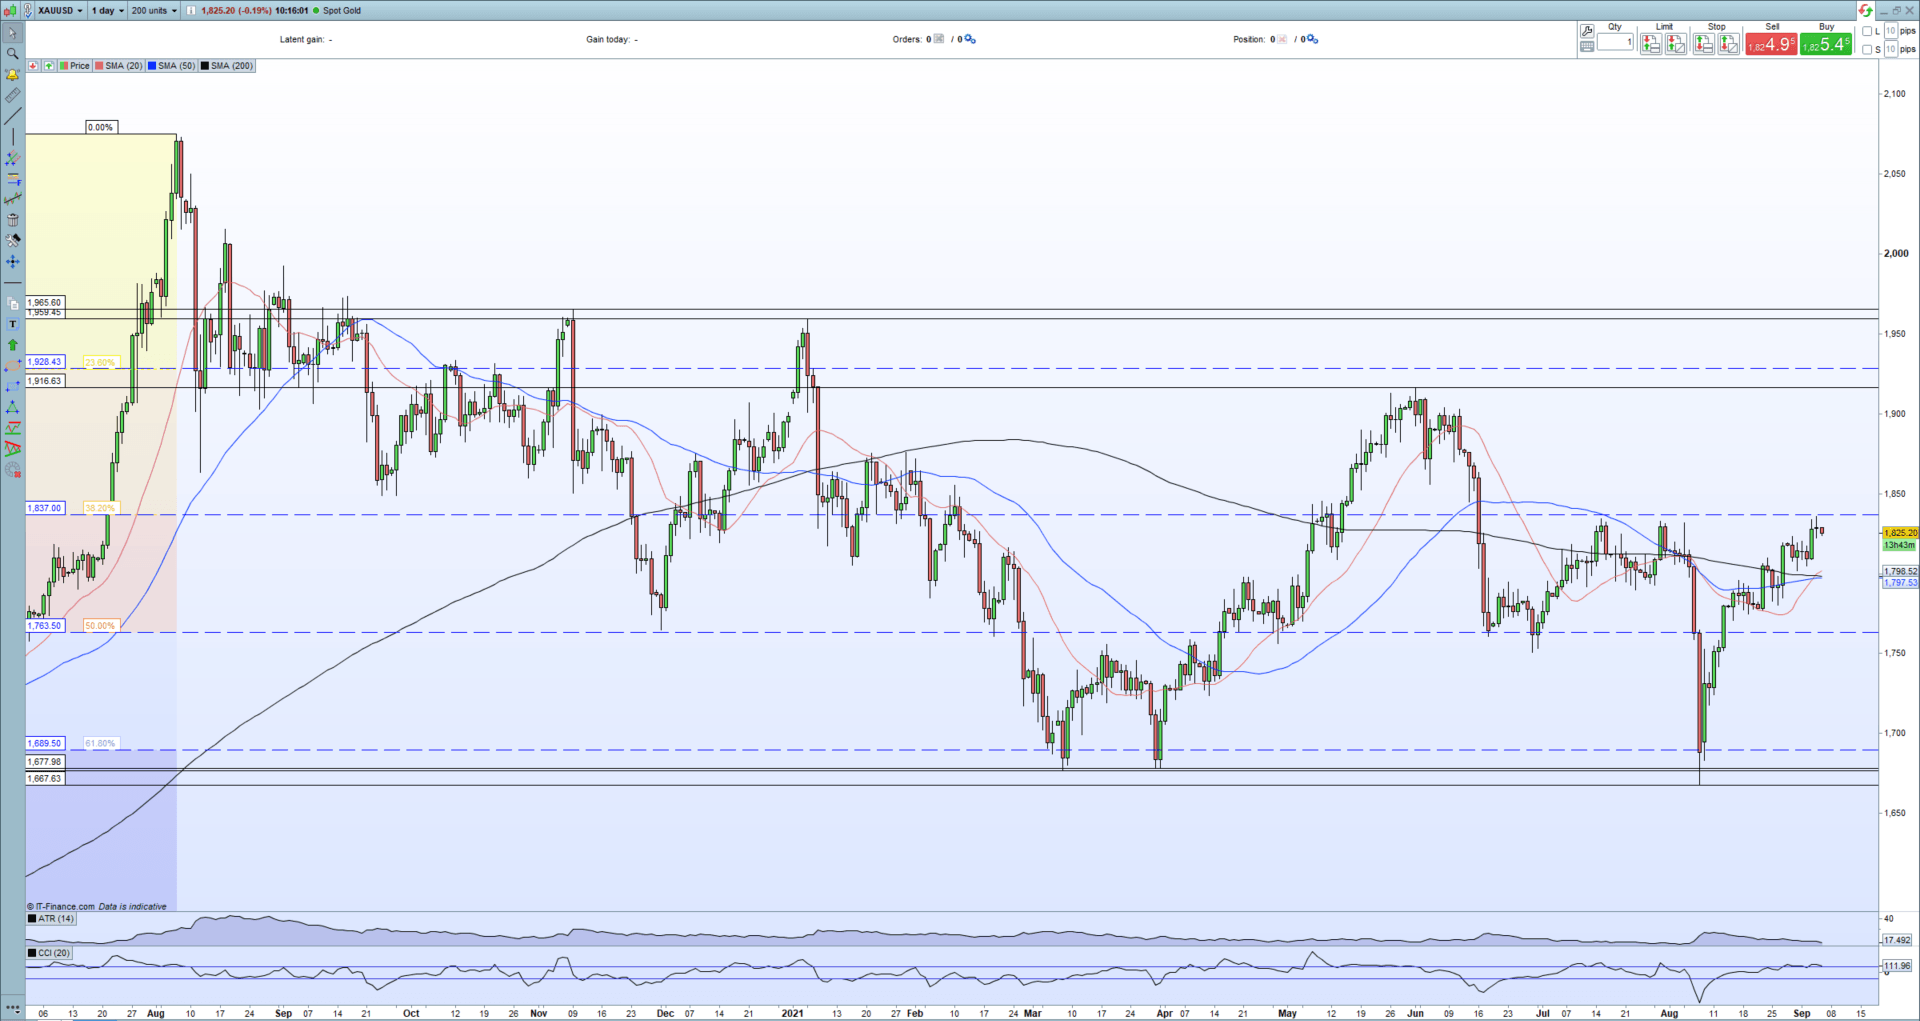
The recent sell-off in the US dollar has allowed gold to drift back towards resistance based on the 38.2% Fibonacci level at $1,837/oz. This level has help three breakout attempts over the last few weeks but the recent price action seen on the daily chart suggests that any further attempt may prove to be successful eventually despite the market remaining overbought. Last week’s break above all three moving averages is a positive sign for the precious metal, while a short-term series of higher lows and higher highs remain intact.
Gold (XAU/USD) Daily Price Chart September 6, 2021
Retail trader data show 75.00% of traders are net-long with the ratio of traders long to short at 3.00 to 1.The number of traders net-long is 1.96% higher than yesterday and 13.26% higher from last week, while the number of traders net-short is 3.39% higher than yesterday and 19.17% lower from last week.
We typically take a contrarian view to crowd sentiment, and the fact traders are net-long suggests Gold prices may continue to fall.Positioning is less net-long than yesterday but more net-long from last week. The combination of current sentiment and recent changes gives us a further mixed Gold trading bias.
What is your view on Gold – bullish or bearish?? You can let us know via the form at the end of this piece or you can contact the author via Twitter @nickcawley1.
Be the first to comment