

scyther5
Part I – Introduction
Johannesburg-based AngloGold Ashanti Limited (NYSE:AU) released its 6-months results ending 30 June 2022 on August 5, 2022.
Note: This article updates my previous article on AngloGold Ashanti, published on June 27, 2022. I have been following AU’s regularly since December 2020.
1 – H1 2022 results and commentary
AU H1 2022 highlights (AU Presentation)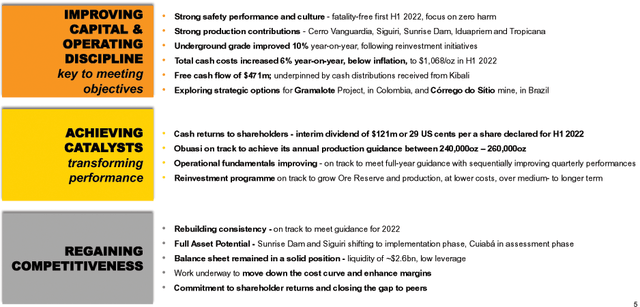
The company owns producing assets and projects in three continents with advanced projects in Nevada, USA. AngloGold Ashanti recorded a 10% quarter-over-quarter increase in production to 1,233K oz for H1 2022.
The Company continues to record an increasing underground grade trend, with underground grades increasing 10% year-on-year due to the progression of the Company’s reinvestment in the portfolio.
1.1 – Africa
Operations produced 382K Oz at a total cash cost of $1,028/oz for the 3-month ended 30 June 2022. The company indicated substantial contributions from Iduapriem and Siguiri. 30uapriem treated higher tonnes and higher grades as ore tonnes were mined from Teberebie Cut 2. Siguiri continued to show meaningful improvement in grades and recovery rates. Obuasi is on track to achieve its annual production guidance between 240K oz – 260K oz. The initial Full Asset Potential (FAP) process is now completed at Siguiri.
1.2 – Latin America
The Americas operations produced 267K Oz at a total cash cost of $1,062/oz for the period ending on June 30, 2022. Heavy rains and flooding have impacted Brazil in Minas Gerais in H1 2022. The Brazilian Real is strengthening against the U.S. dollar in H1 2022, negatively impacting costs.
1.3 – Australia
The Australia operations produced 254K Oz at a total cash cost of $1,204/oz for the period ending on January 30, 2022. The Sunrise Dam’s yield has improved by 17% year-on-year. Golden Delicious pit contributed higher volumes and higher grades. Sunrise Dam has moved to the “Implementation” stage of the FAP process. Stripping continued at Tropicana’s Havana pit.
1.4 – Nevada Project advancing as planned
AU Project Nevada (AU Presentation)
AngloGold Ashanti’s project team has integrated the Corvus assets and project data during the first six months of 2022 to establish priorities for the remainder of the year.
The Company completed planning for feasibility study work at North Bullfrog and commenced a PFS at Silicon along with further drilling at the Merlin deposit.
2 – Stock performance
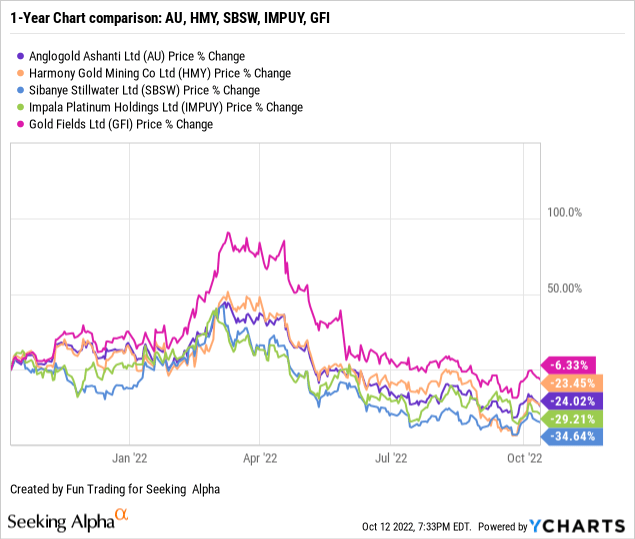
I am covering four other companies located in South Africa: Sibanye Stillwater (SBSW), Harmony Gold (HMY), Impala Platinum (OTCQX: IMPUY), and Gold Fields Ltd. (GFI).
AngloGold Ashanti has dropped significantly since its peak in March 2022. AU is now down 24% on a one-year basis.
Part II – Global Presentation and Gold Production
1 – H1 2022 Gold production
1.1 – 6-month Production
AngloGold Ashanti sold 1,233K Au Oz in H1 2022. The company indicated that it produced 1,214K Au Oz in H1 2021.
AU Gold production history (Fun Trading)
1.2 – 6-month production per mine
The company produced gold from ten different mines:
AU Production per mine 12/2021 versus 6/2022 (Fun Trading)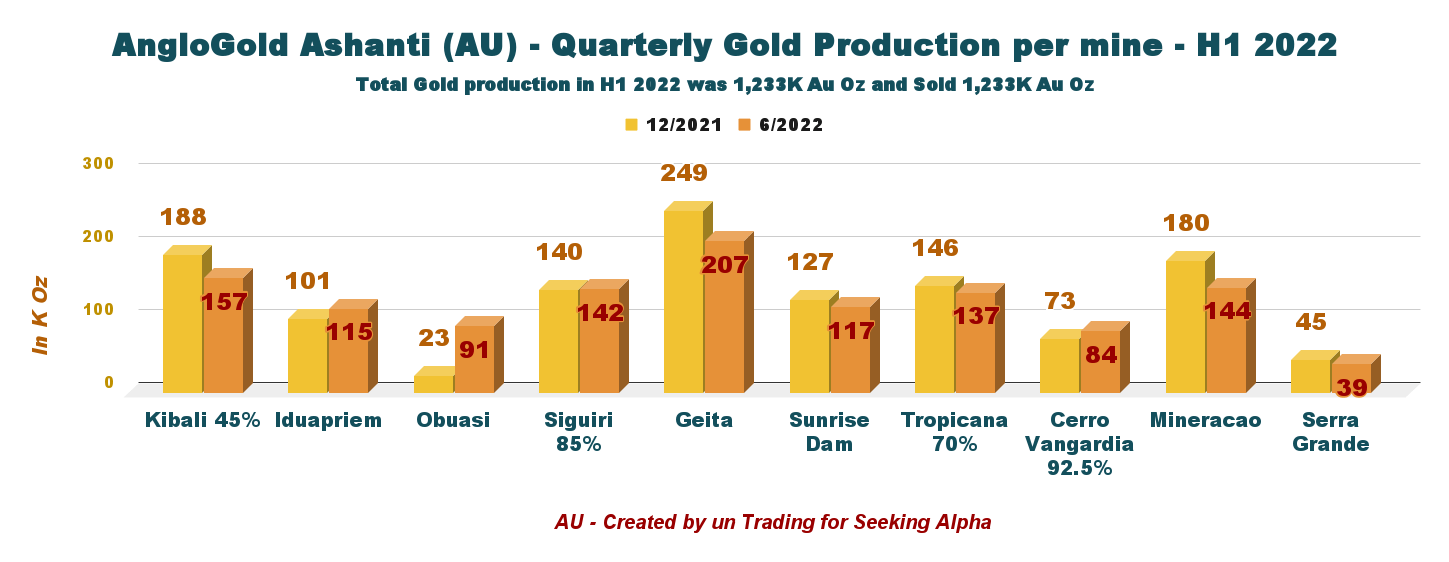
Obuasi mine will achieve its annual production guidance between 240K oz – 260K oz.
2 – All-in Sustaining Costs and Gold price realized
All-in-sustaining cost (AISC) was $1,418 per ounce in 6/2022. An increase of 6.4% from the last year-6 months was mainly due to planned higher sustaining CapEx and increased total cash costs.
AU Gold price and AISC history (Fun Trading)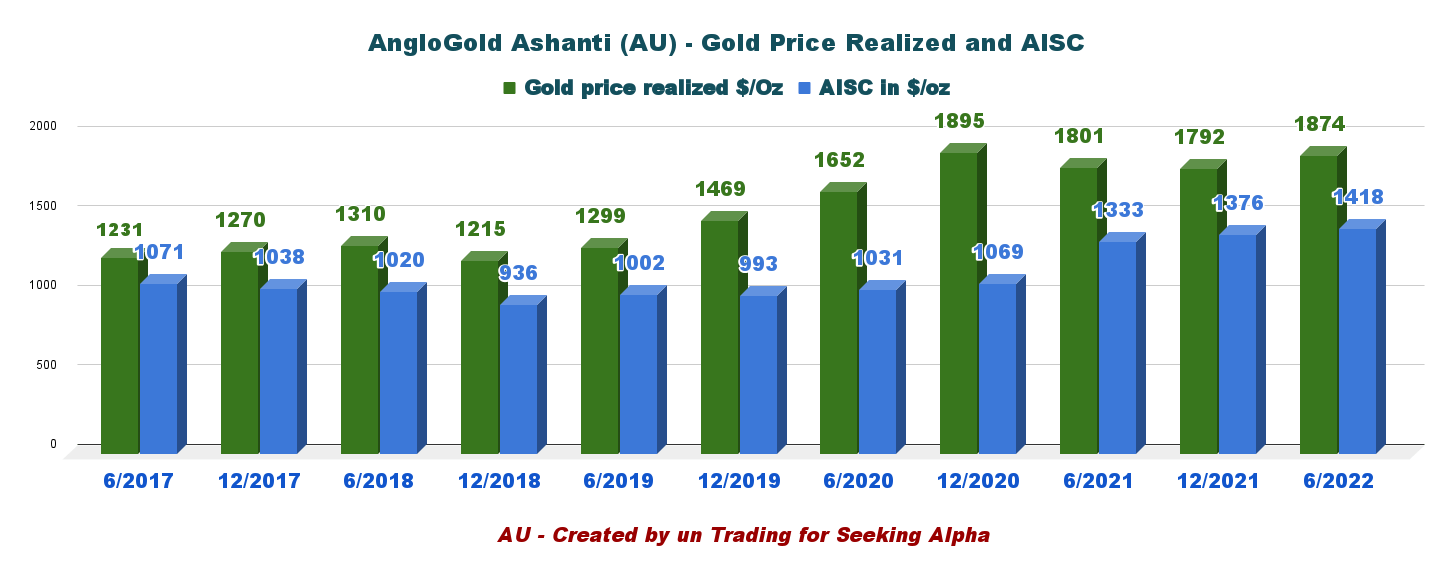
Part III – AngloGold Ashanti – Balance Sheet and Production for 6/2022: The Raw Numbers
Note: Like most South African gold and PGM miners, full results are posted every six months, complicating the analysis.
| AU 6-month | 12/2020 | 6/2021 | 12/2021 | 6/2022 |
| Total Revenues in $ Million (6 months) | 2,464 | 1,965 | 2,064 | 2,155 |
| Net Income in $ Million (6 months) | 532 | 362 | 260 | 298 |
| EBITDA $ Million (6 months) | 1,376 | 775 | 724 | 702 |
| EPS diluted in $/share (6 months) | 1.27 | 0.86 | 0.62 | 0.71 |
| Cash from operating activities in $ Million (6 months) | 1,050 | 467 | 801 | 992 |
| Capital Expenditure in $ Million (6 months) | 395 | 429 | 598 | 434 |
| Free Cash Flow in $ Million (6 months) | 655 | 38 | 202 | 558 |
| Total Cash $ Million (6 months) | 1,330 | 1,081 | 1,154 | 1,266 |
| LT Debt (incl. current) in $ Million (6 months) | 1,931 | 1,929 | 1,909 | 2,005 |
| Shares outstanding (diluted) in Million (6 months) | 419.48 | 419.05 | 420.06 | 420.06 |
Source: Company filings
* Estimated by Fun Trading
AngloGold Ashanti: Balance sheet details
1 – Revenues and Trends. Revenues were $2,155 million in H1 2022
AU Revenues history (Fun Trading)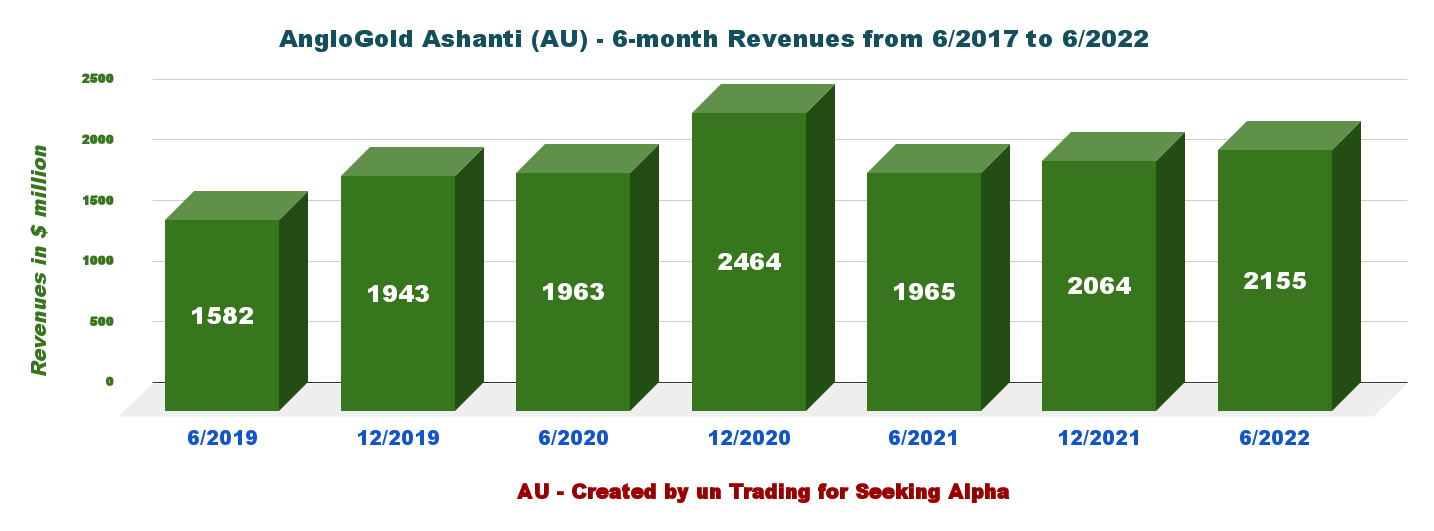
The revenues for 6/2022 were $2.155 billion. Net income was $298 million or $0.71 per diluted share. Chief Executive Officer Alberto Calderon said:
The fundamentals of our Company continue to improve, despite the challenging cost environment. We have the right structure and the right people in place to further optimize our portfolio and close the gap with our peers.
Adjusted EBITDA for the first half of 2022 was $864 million, compared with $876 million for the first half of 2021.
2 – Free cash flow was $558 million in H1 2022
AU Free cash flow (Fun Trading)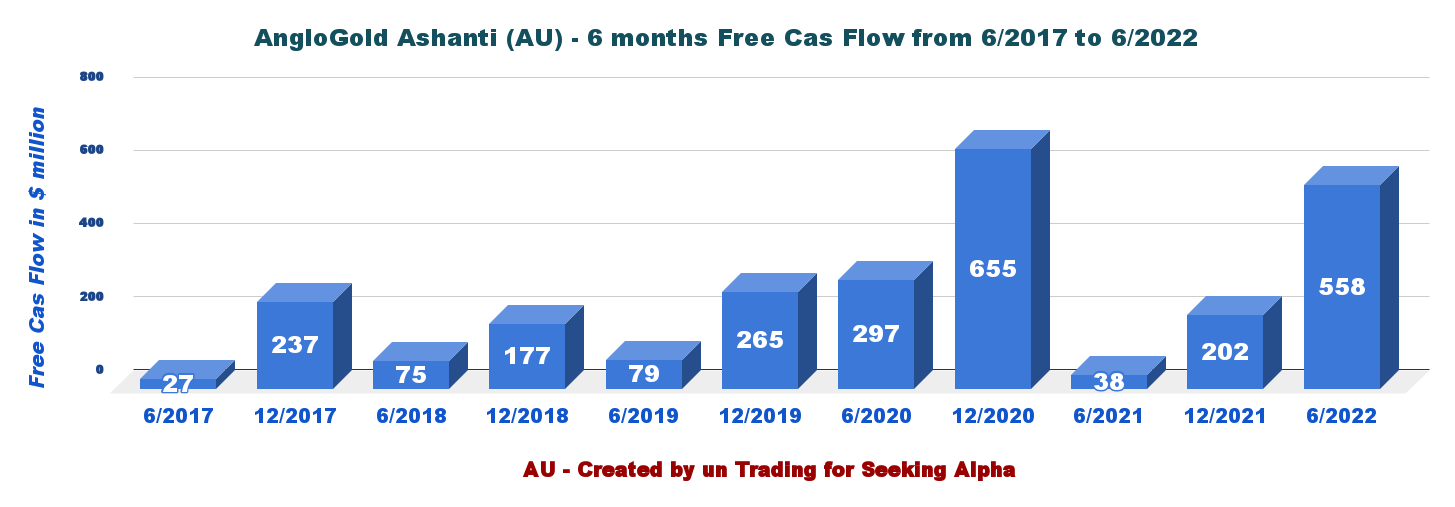
Note: Generic free cash flow is the cash from operations minus CapEx. AngloGold Ashanti’s Free Cash Flow was $558 million in H1 2022, compared to $38 million in H1 2021.
3 – AngloGold Ashanti’s debt situation is still solid
AU Cash versus Debt history (Fun Trading) AU Liquidity (AU Presentation)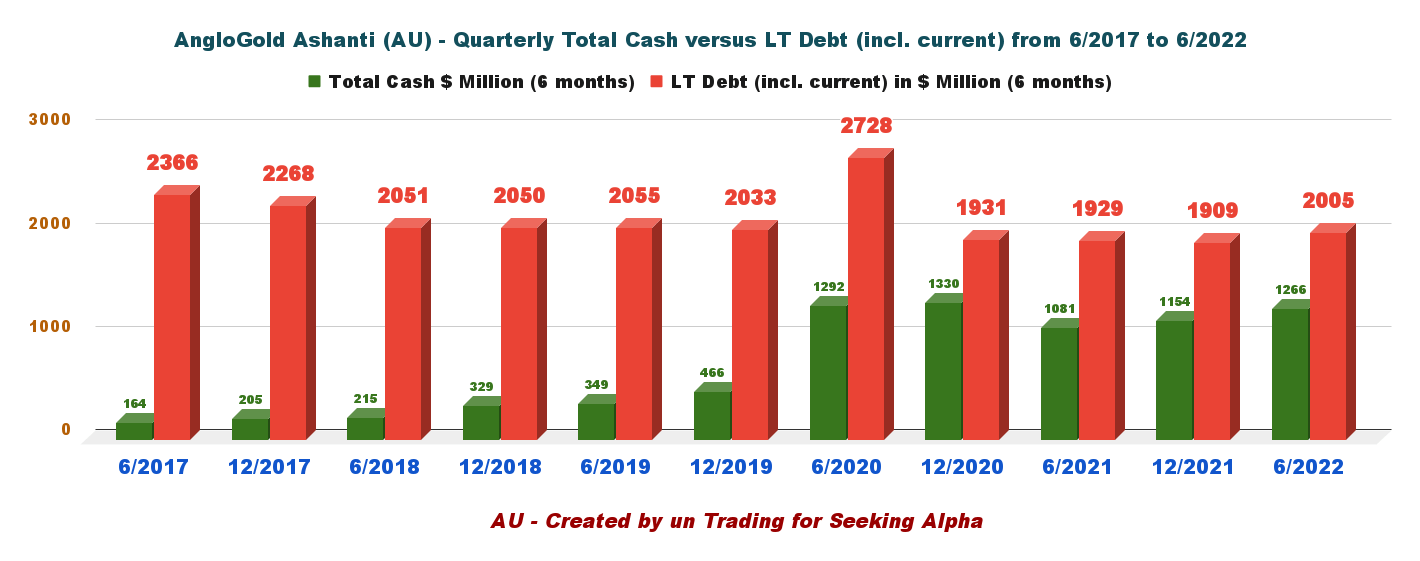

It is a solid debt profile that encourages investors to bet for the long term.
At 30 June 2022, the balance sheet remained robust, with strong liquidity comprising the new US$1.4bn multi-currency RCF of which $1.3bn was undrawn; the $65m Siguiri RCF of which $30m was undrawn; the South African R150m ($9m) RMB corporate overnight facility which was undrawn; and the $150m Geita RCF, which was fully drawn. At 30 June 2022, the Company had a cash and cash equivalent balance of approximately $1.3bn, taking overall group liquidity to approximately $2.6bn. (press release)
4 – 2022 Guidance still on track
2022 gold production is expected to be 2.55 Moz to 2.80 Moz, and AISC is seen between $1,295 and $1,425 per ounce ($1,360 midpoint). The guidance has not changed since my preceding article.
CapEx will be between $1.05 billion and $1.15 billion.
AU Guidance (AU Presentation)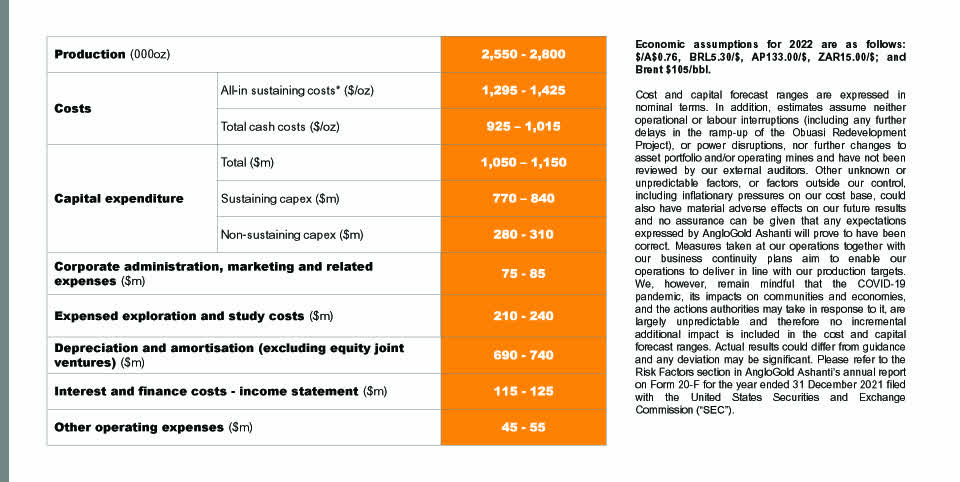
In the press release, AngloGold Ashanti said that due to Russia’s invasion of Ukraine and the disruption of supply chains, certain critical commodity supplies are experiencing volatility and inflationary pressures.
These include oil and lubricants, ammonia-related products (explosives and cyanide), and labor. AU expects inflationary pressures to continue to impact operating costs for the remainder of the year.
Part IV – Technical Analysis and Commentary
AU TA Chart short-term (Fun Trading StockCharts)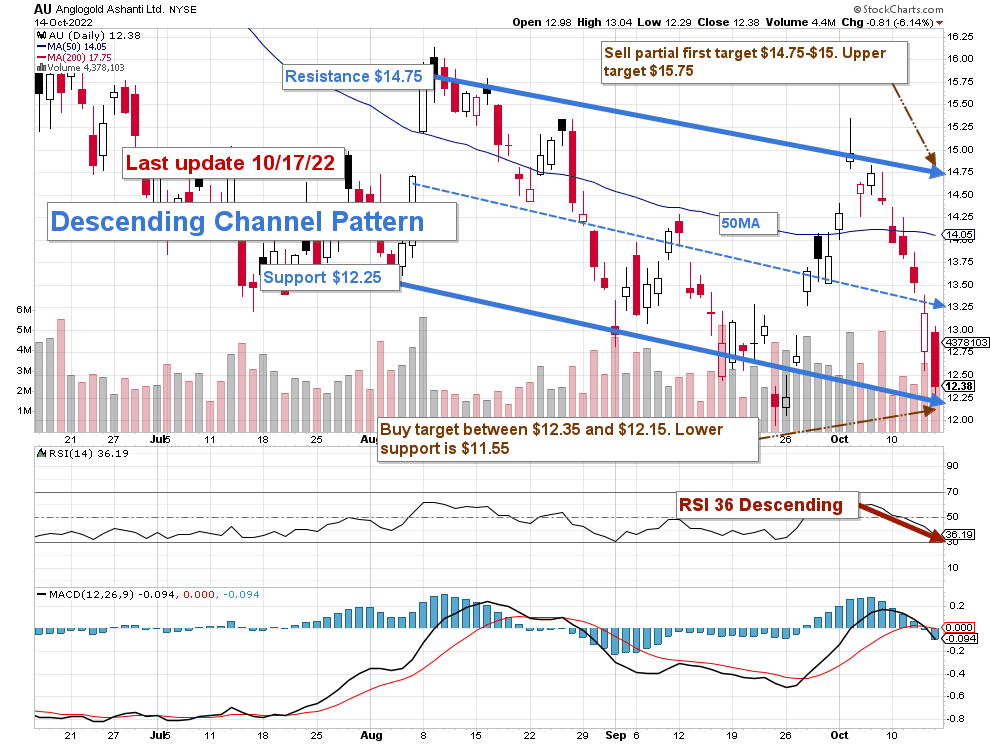
AU forms a descending channel pattern with resistance at $14.75 and support at $12.25.
The Fed acted firmly against inflation and raised the interest rate by 75 points early in July and is expected to hike the interest rate by another 75-point in November.
While inflation is a significant plus for gold, any attempt by the Fed to fight it by hiking interest will weaken the gold price and boost the $US. It is exactly what we have experienced the past few months, and it is not about to change soon.
AU Gold versus Silver 1-year basis (Fun Trading)
Thus, the general strategy has not changed for AngloGold Ashanti. I recommend trading short-term LIFO about 50%-60% and keeping a core long-term position for a final target of $18+. It is the basic strategy that I recommend in my marketplace, “The Gold and Oil corner.”
For this week, I recommend trading the channel by selling about 50%-60% of your position between $14.75 and $15 with possible higher support at $15.75 and accumulating between $12.15 and $12.35 with possible lower support at $11.55.
Note: The LIFO method is prohibited under International Financial Reporting Standards (IFRS), though it is permitted in the United States by Generally Accepted Accounting Principles (GAAP). Therefore, only US traders can apply this method. Those who cannot trade LIFO can use an alternative by setting two different accounts for the same stock, one for the long-term and one for short-term trading.
Warning: The TA chart must be updated frequently to be relevant. It is what I am doing in my stock tracker. The chart above has a possible validity of about a week. Remember, the TA chart is a tool only to help you adopt the right strategy. It is not a way to foresee the future. No one and nothing can.
Author’s note: If you find value in this article and would like to encourage such continued efforts, please click the “Like” button below to vote for support. Thanks.
Be the first to comment