

Lemon_tm
Our mission is for people to be surpassingly effective but not outrun machine-learning/AI systems in financial markets. The approach is to exploit the flaws in and users of statistical or mathematical models (e.g. Fermat and Pascal, Bayes), and instead use decision trees, as well as, grow our own collection of input-driven, fundamental predictive systems. More broadly, we aim to preserve and add competitive advantages throughout the investment process – from analysis, security selection, sizing, execution, to risk management.
All of this is utilised to generate investment returns aimed at being substantially in excess of those derived from mainstream equity strategies. When it comes to our performance focus, we believe we have plenty of competition but no peers. We are not in the business of educating but that of managing capital for those who picked us and follow the progress of their asset values.
In an era when most organisations are built with exits in mind, thereby squeezing or sweeping in as many customers as possible before ejecting, we admire organisations that have survived for over three generations and operate similarly in that we are gladly stuck with this business for the long haul without the ability to sell. We manage only one equity strategy.
GROSS INVESTMENT RETURNS
|
Calendar YTD |
Avg. Cash Weighting |
Fiscal(1) YTD |
Avg. Cash Weighting |
|
|
2018(2) |
23.1% |
35.4% |
21.1% |
30.9% |
|
2019 |
33.0% |
25.5% |
22.4% |
35.8% |
|
2020 |
43.5% |
20.5% |
26.3% |
20.8% |
|
2021 |
5.9% |
18.6% |
45.4% |
20.6% |
|
2022 |
-19.5% |
4.5% |
-36.0% |
9.0% |
|
2023 |
n.a. |
n.a. |
14.8% |
2.3% |
|
Total Return Since Inception |
100.1% |
21.9% |
||
|
Compound Annual Return |
17.3% |
|

FEATURES & PORTFOLIO ANALYTICS
|
Features |
Portfolio Analytics |
||
|
Structure |
Managed Account |
Sharpe ratio |
0.7 |
|
Administrator |
Interactive Brokers |
Sortino ratio |
1.5 |
|
Custodian / Prime Broker |
Interactive Brokers |
Annualised standard deviation |
23.2% |
|
Min. initial investment |
$1,250,000 |
Annualised downside deviation |
11.5% |
|
Min. additional investment |
Any amount at any time |
Largest monthly gain |
19.8% |
|
Qualifying criteria |
Wholesale or Qualifying |
Largest monthly loss |
-13.6% |
|
Management fee p.a. |
0.5% |
Largest drawdown |
-36.0% |
|
Performance allocation |
22-24% |
Winning month ratio |
0.60 |
|
Withdrawals |
Any amount at any time, with twenty Business Days’ notice |
Avg. cash weighting since inception |
21.9% |
|
Total return since inception |
100.1% |
||
|
Distribution |
Same as withdrawals |
Annualised return since inception |
17.3% |
|
PORTFOLIO
On this occasion, there is very little one can write or say, of any meaningful contribution or sense.
In my previous note, inflation was front and center of market participants’ minds. Today, the majority view, as determined by the weighted-average trading activity in the relevant areas i.e. the market price, is that inflation is no longer an issue.
This swing from one extreme to another is not taking place over some economic cycle or short-term credit cycle, but a mere two and a half months. Two and a half months. The journalists who were feeding the public a certain story and who were the loudest and harshest critics of various decisions and the word ‘transitory’, have begun reporting/writing about the real possibility of ‘negative inflation’ (their words, not mine).
This is the moment for introspection.
The beauty of these extreme psychological swings over a period of two and a half months, and which has been going on for over a year now, is that two months later, we could be at some other extreme. This is a huge opportunity for non-temperamental, rational investment exposures.
June was a negative month for us at -10.48%, but July was the second highest at +14.83%. For the period from 1 July to 2 August the gross return was +18.4%.
The process of triple and quadruple checking all our positions and mentally rebuying the portfolio daily continues. Our positions are all quantifiably cents on the dollar situations and where we are extremely likely to be right. It is because of this, I am confident in the positions that we hold, believe that the long run cumulative hit rate will continue to climb (previously 76%, now 81%), and the coiled nature of what we hold should turn into significant investment returns – possibly larger than anything previously achieved.
PORTFOLIO POSITIONING
At month end, the portfolio held 10 stocks – 10 listed in USA.
At month end, the portfolio had a gross exposure of 97.7%, consisting of 97.7% long and 0% short; as well as 2.3% in cash.
In terms of liquidity, the weighted average market capitalisation is A$165 billion and the stock with the smallest market capitalisation is circa A$3 billion.
CUMULATIVE GROSS INVESTMENT RETURNS
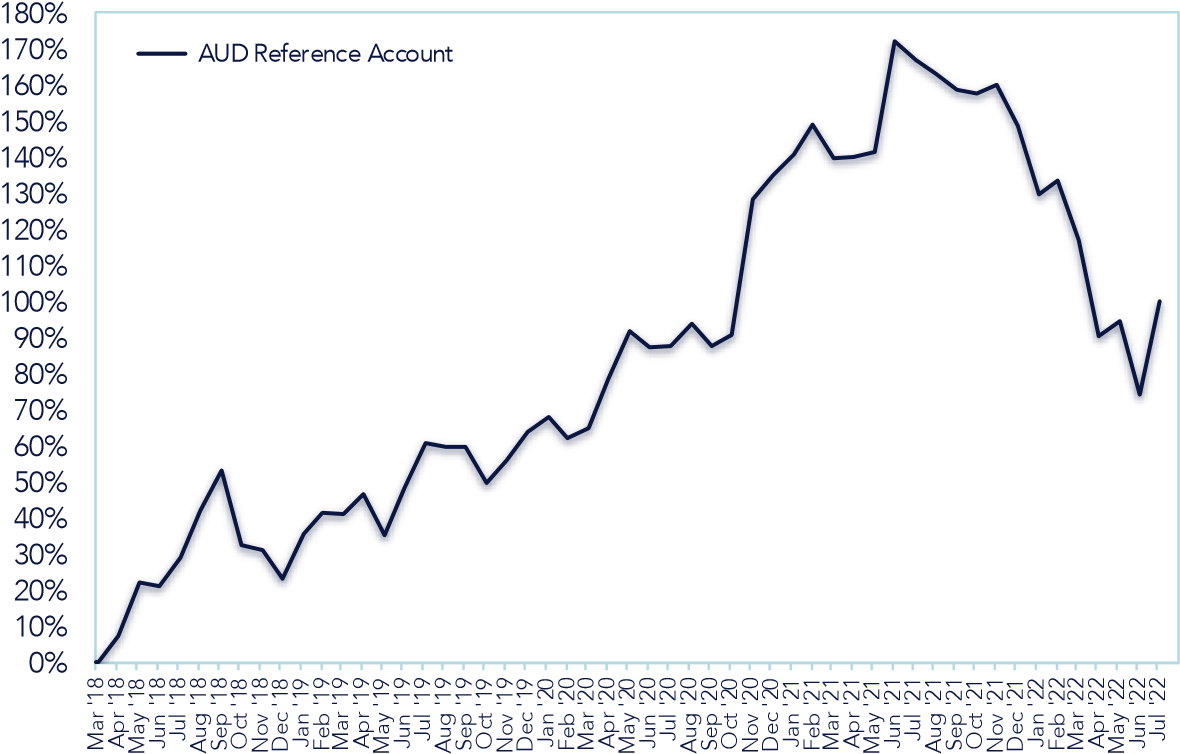
GROWTH OF AN ASSUMED $500,000 INVESTMENT IN THE REFERENCE ACCOUNT
| Date | Gross Returns |
Gross Monthly Returns |
| 27 Mar | 18 $500, | 0 |
| Mar 18 | $500,859 | 0.17% |
| Apr 18 | $536,101 | 7.04% |
| May 18 | 611,001 | 13.97% |
| Jun 18 | 605,669 | -0.87% |
| Jul 18 | $645,902 | 6.64% |
| Aug 18 | $710,053 | 9.93% |
| Sep 18 | 766,429 | 7.94% |
| Oct 18 | $662,130 | -13.58% |
| Nov 18 | $655,769 | -0.99% |
| Dec 18 | $615,634 | -6.12% |
| Jan 19 | $677,324 | 10.02% |
| Feb 19 | 707,893 | 4.51% |
| Mar 19 | $705,362 | -0.36% |
| Apr 19 | 733,917 | 4.05% |
| May 19 | 676,106 | -7.88% |
| Jun 19 | $741,201 | 9.63% |
| Jul 19 | $803,346 | 8.38% |
| Aug 19 | $797,733 | -0.70% |
| Sep 19 | $798,650 | 0.11% |
| Oct 19 | $748,230 | -6.31% |
| Nov 19 | $779,172 | 4.14% |
| Dec 19 | $818,501 | 5.05% |
| Jan 20 | $839,480 | 2.56% |
| Feb 20 | $810,870 | -3.41% |
| Mar 20 | $824,619 | 1.70% |
| Apr 20 | $893,734 | 8.38% |
| May 20 | $958,217 | 7.22% |
| Jun 20 | $935,799 | -2.34% |
| Jul 20 | $937,519 | 0.18% |
| Aug 20 | $968,929 | 3.35% |
| Sep 20 | $937,822 | -3.21% |
| Oct 20 | $953,314 | 1.65% |
| Nov 20 | $1,142,256 | 19.82% |
| Dec 20 | $1,174,271 | 2.80% |
| Jan 21 | $1,203,102 | 2.46% |
| Feb 21 | $1,244,352 | 3.43% |
| Mar 21 | $1,197,558 | -3.76% |
| Apr 21 | $1,200,664 | 0.26% |
| May 21 | $1,207,360 | 0.56% |
| Jun 21 | $1,360,798 | 12.71% |
| Jul 21 | $1,334,451 | -1.94% |
| Aug 21 | $1,316,021 | -1.38% |
| Sep 21 | $1,293,864 | -1.68% |
| Oct 21 | $1,288,297 | -0.43% |
| Nov 21 | $1,300,476 | 0.95% |
| Dec 21 | $1,243,326 | -4.39% |
| Jan 22 | $1,148,822 | -7.60% |
| Feb 22 | $1,166,565 | 1.54% |
| Mar 22 | $1,085,247 | -6.97% |
| Apr 22 | $952,339 | -12.25% |
| May 22 | $973,380 | 2.21% |
| Jun 22 | $871,340 | -10.48% |
| Jul 22 | $1,000,517 | 14.83% |
THANK YOU AND IN TOUCH
Thank you for reading this Andaz note/update. If you would like to drop us a line, please reach out using the contact form on our website Andaz®.
Yours sincerely,
Yizhong Chan
Original Post (from lettersandreviews.blogspot.com)
Editor’s Note: The summary bullets for this article were chosen by Seeking Alpha editors.
Be the first to comment