


chaiyapruek2520
There have been multiple versions of the “all-weather” portfolio suggested by various investors over the years.
In the early 1950s, the economist Harry Markowitz first championed the benefits of portfolio diversification across non-correlated assets. This ultimately led to Modern Portfolio Theory and the 60/40 portfolio, which consists of 60% stocks and 40% bonds.
The 60/40 portfolio is the ultimate lazy person’s set-it-and-forget-it, long-term investment strategy that should, in theory, produce decent returns in any economic scenario.
This year, however, has demonstrated that the scenario of high inflation and rising interest rates is very bad for both stocks and bonds. Look, for instance, at the year-to-date performances of both stocks, as measured by the Vanguard Total Stock Market ETF (VTI), and bonds, as measured by the iShares Core US Aggregate Bond ETF (AGG):
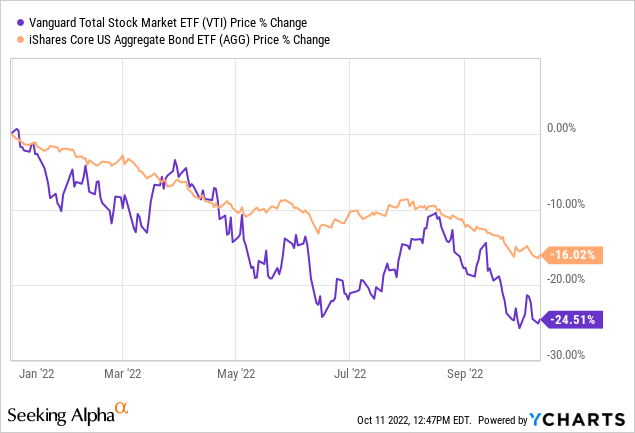
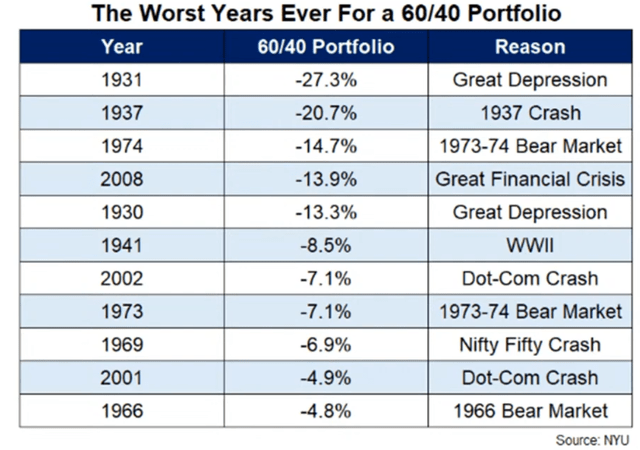
So far this year, the 60/40 portfolio is having one of its worst years ever recorded. On a weighted price basis, it has returned -21.1% in 2022. That marks this year’s 60/40 performance as one of the worst in history.
Michael Batnick
It’s unclear whether the above image shows returns on a price basis alone or a total return basis, but either way, the 60/40 portfolio has only performed worse in one period of economic history: the Great Depression.
The well-known hedge fund manager Ray Dalio suggested another option that he called an “All-Weather Portfolio.” Dalio’s version is a bit more involved than the ultra-simple 60/40 portfolio, but it is still quite simple and easy to implement.
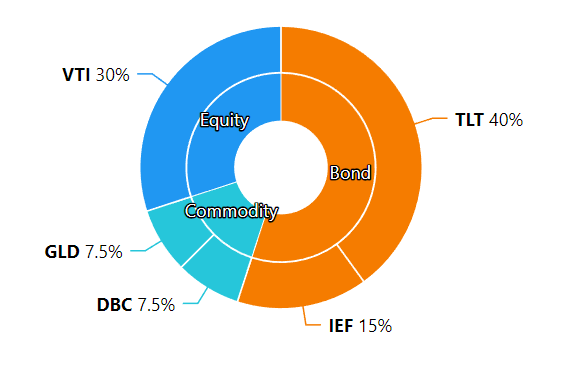
Here’s the breakdown of Dalio’s All-Weather Portfolio along with ETFs that could be used for each component:
| 40% | Long-Term Government Bonds | iShares 20+ Year Treasury Bond ETF (TLT) |
| 30% | Stocks | Vanguard Total Stock Market ETF (VTI) |
| 15% | Intermediate Government Bonds | iShares 7-10 Year Treasury Bond ETF (IEF) |
| 7.5% | Gold | SPDR Gold Trust ETF (GLD) |
| 7.5% | Commodities | Invesco DB Commodity Index (DBC) |
Portfolios Lab
Theoretically, the government bonds should perform well during disinflation (falling rates of price growth) or deflation (falling prices), whether these are caused by healthy (e.g. productivity gains) or unhealthy causes (a recession).
The equity portion of the portfolio should perform well during periods of strong economic growth, when business earnings are rising.
And the commodities should perform well during periods of high inflation, high economic uncertainty, and/or excessive government largesse.
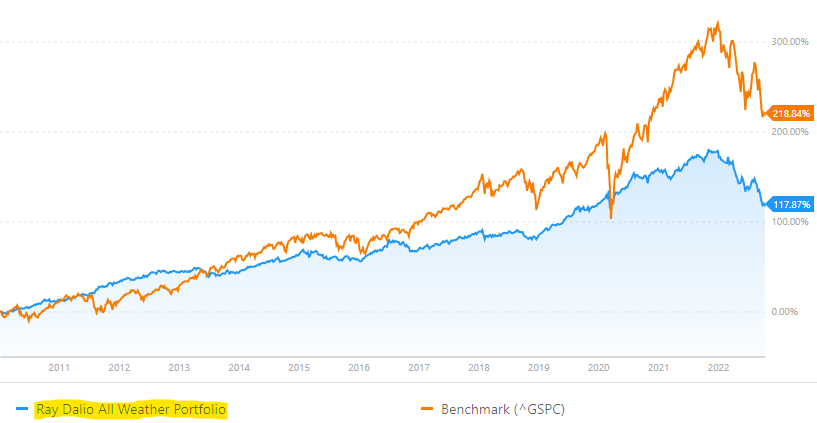
To my mind, however, the 55% exposure to government bonds strikes me as extreme. While it should reduce overall volatility in most years, it has not done so this year. In fact, it was underperforming the S&P 500 (SPY) even through most of the 2010s, a prolonged bull market and period of low volatility and inflation.
Portfolios Lab
It is also overwhelmingly geared toward low or falling inflation environments, with too little exposure to the private sector, which is the real wealth generator.
To be fair, however, I am a dividend growth investor whose primary investing goal is indefinite growth of total income. I wouldn’t mind underperforming the SPY if it meant achieving my personal goal of increasing my portfolio income year after year.
Unfortunately, neither the 60/40 nor Dalio’s All-Weather portfolio accomplish that very well. Both are heavily exposed to bonds. During periods of falling interest rates, the income from bonds should gradually decline. And during rising rates, bond prices generally decline.
Moreover, investing in broad stock funds like the VTI or SPY generally render little by way of dividend income, because they include both dividend payers and lots of non-dividend payers. And commodities like gold, of course, offer no income at all.
That makes both the 60/40 and Dalio’s All-Weather portfolio unsatisfying options for income investors.
Here is what I would humbly suggest as an alternative for investors focused on generating passive income from their investment portfolios – an “All-Weather Income Portfolio.”
A Versatile All-Weather Option For Income Investors
In order to know how to invest for all sorts of economic and market “weather,” we first need to know the different basic categories of “weather” scenarios.
I would suggest that there are four basic economic scenarios with their own characteristics and general sector/asset type outperformers:
| Economic Scenario | Characteristics | Outperformers |
| Inflationary Growth | Rising/High Inflation + GDP Growth | Residential, Self-Storage, Industrial, Farmland, Retail, Energy, BDCs |
| Disinflationary Growth | Falling/Low Inflation + GDP Growth | Net Lease, Ground Lease, Retail, Technology, Renewable Energy |
| Inflationary Contraction (Stagflation) | Rising/High Inflation + Low/Negative GDP Growth | Healthcare, Biotech, Grocery-Anchored Retail, Self-Storage, Farmland, Energy |
| Deflationary Contraction (Recession) | Falling/Low Inflation + Low/Negative GDP Growth | Long-Term Bonds, Cash, Utilities, Telecommunications, Grocery-Anchored Retail, Cons. Staples, Renewable Energy |
Now, there are exceptions to these categories, of course, and it isn’t an ironclad law of nature that the sectors/asset types suggested as outperformers in each scenario will necessarily outperform. Every period of time is unique. But I think the above grid generally holds true most of the time.
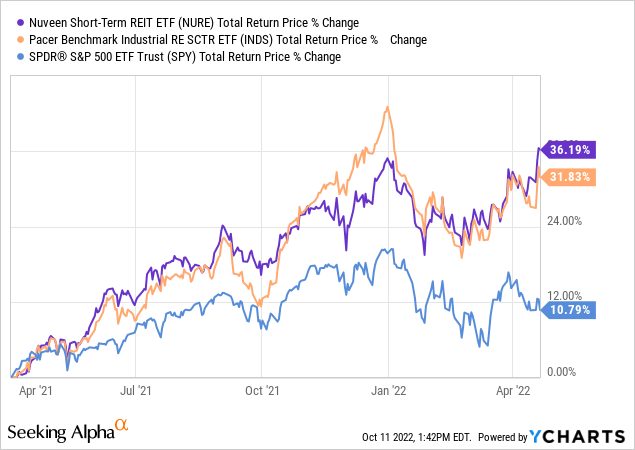
During Inflationary Growth periods, real estate types with shorter lease terms that can be frequently reset to the rapidly rising market rate should outperform. Energy is also likely to outperform along with rising oil and gas prices.
Compare the total return performances of the Nuveen Short-Term REIT ETF (NURE), which holds apartment, self-storage, and hotel REITs, and the Pacer Benchmark Industrial Real Estate Sector ETF (INDS), which holds industrial REITs, to the total returns of the SPY during the Inflationary Growth period from April 2021 to April 2022:
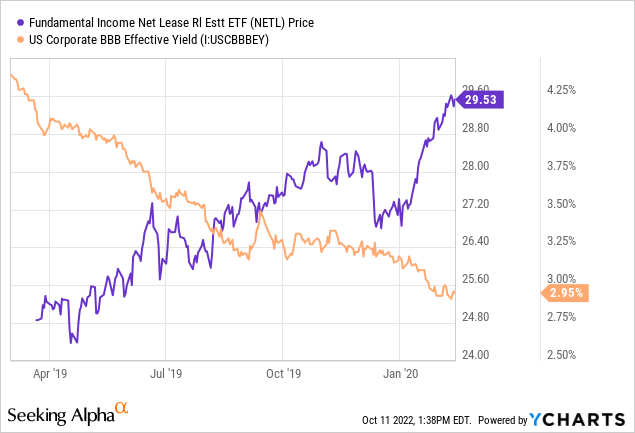
During Disinflationary Growth periods, real estate types with longer lease terms, most notably net lease, tend to outperform, because the market places higher value on revenue streams that are locked in for longer durations.
The most obvious example of this is net lease REITs (NETL) with long lease terms that have contractually fixed rents, which soared in 2019 as corporate bond yields fell:
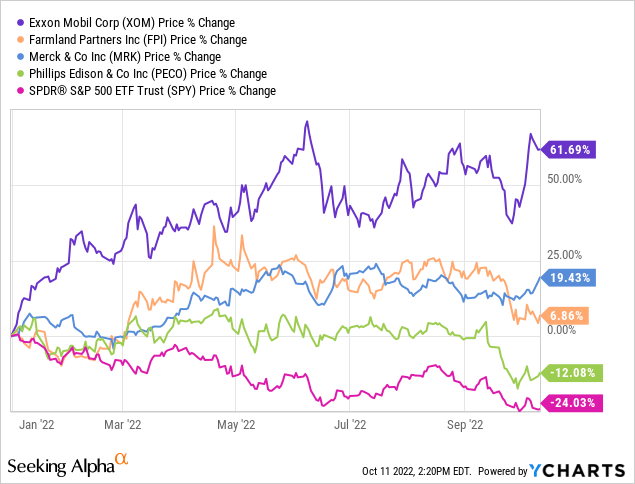
During Stagflation, necessity-based companies and property types with ample pricing power (think pharmaceutical companies, grocery-anchored shopping centers, and farmland) tend to outperform, along with energy.
Take, for example, the outperformances of Exxon Mobil (XOM), Farmland Partners (FPI), Merck (MRK), and Phillips Edison & Co. (PECO), a grocery-anchored shopping center REIT, this year as inflation has raged while real GDP growth has been negative for two quarters in a row:
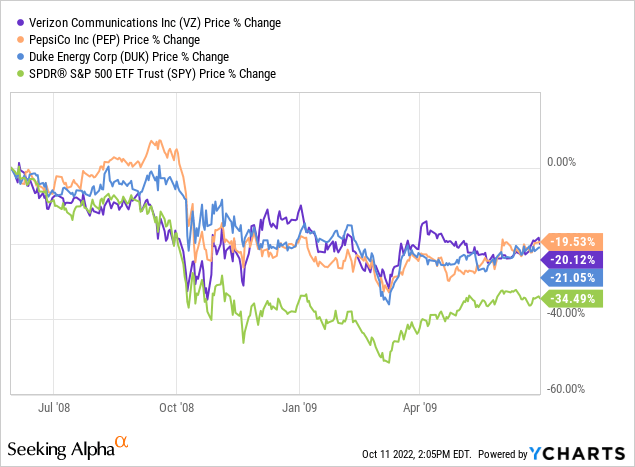
During Recession, most industries and real estate property types struggle, but bonds, cash, regulated utilities, renewable energy producers, telecommunications, consumer staples, and grocery-anchored shopping centers all tend to outperform. That is not to say that these assets will each turn in positive price performances during recessions, but they tend to outperform.
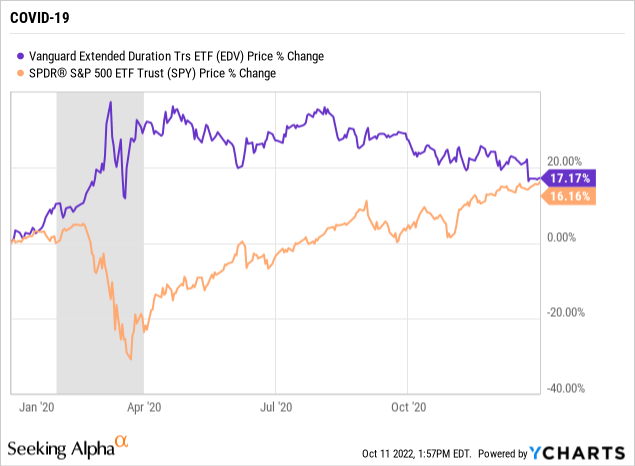
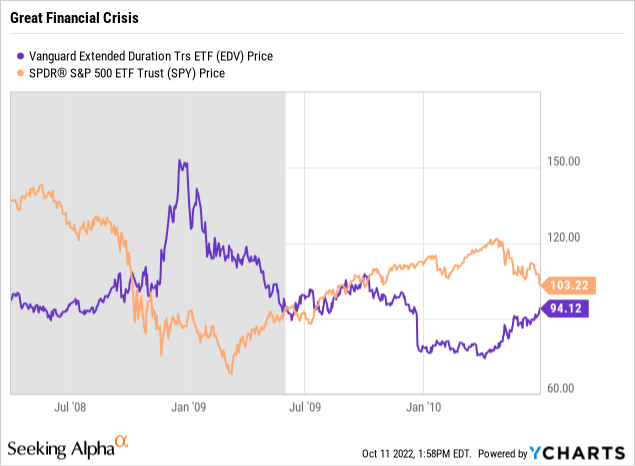
Long-term Treasury bonds, however, have an excellent track record of strongly positive performance during the initial period of recessions when the stock market is typically crashing, because Treasuries are the go-to safe haven during times of fear and uncertainty.
Notice that, during the last two recessions, the performance of the Vanguard Extended Duration Treasury ETF (EDV) has been nearly the mirror opposite of the SPY:
And even though the defensive industries like telecommunications, consumer staples, and utilities also drop during recessions, the best among them do tend to outperform. Here’s a sampling, showing the performances of Verizon (VZ), PepsiCo (PEP), and Duke Energy (DUK) through the Great Financial Crisis against the SPY:
How To Use The All-Weather Income Portfolio
So, how would one use the All-Weather Income Portfolio as presented above?
That’s the beauty of it. It’s versatile. There are any number of ways an individual investor could implement it. Everyone could design their own preferred portfolio using it as a guide and framework.
If one did not want to have any macroeconomic tilt at all, one could simply allocate 25% to each segment of outperformers.
On the other hand, if one thought that one macroeconomic scenario would dominate for the foreseeable future, one could allocate more heavily to that segment.
For instance, if one believes that we are going to endure a prolonged Stagflationary environment, then one could more heavily weight stocks and REITs in Healthcare, Biotech, Grocery-Anchored Retail, Self-Storage, Farmland, and Energy.
Alternatively, if one believes that the economy will return to a falling/low inflation and low growth environment in the not-too-distant future, then one could more heavily weight stocks and REITs in Net Lease, Ground Lease, Retail, Technology, and Renewable Energy.
Bottom Line
Unfortunately, this year has proven that there is no combination of publicly traded investment vehicles or sectors that only go up without ever suffering significant drawdowns.
But that doesn’t mean investors should not think about having balanced, well-diversified portfolios made up of various components that have differing correlations to one another. That is true for income-oriented investors such as retirees and dividend growth investors as well.
I humbly submit the above All-Weather Income Portfolio as a versatile framework to consider using. It is at least a way of thinking about one’s allocation decisions that may prove helpful in preventing one’s portfolio from becoming too heavily weighted toward one economic environment without the investor even knowing it.
But the framework is moldable and capable of evolving with new information, so I would urge you to give your feedback!
Be the first to comment