

Dzmitrock87/iStock via Getty Images
Investment Summary
We continue harvesting alpha from selective opportunities positioned across the broad healthcare spectrum in FY23. As a specialist investor in this sphere, we make a practical assessment of each name with a broad investment thesis in mind. Allocation towards pharmaceuticals’ requires that management are good stewards of capital. This is seen where new launches [drugs, therapies] are more profitable than legacy products, by estimation. The thesis being, that, incremental return on invested capital (“ROIC”) is greater than historical ROIC, creating a lengthy tail of asset returns and driving future growth with high rates of free cash flow to equity holders. We seek to answer, how much reinvestment is/was required to create future growth, and what is the return on this reinvestment. This serves as an adequate platform to unlock risk capital, in our estimation. Remember, as equity holders, our equity ‘claim’ is the residual earnings we keep in the business or the capital injection into the business. Hence, we look to see a return on both aspects.
This rubric in mind, here I’ll outline the underlying fundamentals of our buy thesis in Amphastar Pharmaceuticals (NASDAQ:AMPH). We’d first note the stock’s heavy re-rating to the downside across FY22. Investors repriced the stock heavily, and it now trades at ~13x cash flow and 18.8x trailing P/E. Despite this, we believe it is fairly valued up at ~27x forward earnings. Net-net, we rate AMPH a buy.
AMPH testing longer-term resistance
Data: Updata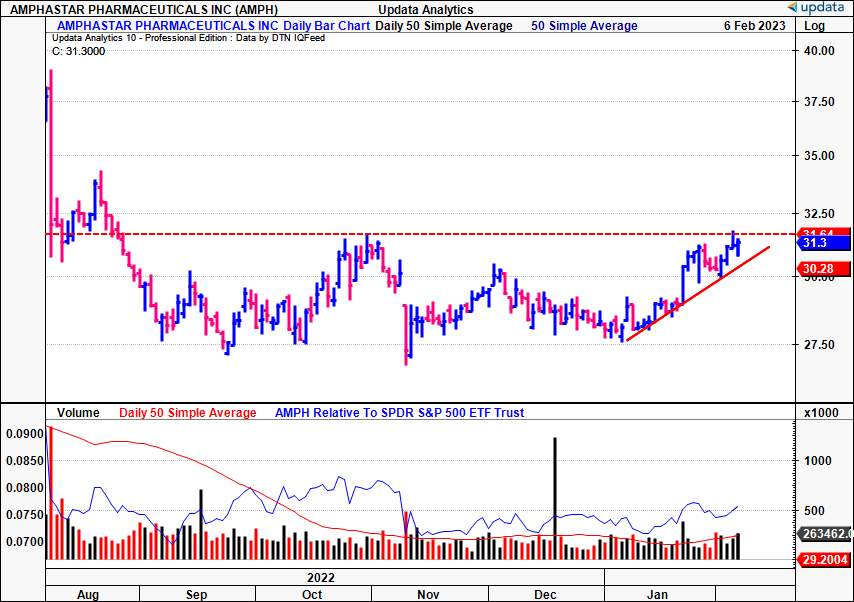
AMPH adding torque to growth engine
Here I’ll make a practical assessment of the company’s incremental growth performance and demonstrate why we believe the market has overshot its repricing on AMPH. It’s first worth noting the two standouts driving the company’s return on capital in recent years, Primatene Mist and AMPH Glucagon. The latter is AMPH’s generic rDNA response to Eli Lilly’s (LLY) glucagon emergency kit, approved in FY21. Both are indicated for the treatment of severe hypoglycaemia. In Q3 FY22, it reported net revenues of $120mm for the product. Moreover, the company’s Primatene Mist, approved in FY18, and booked 11% YoY growth to $18.4mm in Q3. The additional growth drivers currently in AMPH’s arsenal are observed in Exhibit 1a.
Exhibit 1. AMPH Primatene Mist and Glucagon pipeline
Data: AMPH Investor Presentation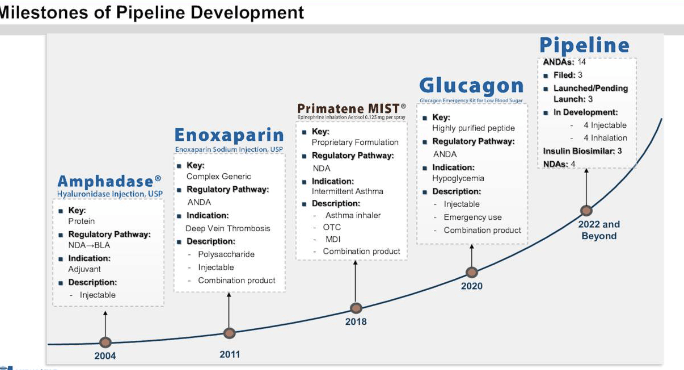
Exhibit 1a. AMPH additional growth drivers
Data: AMPH Investor Presentation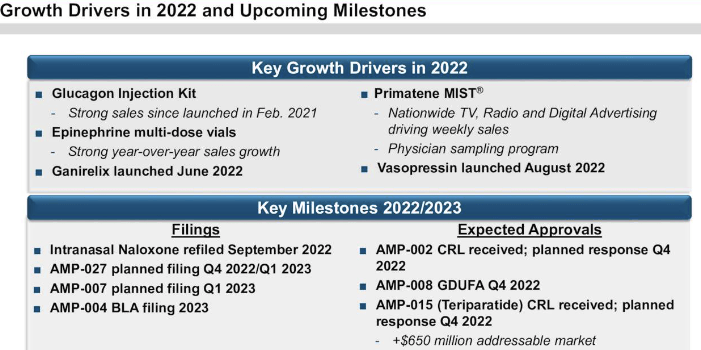
In fact, the growth curve of Primatene Mist has continued at a steep gradient from inception, staying on trend the entire time, even throughout the pandemic era.
Exhibit 2. Primatene Mist growth curve
Data: AMPH Investor Presentation
The best way to appraise this outcome, and AMPH’s ability to generate future value for equity holders, is to look deeper into the numbers by estimation. We looked at the last 2-years of trade with rolling TTM periods to do this [11 periods, 12 months each]. In the period of Q1 FY20-Q3 FY22, AMPH generated a cumulative $507mm in post-tax earnings, for an additional growth of $70mm post-tax earnings [Exhibit 3]. It also accumulated $424mm in earnings with additional growth of $25.2mm. The periodic ROIC on this shifted from 4.9% to 16% [average ~8%]. We’ll call this the historical ROIC. Note, we took the operating approach vs. the financing to calculating ROIC, seeing AMPH is lowly-geared at 0.5x leverage.
Exhibit 3. AMPH growth in NOPAT, ROIC, Q1 FY20 – Q3 FY22′ [rolling TTM figures]
Data: Author, using data from AMPH SEC Filings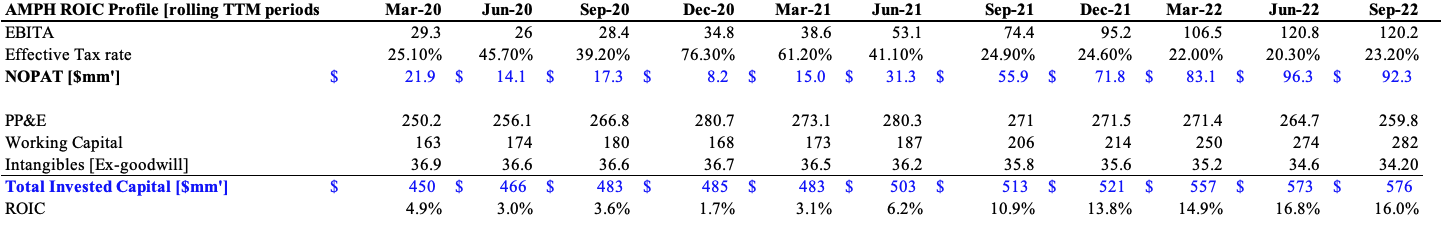
To achieve the stated level of growth, it diverted an additional $110mm in capital investment into fixed and intangible assets, resulting in an incremental return on invested capital (“ROIIC”) of 64%. This is important, as it demonstrates AMPH only had to reinvest ~22% of post-tax earnings [~25% of stated earnings] to grow. It exhibited a NOPAT growth rate of 13.8% and earnings of 16% over this time. Hence, looking at earnings, 21% reinvestment for 64% return, generating ~16.5% growth in earnings. The market values these factors, and rewarded a 3-year 16.3% geometric return in AMPH stock.
This calculus aligns with our thesis outlined earlier, that incremental ROIC>historical ROIC, illustrating the profitability of its new launches [glucagon, Primatene Mist].
Exhibit 4. AMPH incremental ROIC adding torque to growth engine
Data: Author, using data from AMPH SEC Filings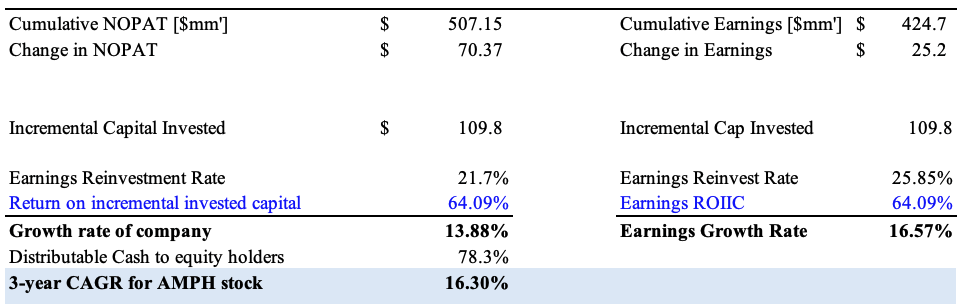
Growth is only accretive to value when the ROIC is above the cost of capital, however. To illustrate this for AMPH, see Exhibit 5, showing the positive ROIC/WACC spread per period [the economic profit] since Q3 FY21. Hence, growth has come cheaply for equity holders, AMPH is investing in high-growth opportunities, seeing strong return, growing post-tax earnings, incremental ROIC>historical ROIC, and ~75-80% of post-tax earnings are distributable to equity holders.
Exhibit 5.
Data: Author, using data from AMPH SEC Filings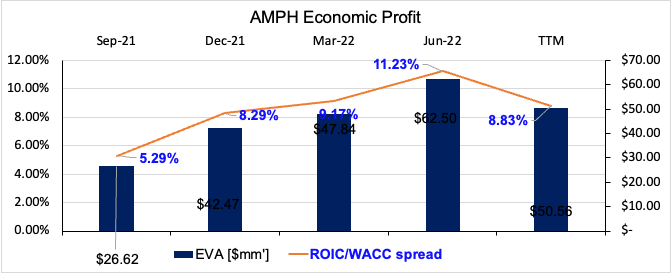
Valuation and conclusion
We’ve been able to filter out most of the noise and remain objective in judging AMPH’s propensity for growth with the analysis above. The stock is trading at 19x forward earnings [non-GAAP]. Using the calculus described earlier, including reinvestment rates, earnings growth, and ROIIC, we believe this is undervalued. We presume AMPH can carry these percentages through into the coming 5-years. Including the authorized $50mm buyback, we see AMPH fairly valued at 26.7x forward earnings. The cost of equity is calculated as 19% via the growth rates and earnings yield, per Richards (1991). Looking at trailing earnings, we see it valued at 33.5x P/E.
Exhibit 6. Forward P/E estimate carrying growth, reinvestment rates through to FY28′
Data: Author’s estimates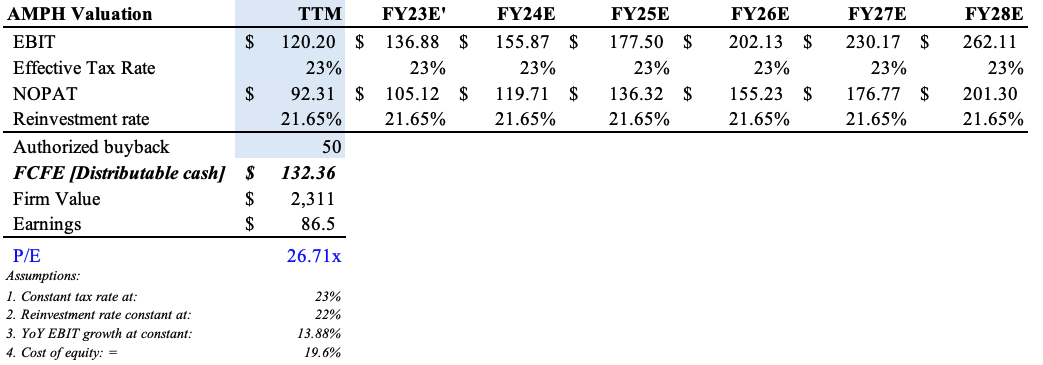
Exhibit 7. Trailing P/E estimate, as above
Data: Author’s estimates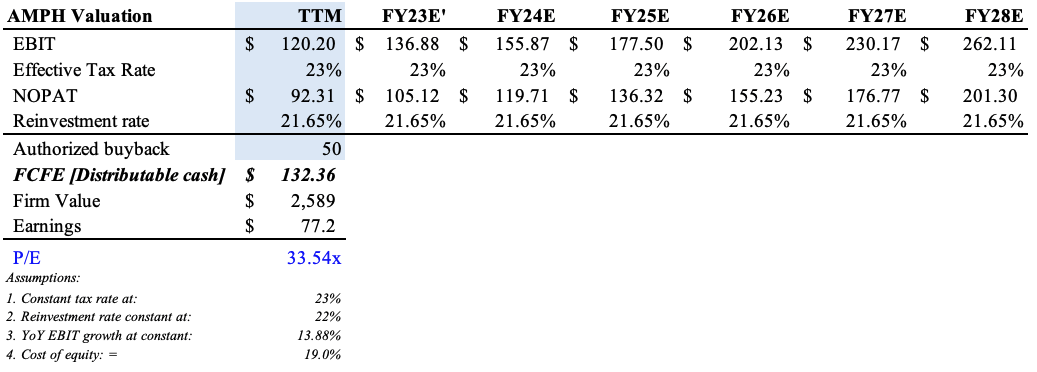
The market has yet to extrapolate AMPH’s incremental growth momentum and returns on capital, by estimation. We feel it has scope to re-rate to ~26x forward earnings and look for the stock to push to these levels. With this practical assessment of the company’s investment decisions, we estimate AMPH to create meaningful value for shareholders into the coming years. Net-net, rate buy.
Be the first to comment