

gchapel/iStock via Getty Images
We’re nearing the end of the Q4 Earnings Season for the Silver Miners Index (SIL), and one of the most recent companies to report its results is Americas Gold & Silver (NYSE:USAS). Overall, the company had another pitiful year, reporting revenue of ~$45 million and a net loss of ~$160 million following a write-down at what was supposed to be its new primary asset: Relief Canyon. With Cosala back online, Americas Gold & Silver (“AG&S”) is calling for significant growth going forward, but on closer inspection, this is not growth, simply a recovery of lost production. Given the history of steady share dilution and a poor track record of growth per share, I continue to see AG&S as uninvestable.
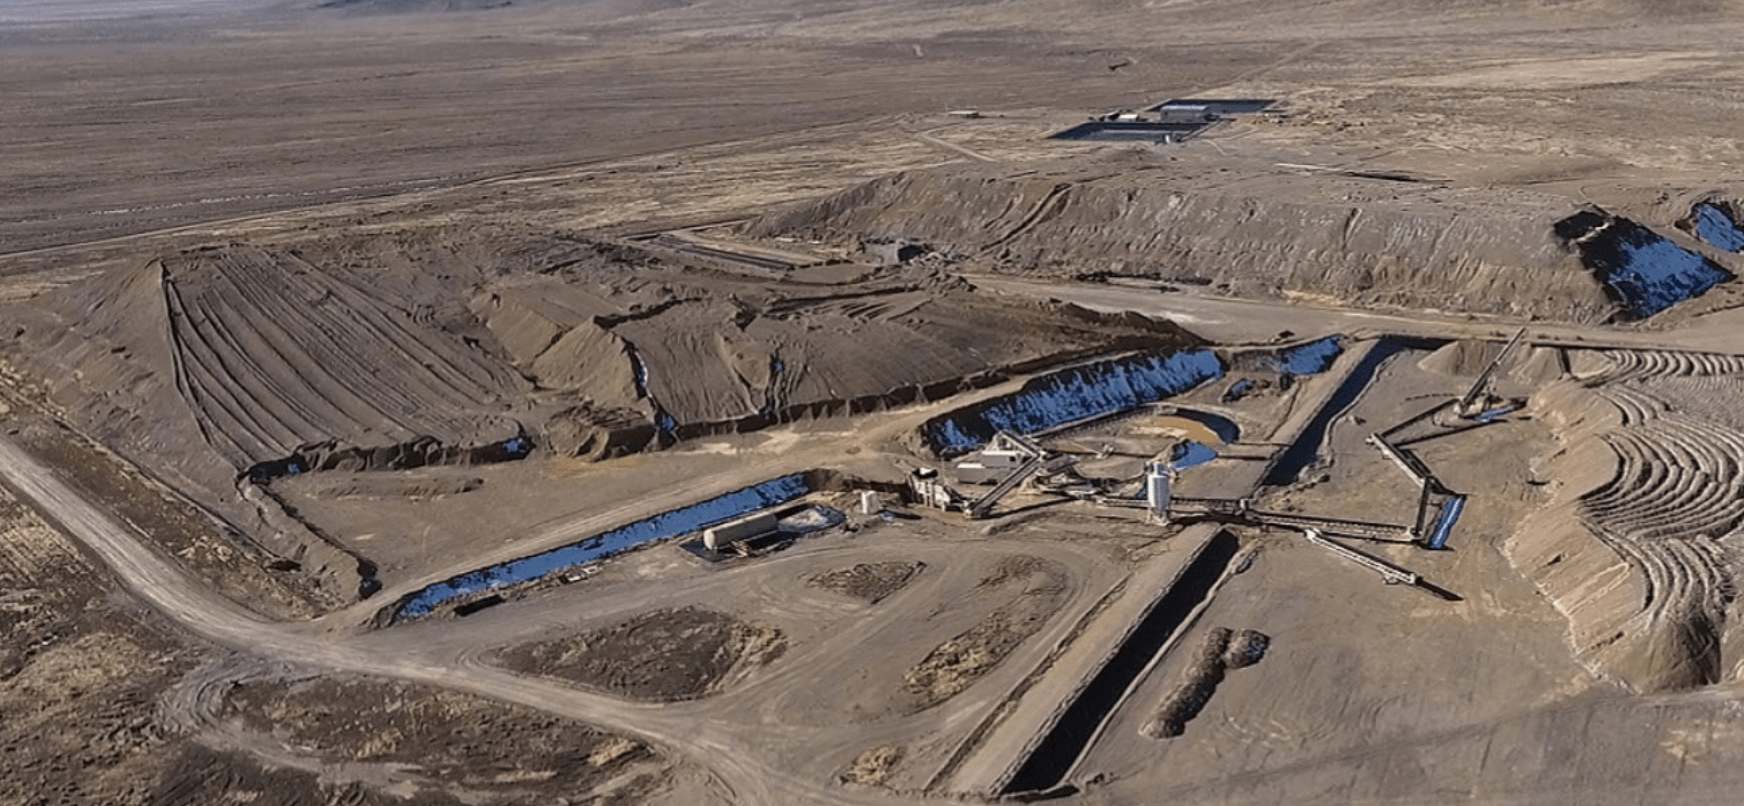
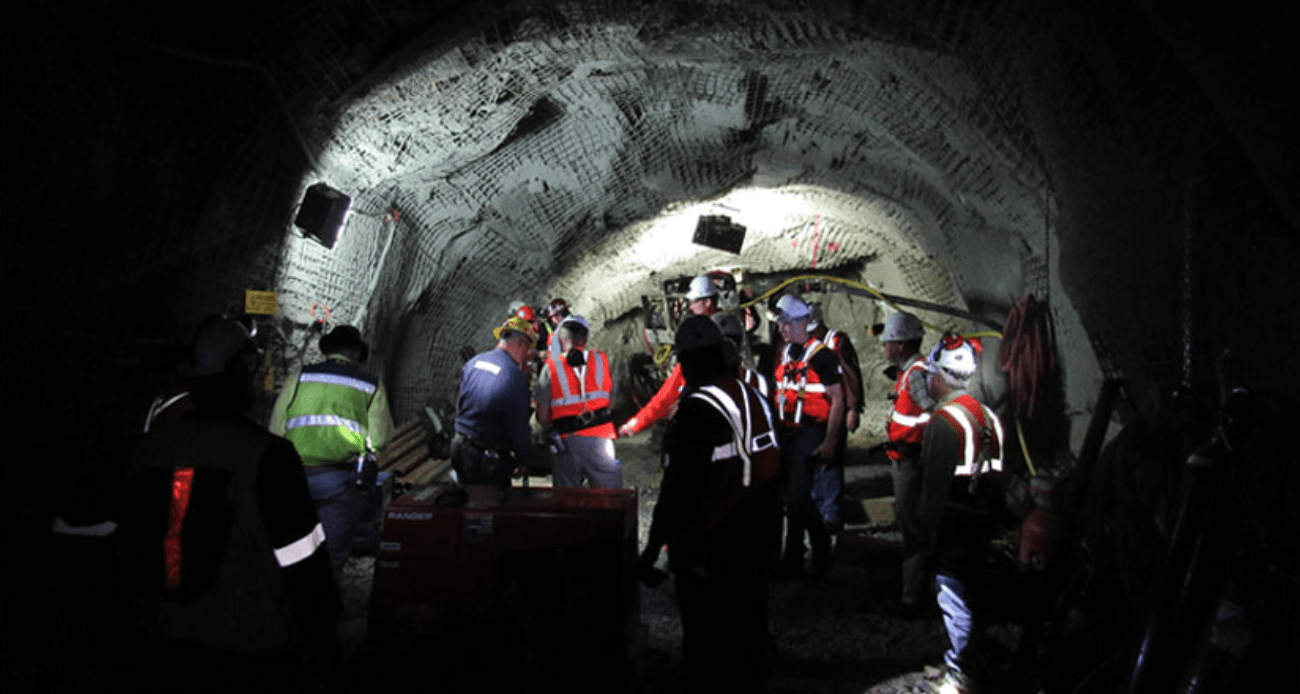
Relief Canyon Operations (Company Presentation)
AG&S released its Q4 and FY2021 results last week, reporting annual production of ~1.5 million silver-equivalent ounces [SEOs], or ~670,000 ounces of silver, 4.2 million pounds of zinc, and 12.9 million pounds of lead. This translated to revenue of $44.8 million and a net loss of $160.6 million, compared to revenue of $27.9 million and a net loss of $30.1 million in FY2020. A massive impairment drove the increase in net losses at what was supposed to be a game-changing asset for the company: Relief Canyon. After adjusting for this, the company still lost $37 million for the year. Let’s take a closer look at the results below:

Americas Gold & Silver – Quarterly Revenue/Net Income/Loss (Company Filings, Author’s Chart)
As shown above, it was another difficult year for AG&S, with the company reporting less than $45 million in revenue, a massive decline from ~$58 million in FY2019 and ~$68 million in FY2018. While some of the production declines were due to the company’s Cosala operations being in care & maintenance for the majority of the year (illegal blockade began in Q1 2020), Relief Canyon should have more than made up for this headwind. This is because this new mine in Nevada that the company brought into commercial production in early 2021 (several months behind schedule) was supposed to be a game-changer.
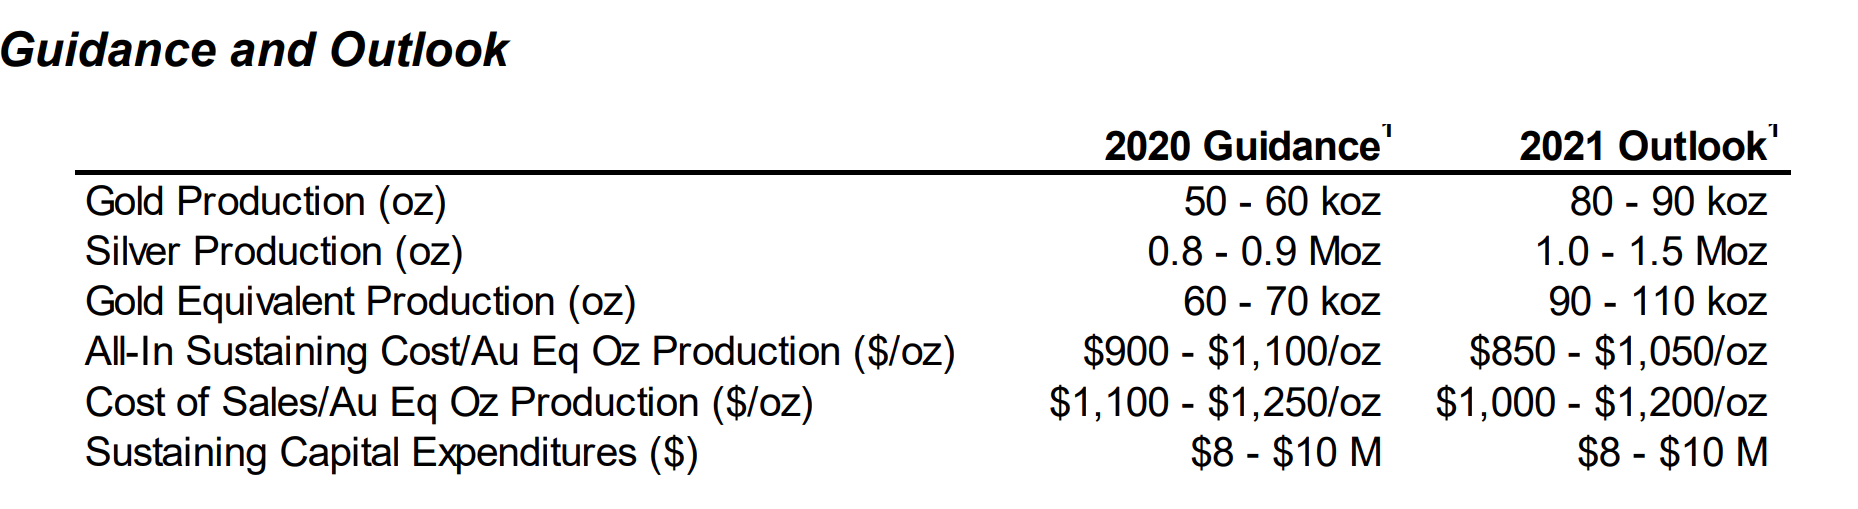
Company Guidance (Company Filings, Management Discussion & Analysis)
According to AG&S, Relief Canyon (more appropriately named “Headache Canyon”) was supposed to produce more than 50,000 ounces of gold in FY2022 and over 80,000 ounces of gold in FY2021, moving the company to the upper ranks of the junior producer space. However, two years after the initial timeline for commercial production, Relief Canyon has not only missed these estimates by more than 80%, with less than 9,000 GEOs produced per annum, but operations have been suspended as of August 2021. This is related to technical challenges related to the deposit’s metallurgy, with the company identifying naturally carbonaceous material within the pit that was not recognized in the Feasibility Study.
It’s important to note that following the merger with Pershing Gold in 2018, Americas did not complete its own independent Feasibility Study on the project and simply went straight ahead to construction. At the same time, putting significant eggs in the future gold focus for the company, AG&S parted with ~40% of its Galena Complex ownership, creating a strategic 60/40 joint-venture. Fortunately, the Galena Complex in Idaho is seeing better production since the Recapitalization Plan. Still, the suspension of operations at Relief Canyon has put a gaping hole in what should have been a nearly ~130,000-ounce per annum gold-equivalent profile.

Galena Complex – Idaho (Company Website)
The good news is that Cosala is finally back online in Mexico after an ~18-month shutdown, with the startup delayed due to COVID-19. AG&S noted that the operation has ramped up to nameplate capacity in December, and concentrate shipments have resumed. Meanwhile, at Galena, the asset had a solid year, with annual production of ~1.75 million silver-equivalent ounces [SEOs]. This was up slightly from FY2020 levels (~1.71 million SEOs), with higher silver and lead recovery rates and higher silver/lead grades, offset by slightly lower throughput. Based on a planned hoisting upgrade, the goal is to push annual production to ~2 million ounces of silver in 2023.
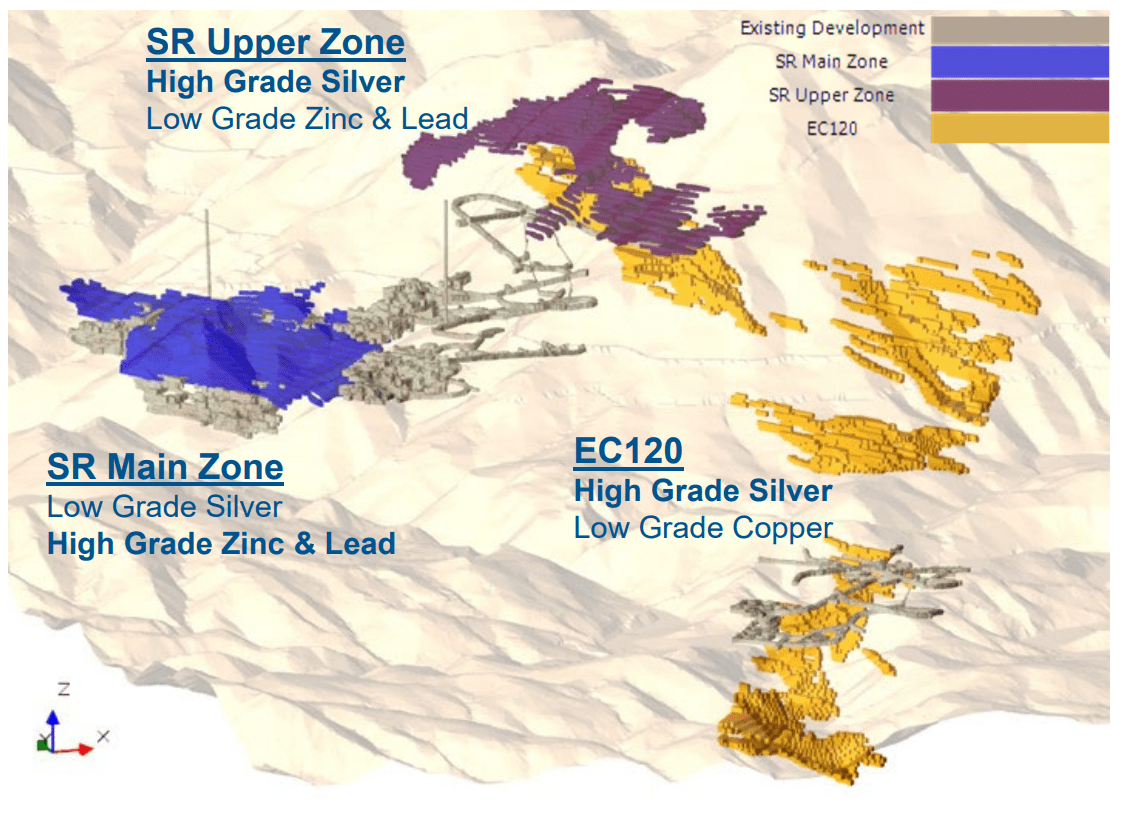
Cosala Operations (Company Presentation)
Meanwhile, at Galena, AG&S hopes to begin production at the Upper Zone by year-end, where silver grades are much higher. This is forecasted to push annual silver production to more than 2.5 million ounces per annum, up from guidance of ~0.80 million ounces of silver for FY2022. Combined with ~0.80 million ounces of attributable silver production from Galena this year, this is expected to result in silver production of ~1.6 million ounces, a significant increase from last year.
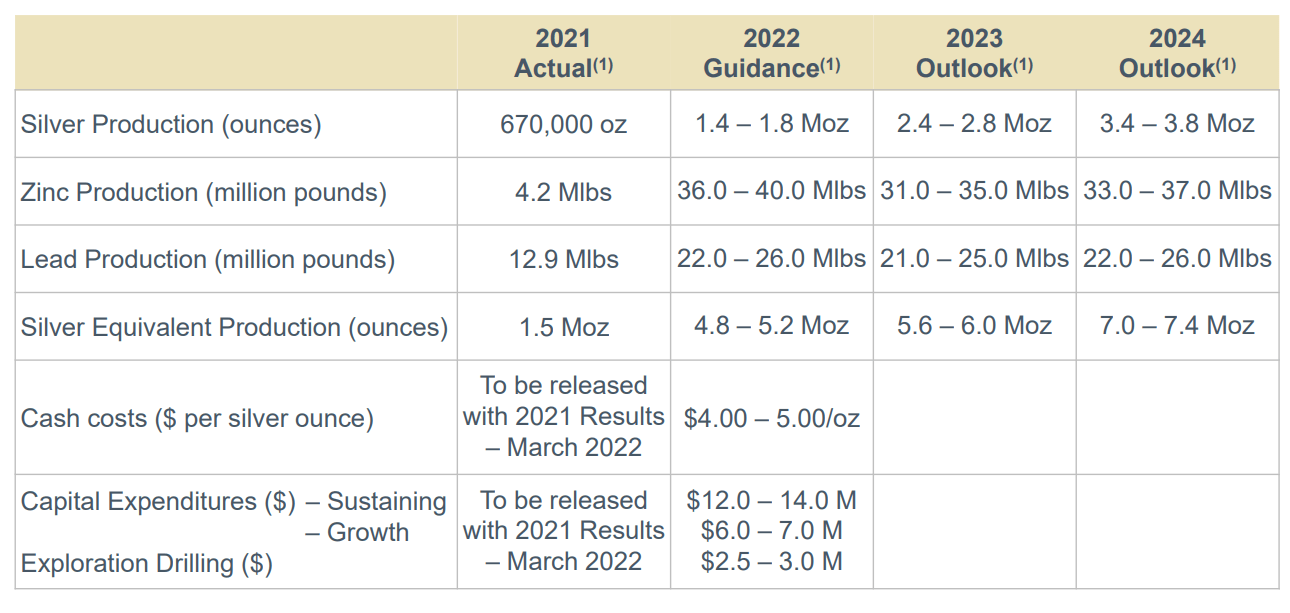
2021 Production & Forward Guidance (Company Presentation)
Based on this increase in production, AG&S has labeled itself a “high-growth, silver-focused company,” noting that it will grow silver-equivalent ounce [SEO] production by more than 200% this year and more than 350% by FY2024. While the company is correct that production is set to increase, I think it’s a stretch to call this growth. This is because if we look at the company’s long-term production chart below, we can see that guidance of ~5.0 million SEOs in FY202 and ~6.0 million SEOs in FY2023 is actually below the FY2018/FY2019 2-year average production profile of ~6.06 million SEOs. Hence, this is simply a recovery to the old production profile, but hardly long-term growth.
For this reason, I believe it’s misleading to call this a growth profile or to call the company a “high-growth, silver-focused company” when we should see zero production growth on a 5-year basis (2018-2023) even if the company manages to meet its FY2023 guidance. Given the company’s abysmal track record of meeting guidance, I wouldn’t say this guidance is in the bag either.
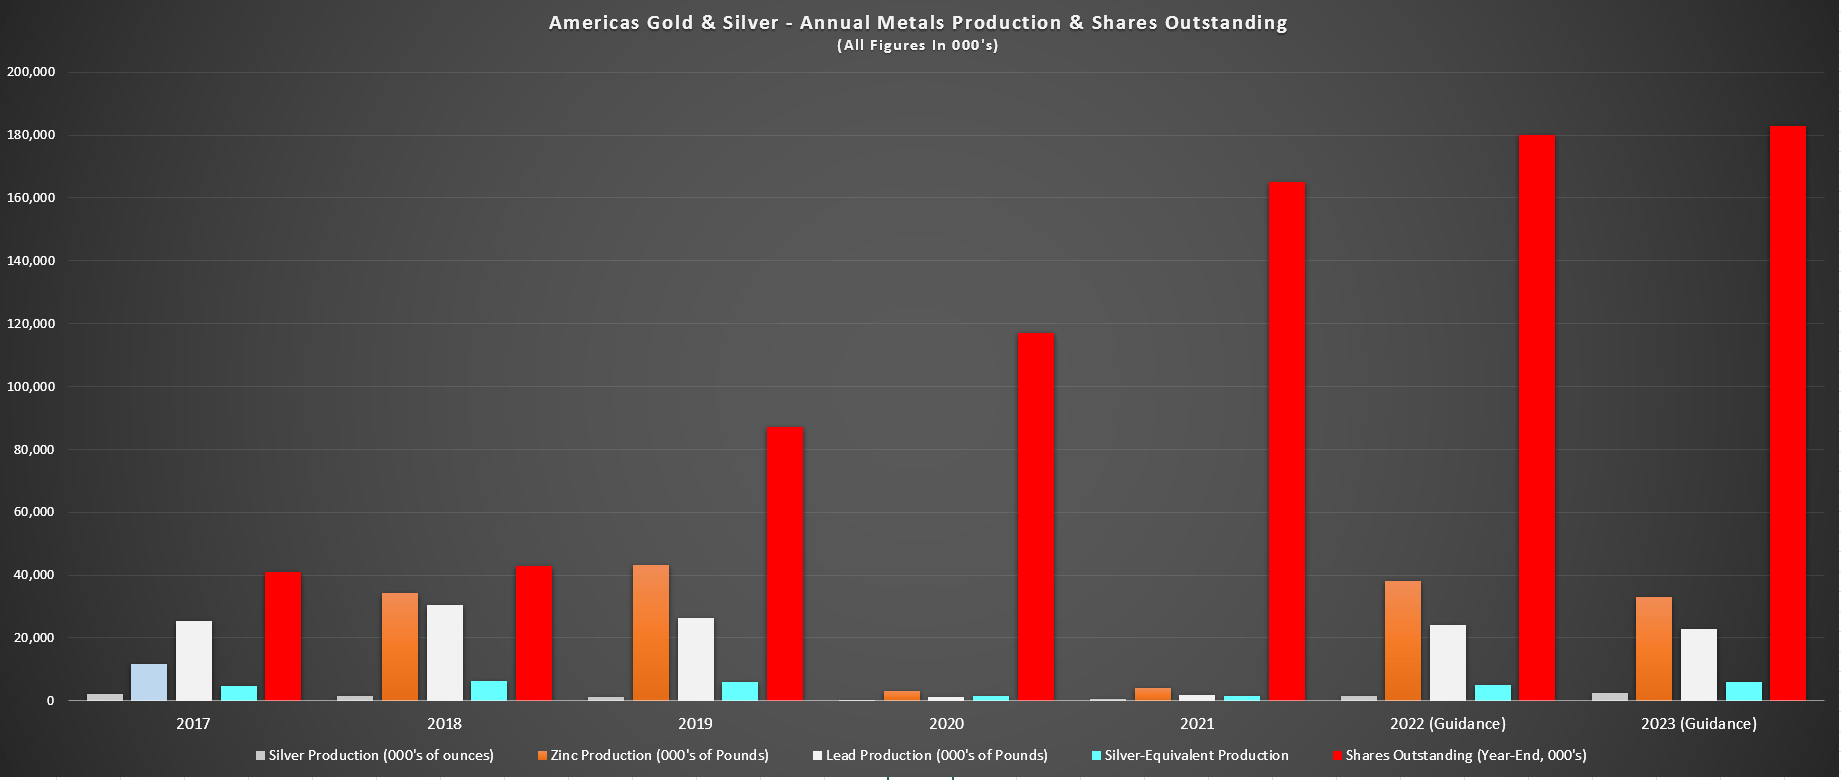
Americas Gold & Silver – Annual Metals Production & Shares Outstanding (Company Filings, Author’s Chart)
Some investors might argue that while we are not seeing long-term production growth, we are seeing growth from this much lower starting level, and this should catapult the stock higher after its 80% decline. Assuming a constant share count or minimal share dilution, this wouldn’t be an unreasonable assumption to make. However, as the above chart shows (red bars), AG&S has seen ~290% share dilution since FY2018 (43 million shares), ending the year with ~165 million shares.
Americas Gold & Silver – Share Count (Company Filings, Author’s Chart)
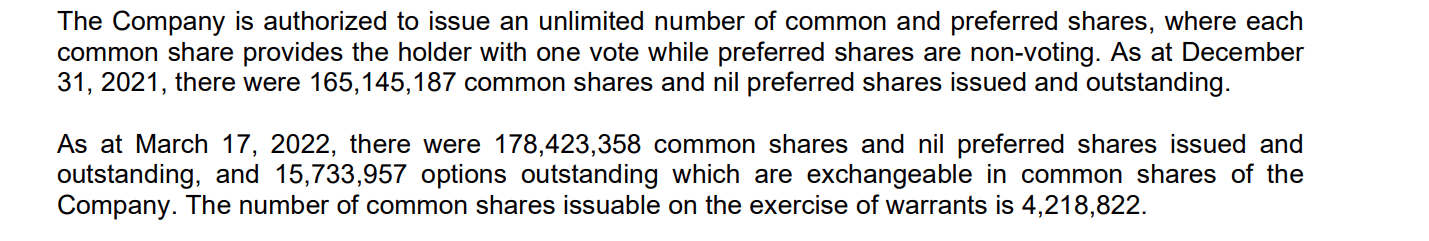
As of the time of this article, this share dilution figure has increased to more than 310%, with ~178 million shares outstanding and ~198 million fully diluted shares. Hence, the share structure is not even remotely comparable to 2018 levels, and there’s no reason to believe that the stock should trade back to $4.00, or even $3.00, given that it would trade at three times the market cap despite similar production.
Worse, AG&S has an obligation to deliver more than 5,500 ounces of gold to Sandstorm (SAND) per year under its fixed gold delivery agreement over the next four years. Given that Relief Canyon is contributing any meaningful production due to suspended operations, the company must spend capital to buy these ounces to deliver under the agreement. So, not only is AG&S’ share structure in much worse shape, but it also has additional obligations that it did not have several years ago in 2018 when production peaked.

AG&S – Silver-Equivalent Ounce Production Per Share Held (Company Filings, Author’s Chart)
Finally, if we look at production per share, which is arguably the most important metric, AG&S gets an F on its report card. As shown above, even if the company manages to meet production guidance in FY2023, we have seen a massive decline in production per share. This is based on the fact that investors were getting approximately 0.15 silver-equivalent ounces [SEOs] per share held in FY2018, calculated by dividing its annual production of ~6.2 million SEOs by ~43 million shares outstanding. As of FY2023, assuming the high end of guidance and only a slight increase in the share count (~183 million shares outstanding), investors will be getting less than 0.04 SEOs per share held.
This is one of the worst production per share trends sector-wide, suggesting that if AG&S was seeing growth in production from FY2018 levels looking out to FY2023, the production growth has come at the expense of a much more bloated share count. This explains the company’s pathetic earnings trend below, which shows net losses per share for several consecutive years. Overall, this does not inspire much confidence in management, and with less than $10 million in cash, I wouldn’t rule out further share dilution by 2023, even if the company is free-cash-flow positive at current levels.
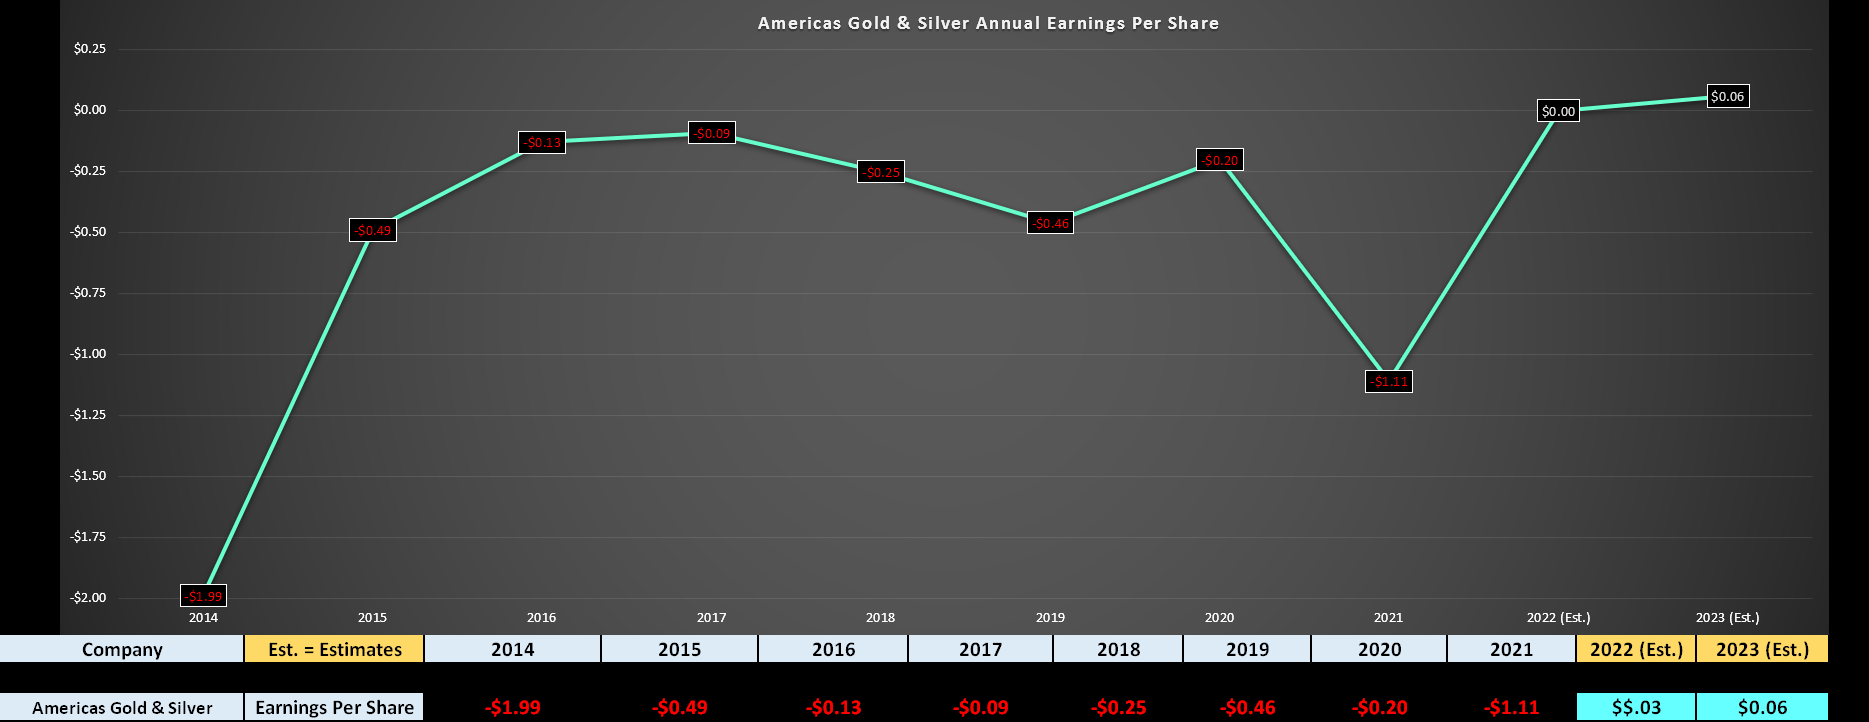
Americas Gold & Silver – Earnings Trend (FactSet.com, Author’s Chart)
Valuation & Technical Picture
Looking at the earnings trend above, we can see that AG&S is forecasted to post positive annual EPS in FY2022 and FY2023, with estimates currently sitting at $0.03 and $0.06, respectively. However, even if we assume that the company meets FY2023 estimates of $0.06, the stock still trades at more than 17x next year’s earnings estimates. This is an expensive valuation for a relatively small producer with a track record of steady share dilution when there are actual growth stories out there for much more reasonable valuations sector-wide.
Meanwhile, the company highlights that it trades at less than 0.60x P/NAV based on weekly comps in February vs. an average multiple of 1.10x for senior silver producers. While this might suggest that the company is undervalued, I would argue that this discount to its peer group is about right for a company that has diluted shareholders at a compound annual rate of ~40% since FY2017. So, while AG&S may look cheap at first glance, I believe it’s cheap for a reason.
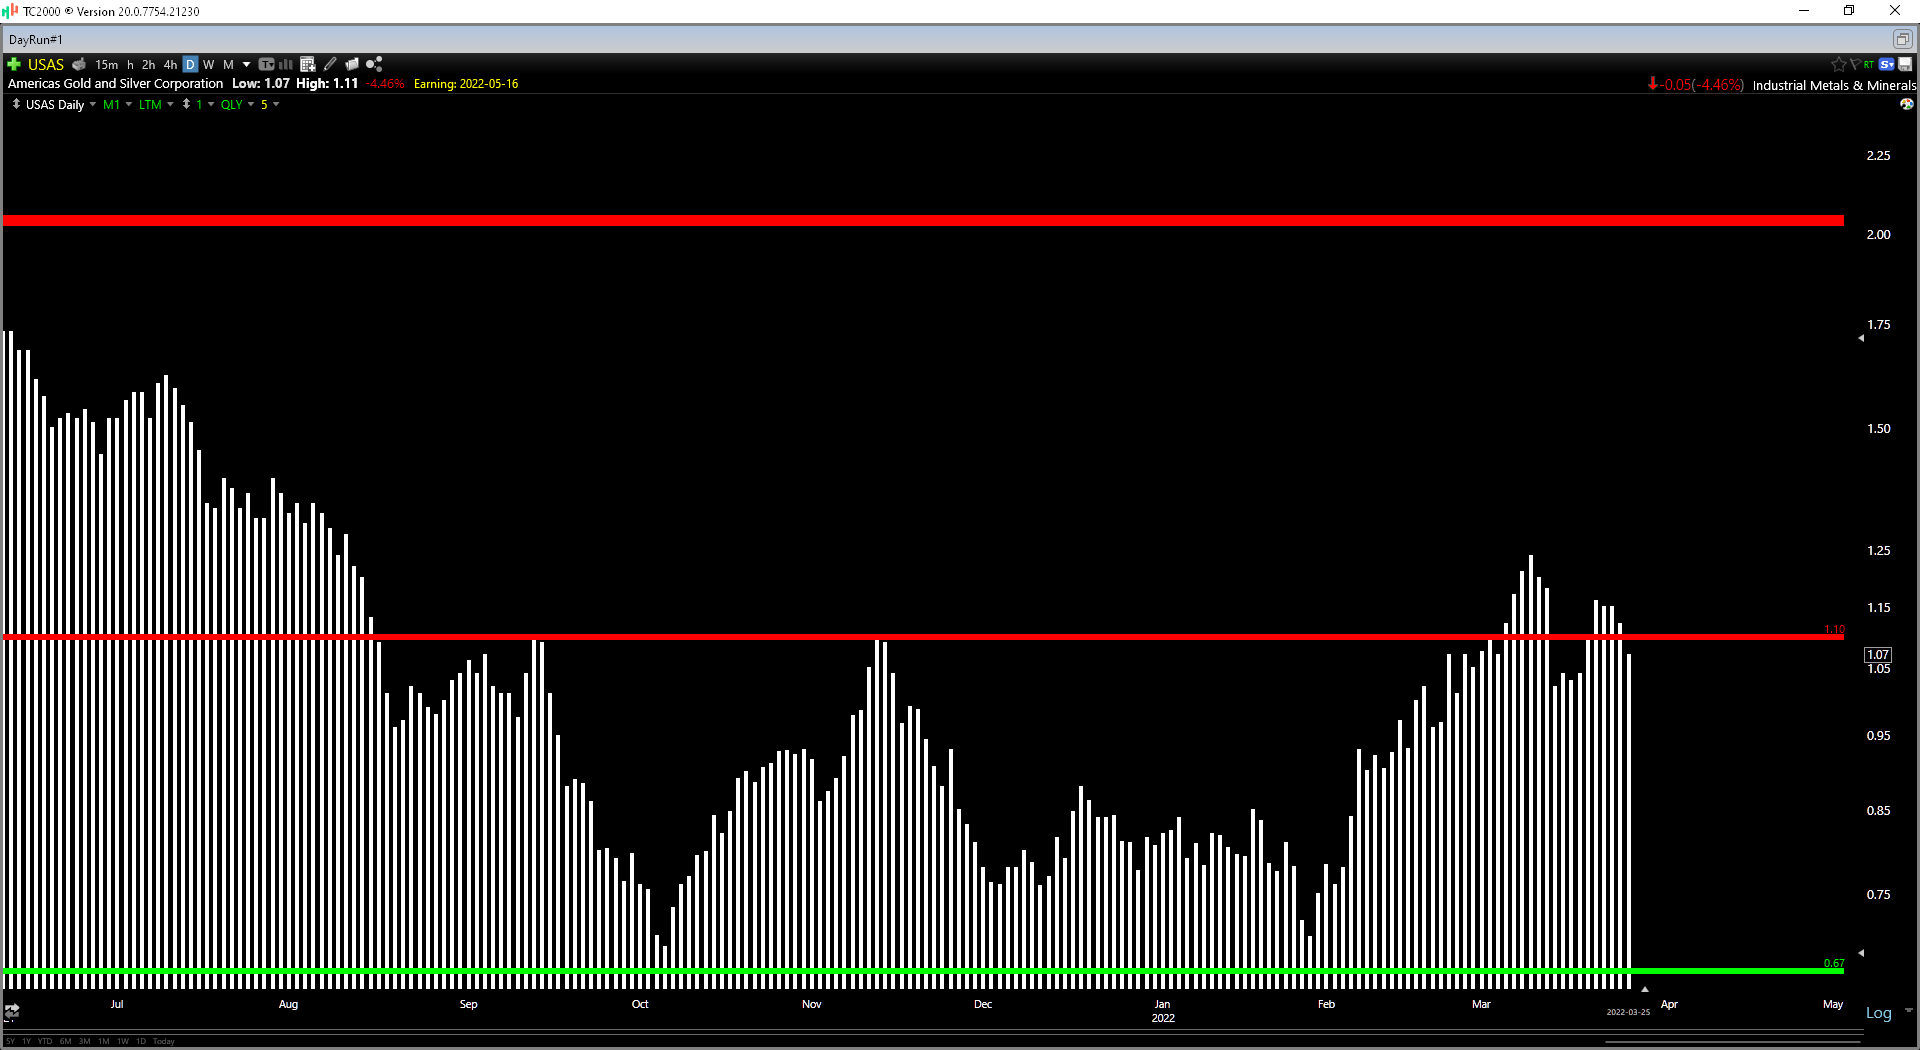
USAS Daily Chart (TC2000.com)
Finally, if we look at the technical picture, we can see that AG&S has recently rallied sharply off its lows, and it’s now trading in the upper portion of its expected trading range. This is based on resistance at $1.10 and support at $0.67. Based on a current share price of $1.07, this translates to less than $0.05 in potential upside to resistance and $0.40 in potential downside to support or a reward/risk ratio of 0.10 to 1.0. The unfavorable reward/risk ratio suggests an elevated risk of buying the stock at current levels, corroborating the view that this is not a low-risk buy point.
Cosala Operations (Company Filings, Author’s Chart)
While it may be tempting to buy a miner that’s more than 70% off its highs, I believe this would be a mistake. This is because the way to make money consistently in this sector is by buying high-quality companies at the right price, not low-quality companies when they’re out of favor. One example of this is Pure Gold (OTCPK:LRTNF), which I’ve warned about for months, proving that buying low-quality companies low carries elevated risk. To summarize, I see AG&S as an inferior way to buy the recent sector-wide dip, and I continue to see the stock as uninvestable.
Be the first to comment