


Kiwis
Introduction
We review our Hold rating on American Express Company (NYSE:AXP) after shares stagnated in the two months following our last update, despite supposedly positive Q3 2022 results on October 21 where full-year guidance was raised.
We initiated our Hold rating on AXP in March 2019, stating our view that its shares should be avoided. Since then AXP shares have gained 43%, behind Mastercard (MA) (which gained 49%) but ahead of Visa (V) (which gained 38%). That AXP did not do better despite starting with a much lower P/E (15x vs. 29x and 36x for the card networks) is a continuation of the “growth beats value” pattern that we highlighted for 2013-18 in a past article.
|
AXP Share Price vs. Mastercard & Visa (Last 5 Years) 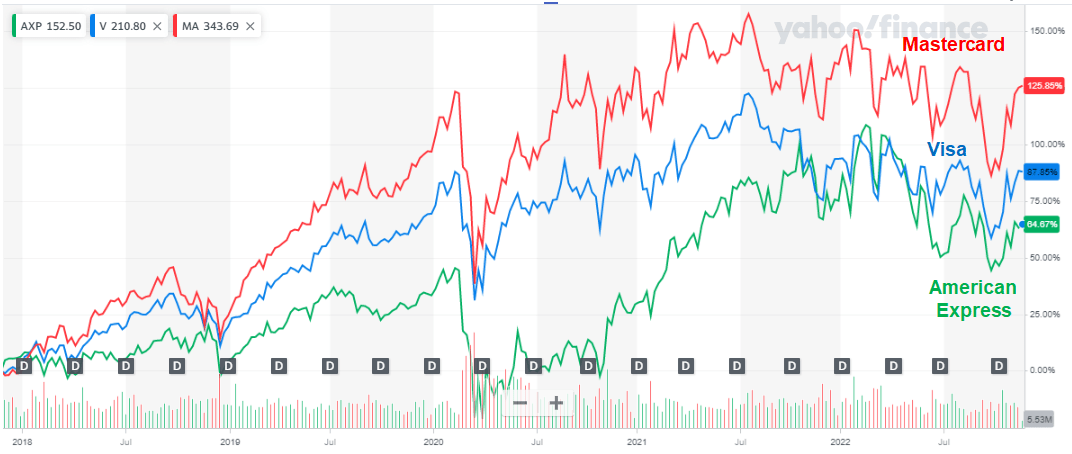 Source: Yahoo Finance (23-Nov-22). |
AXP bulls tend to focus on its current 15.5x P/E and targeted mid-teens EPS CAGR from 2024. However, a lower starting P/E has not stopped AXP from underperforming Mastercard and Visa year-to-date. AXP had already rebased its earnings downwards in the past few years and may do so again. The need to spend more on members and marketing means that AXP earnings are barely above their pre-COVID levels, in sharp contrast to strong double-digit growth at Mastercard and Visa. Year-on-year growth rates in recent quarters are not indicative, having been driven by the post-COVID recovery in Travel & Entertainment and a one-off release in capital. AXP’s P/E is also flattered by historically low credit costs that could easily reverse in the event of a U.S. recession. Avoid.
Recap: Why We Avoid American Express
We have avoided AXP because of what we see as structural weaknesses in its business model, including:
- Competition in credit cards is fierce, and AXP mainly attracts customers through rewards and co-brand partners, which competitors can match if they spend enough; this has led to escalating costs for AXP
- AXP’s closed-loop network means it bears the full costs of competing with card-issuing banks, and finds it harder to develop new flows, build a value-add services business or collaborate with Fintech players
- AXP has few sources of growth outside its core consumer and SMB franchises, and its chosen growth areas of premium card fees and cardmember loans are by nature relatively low-margin and capital-intensive
- AXP is more exposed to a future U.S. economic downturn, since the U.S. is more than 70% of its Pre-Tax Income, and its lending activities would be vulnerable to the eventual normalization in loan losses
Recent results look strong next to pandemic-disrupted prior-year comparables, but AXP shares have underperformed.
What AXP Bulls Count On
AXP bulls tend to focus on its current 15.5x P/E and targeted mid-teens EPS CAGR from 2024.
Management raised its 2022 guidance at Q3 results, and now expects full-year EPS to be “above” its original range of $9.25-9.65. Current 2022 consensus EPS estimate is $9.93, which implies a 15.5x P/E multiple.
Management continues to guide to “long-term growth plan aspirations” of 10%+ revenue growth and mid-teens EPS growth from 2024, and a 2023 that has higher growth than these thanks to the rebound from COVID-19:
|
AXP Mid-Term Targets 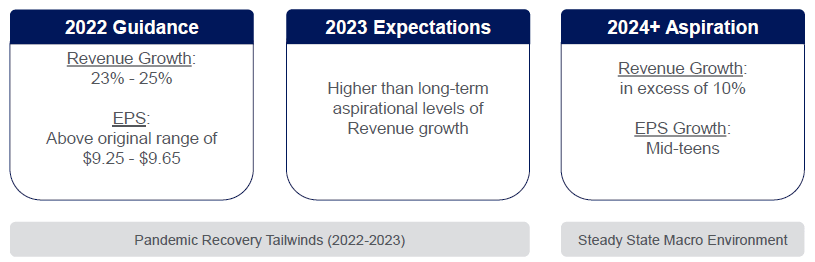 Source: AXP results presentation (Q3 2022). |
We believe the bullish view on AXP will ultimately be disappointed in both valuation and performance terms.
AXP Has Underperformed Year-to-Date
The view that a lower P/E will help AXP shares has been disproved in the past.
AXP stock has lost 4.7% (after dividends) year-to-date, worse than an approximately 2% loss at Mastercard and Visa, despite having started the year at a P/E multiple less than half of Mastercard’s and Visa’s:
|
AXP Stock Performance vs. Mastercard/Visa (2022 YTD)  Source: Company filings |
AXP stock also has a Dividend Yield of 1.4%, based on a quarterly dividend of $0.52 ($2.08 annualized).
In fact, AXP’s current P/E is little changed from the level at our initiation in March 2019, whereas Visa and Mastercard have both re-rated upwards by 7x and 5x respectively.
AXP Earnings Have Lagged
One reason that AXP’s valuation multiple has not improved may be how its earnings are seen as less resilient.
AXP’s earnings growth have lagged those at Mastercard and Visa. As of Q3 2022, AXP’s Pre-Provision Pre-Tax Income (“PPPTI”) was just 7.5% higher than in Q4 2019, whereas Mastercard’s EBIT has grown 38.4% and Visa’s EBIT has grown 27.9%; AXP’s PPPIT also kept falling longer and hit a lower trough back in 2020:
|
Card Networks’ Operating Income, Indexed to Q4 2019 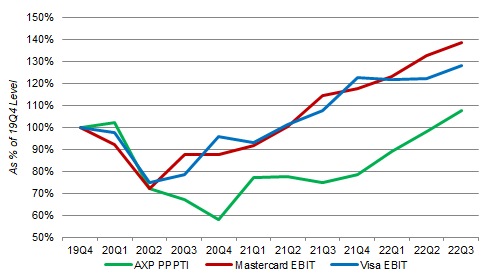 Source: Company filings. NB. Mastercard and Visa EBIT figures are non-GAAP. |
(PPPTI is the most meaningful measure of structural profitability, as Provision for Losses includes volatile one-off credit reserve builds or releases, which means Pre-Tax Income and Net Income are also volatile.)
AXP’s operational performance is actually worse than even the chart indicates because, unlike Mastercard and Visa, the stronger dollar had a “de minimis” impact on its earnings (thanks to significant local costs such as card rewards) and it did not have a material exposure to Russia before the Ukraine invasion (compared to about 4% of FY21 revenues, plus another 1% to Ukraine, at Visa; and 4% and 2% respectively at Mastercard).
AXP’s P&L for the most recent quarter, Q3 2022, shows why costs are the reason its earnings have lagged:
|
AXP P&L (Q3 2022 vs. Prior Periods) 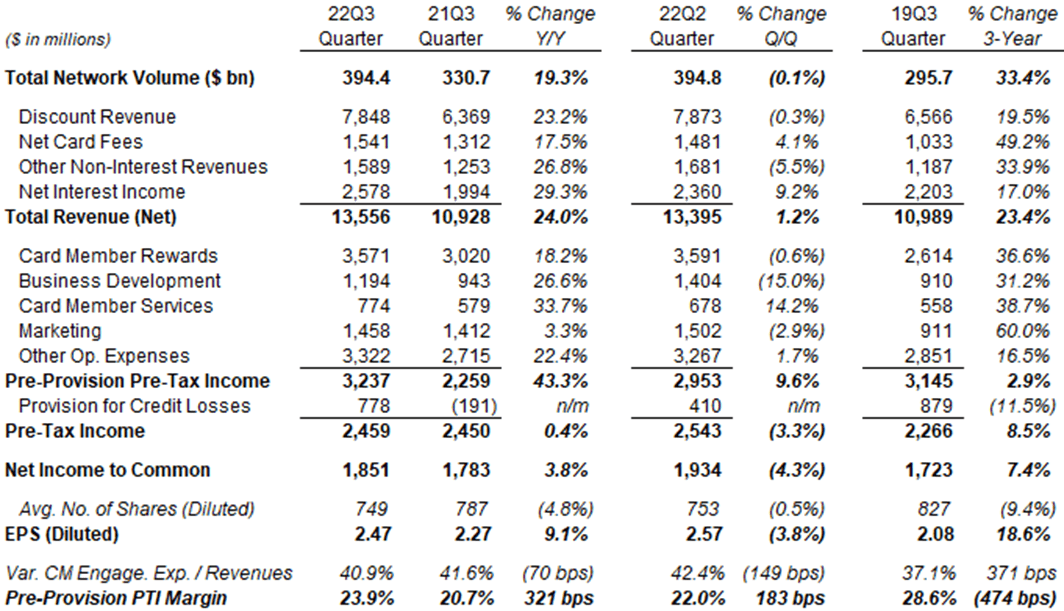 Source: AXP results supplements. NB. Q3 2019 Network Volume is actually “Billed Business”, an old definition that likely gave 2-3% lower figures. |
Volume growth has not created higher earnings at AXP. Compared to pre-COVID Q3 2019, total volume has grown 33%, revenues have grown 23%, but its PPPTI was only 2.9% higher – because all but one of its cost lines have grown more than revenues, including Marketing costs having grown by 60% in the past 3 years.
The reasons for the divergence in AXP and Mastercard/Visa earnings are structural.
While both ecosystems benefited from consumer spending growth, Mastercard and Visa have additional growth engines in new flows and value-add services that AXP is structurally less able to pursue. For example, AXP does not have the equivalent of a Visa Direct that can partner with the likes of PayPal (PYPL); nor can it provide services to the card-issuing banks that it is already competing with.
AXP is also bearing the entire costs of competing for cardholders and card spend, which are paid by card issuers on the Mastercard and Visa networks, albeit with the latter paying “client incentives” that grow at a slightly faster pace than gross revenues over time.
AXP Earnings May Rebase Again
AXP has essentially rebased its earnings in the past few years, and we think it may happen again.
Compared to Q3 2019, AXP revenues have increased by $2.6bn by the latest quarter. However, PPPTI has only increased by $0.1bn, with the other $2.5bn absorbed by Variable Card Member Engagement Expenses including Card Member Rewards, Business Development and Card Member Services:
|
AXP Revenues, Expenses & Pre-Provision PTI (Since 2019) 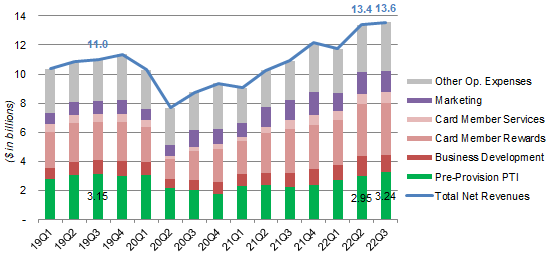 Source: AXP company filings. |
AXP has increased its Variable Card Member Engagement Expenses from 37% of revenues to around 42% (the figure guided for full-year 2022). AXP’s motivation has been partly to attract more premium card members to grow its Net Card Fees, and partly to compete with card issuers who have also been increasing their card rewards and marketing. The latter is outside control and may require further increases in future years.
AXP had rebased its earnings in other periods in the past. Before the high-teens growth period in 2017-19, EPS stagnated with a CAGR of just 2% in 2014-17:
|
AXP Adjusted EPS (2014-22E) 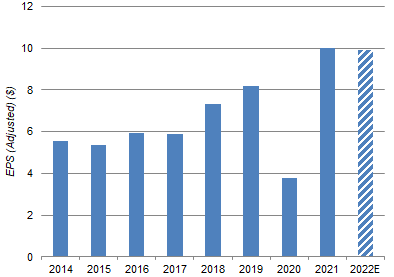 Source: AXP company filings. |
Reasons for the 2014-17 stagnation included slowing volume growth (in part due to the end of co-brand relationships with Costco (COST)) and a decline in PPPTI margin from 32% to 28%. Similar mishaps may happen again.
Year-On-Year Growth Rates Not Indicative
The strong year-on-year growth rates in AXP’s recent quarters are not indicative, having been driven by the post-COVID recovery in Travel & Entertainment and a one-off release in capital.
Goods & Services volumes enjoyed a strong rebound from prior-year COVID disruption in 2021, but its growth rate has continued to moderate in 2022, especially in offline:
|
AXP Goods & Services Volume Growth Y/Y (ex-Currency) (Since 2021) 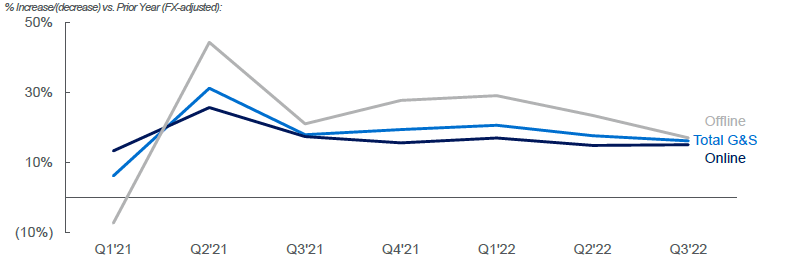 Source: AXP results presentation (Q3 2022). |
Travel & Entertainment volumes have exceeded 2019 levels by 11% by Q3 2022, with every customer segment higher than its pre-COVID figure except U.S. Large & Global Corporate (10% of total volume):
|
AXP Travel & Entertainment Volume Indexed to 2019 (ex-Currency) 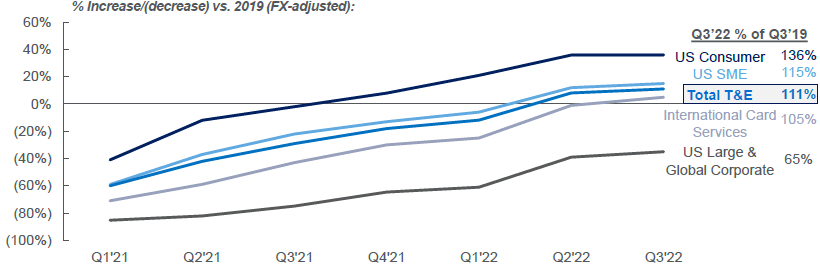 Source: AXP results presentation (Q3 2022). |
AXP’s EPS growth also benefited from a one-off capital release in Q4 2021, which helped drive its CET1 ratio down from 12.6% to 10.5% (vs. a 10-11% target), with $4.79bn spent on share buybacks that quarter (compared to Net Income for Common Shareholders of $1.68bn). More shares were repurchased in Q1 2021 than the subsequent three quarters, with the extra buybacks providing an approximately 2 ppt boost to Q3 EPS:
|
AXP Share Count & Capital Ratios (Last 5 Quarters) 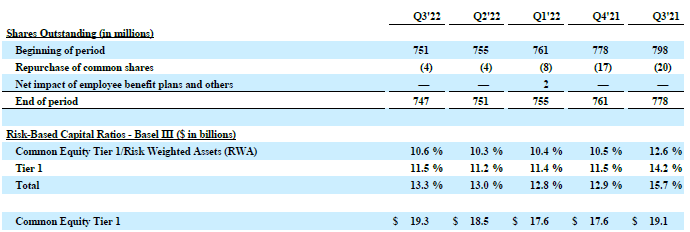 Source: AXP results supplement (Q3 2022). |
With loan growth being one of its focus areas, AXP has had to leave put more of its earnings into capital since Q1 2022, and this trend will likely continue in future years.
Recent Benign Credit Costs May Reverse
P/E multiples based on 2021 and 2022 earnings may also be flatted by atypically benign credit costs.
2022 year-to-date credit provisions were just $1.16bn (annualizing to $1.54bn) and 2021 actually saw a credit benefit of $1.42bn, much smaller than the approximately $3.5bn provisions in pre-COVID 2018 and 2019:
|
AXP Pre-Tax Provision Income vs. Provisions (Since 2018)  Source: AXP company filings. |
Write-offs are at historically low levels, thanks to the boost to consumer savings during the pandemic and recent strong employment numbers. AXP card reserves, as a percentage of card loans, are only slightly higher than they were before the pandemic (at 3.4%, compared to 2.7% at Q4 2019; they were at 6.7% in Q1 2020). An U.S. economic downturn would materially increase both, reducing near-term earnings significantly.
Management targets a long-term Return of Equity (“ROE”) of “around 30%”, lower than the 34% achieved in 2021:
|
AXP Return on Equity (2019-21 vs. Target) 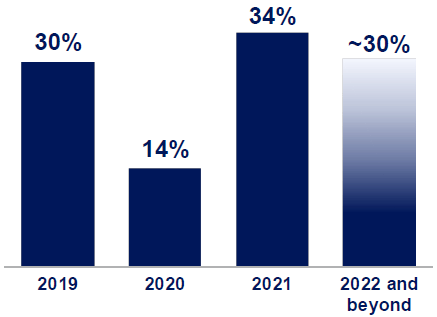 Source: AXP investor day presentation (Mar-22). |
With AXP stock trading at 5.1x book value ($30.02 per share), a 30% ROE implies a P/E of 17.1x.
Conclusion: Is AXP Stock A Buy?
We reiterate our Hold rating on American Express Inc. stock. Avoid.
Be the first to comment