

natasaadzic
Q3 recap and thesis
Lately, Advanced Micro Devices (NASDAQ:AMD) has been facing both large selling pressure on the trading front and also operation uncertainties on the fundamental front.
On the fundamental front, the manufacturer company posted mixed financial results for most of 2022 so far. For its Q3 results, both the top-line and bottom-line missed its preliminary guidance. Its Q2 results also fell short of consensus estimates in terms of EPS. The mixed results are caused by a range of headwinds (such as softened global PC demands and global supply chain disruptions) and also its own doings (such as the built-up of a large inventory). There are signs that all these issues are abating, but I anticipate it takes another 6 months to a year for these issues to completely resolve.
On the trading front, the following Point & Figure Chart (“PFC”) shows heavy trading volume in a price range between $55 and $85. For readers unfamiliar with PFC charts, a detailed tutorial is provided here. It is an effective tool, more effective than the typical price chart in my view, to see the trading patterns in extended periods. In this particular case here, the following chart displays about 2 years of trading data here (between 2019 to the present).
In particular, you can clearly see that September 2022 was when the stock suffered the heaviest selling (highlighted by the yellow box below). Its stock prices declined sharply from ~$85 to a bottom of ~$55 with about 2.2 billion shares traded. To put things into perspective, the total number of outstanding shares is about 1.6 billion shares only. So, on average, each share has been traded more than once during this sharp decline. The stock staged a strong rally in October 2022. But the stock was not able to rebound to its previous peak of $85 (and the trading volume is also slightly lower compared to the decline).
Considering the fundamental headwinds and the trading patterns, I see a large chance for AMD’s stock prices to oscillate sideways in the $55 and $85 range in the near future (say 6 months to 1 year as aforementioned).
And in the remainder of this article, I will explain why this range is very attractive for long-term investors to accumulate shares.
Source: stockcharts.com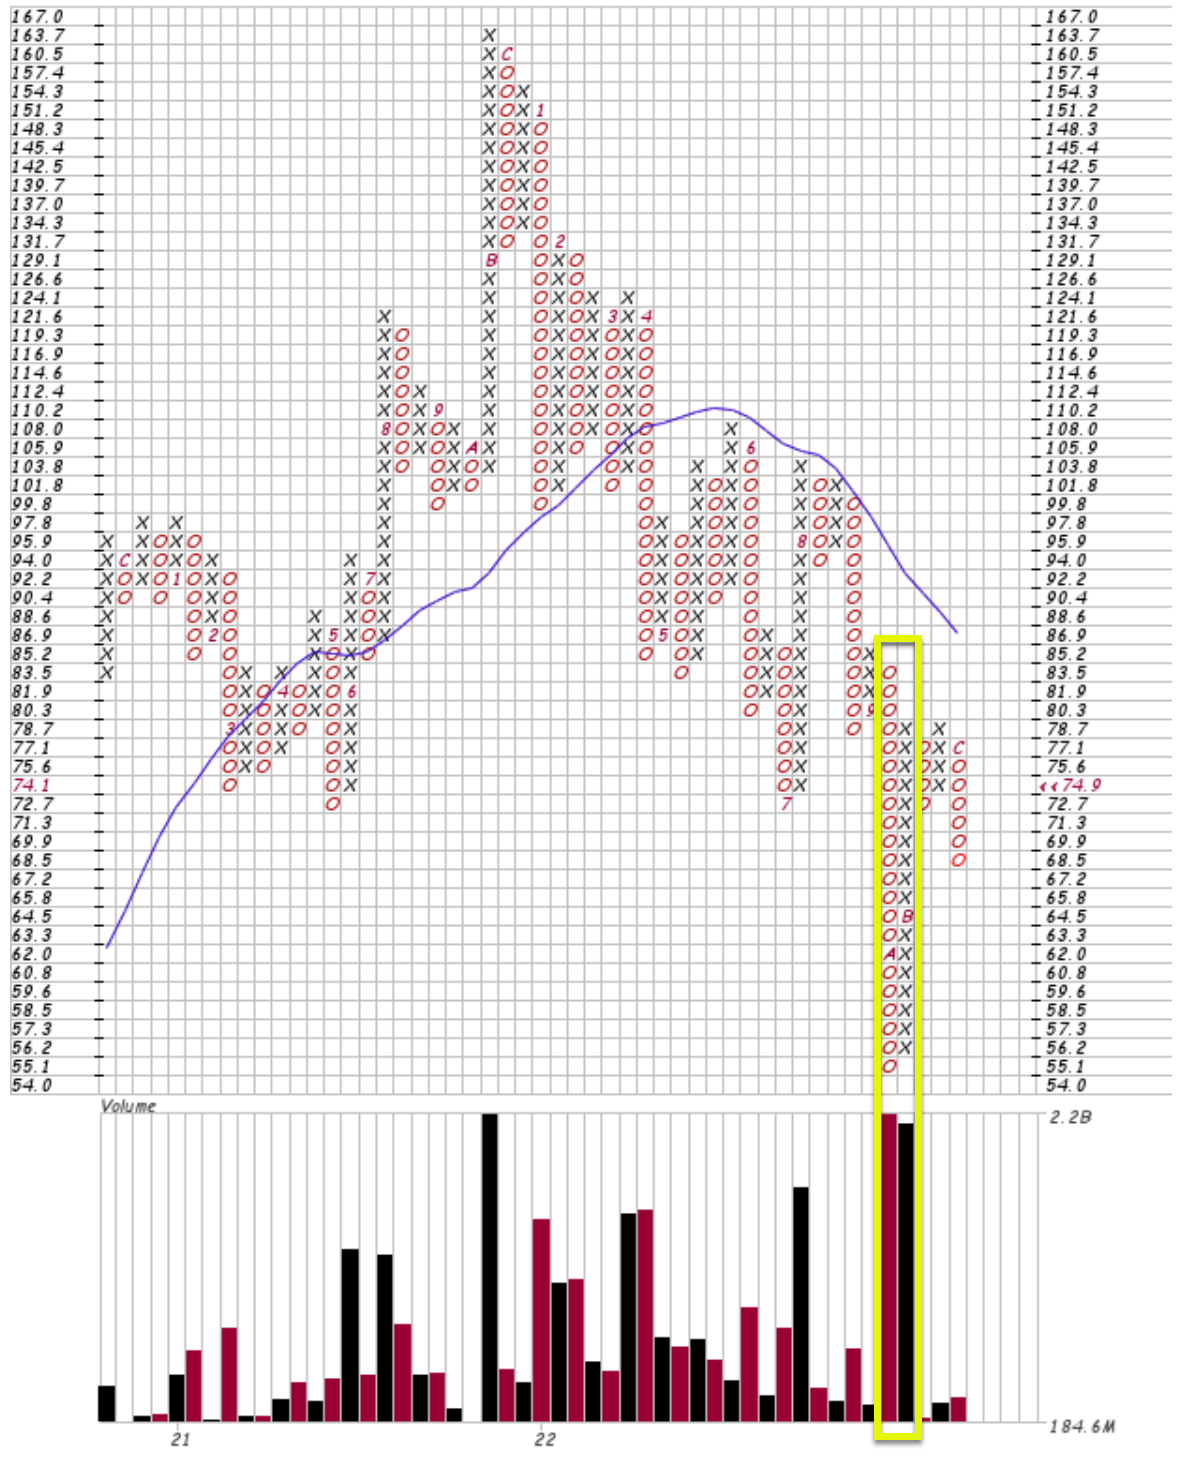
Focus on the big picture
Once we look beyond the immediate issues, I see a high-quality business with superb profitability and tremendous growth potential.
Here, to provide an overall picture, the next chart compares its profitability against ALL other businesses with financial information publicly available. And the source data used in the chart are pulled from the Dartmouth Tuck Business School database. The source data were then analyzed using the Fama-French method. The method is detailed in our earlier article) and a brief summary is shown below:
The method is named after Eugene Fama and Ken French. Fama shared the Nobel Prize in economics with Lars Peter Hansen and Robert Shiller. The Fama French method is considered a significant improvement over the CAPM method because it adjusted for outperformance tendency.
The two charts below show the two results: AMD’s profitability factor and valuation factors compared to the general market. Past results have shown that these two factors have truly held up over all time periods.
- The OP factor (Operating Profitability). The operating profitability factor in period t is defined as the operating income divided by the sum of book equity and minority interest for the last fiscal year ending in time period t-1.
- The P/E factor (the Price/Earnings ratio). The P/E factor is based on total earnings before extraordinary items, from Compustat.
Against this background, the following chart illustrates the OP factor of AMD compared to the rest of the stocks. As you can see, AMD’s current OP sits at 48.6%, far above the 25% percentile of the overall stock market (marked by the thin purple line) but below the top 10% percentile (marked by the thin cyan line).
Admittedly, its profitability is a bit lower by other metrics such as ROCE (return on capital employed). As detailed in our blog article, OP does not accurately (or comprehensively) represent a business’s profitability. And ROCE (return on capital employed) is a much more fundamental measure in our view. In terms of ROCE, AMD’s profitability is 36.7% as seen, slightly below its OP of 48.6%. But even in terms of its ROCE, it’s also close to the top 20% percentile as seen. And bear in mind that the overall market’s profitability would be weaker than what’s shown here too if its profitability is measured in ROCE too.
All told, my estimate is that AMD’s profitability would be safely among the top 20% compared to the overall market. And next, we will see that its valuation, on the other hand, is nowhere near the top 20% of its overall market.
Source: Author based on Dartmouth data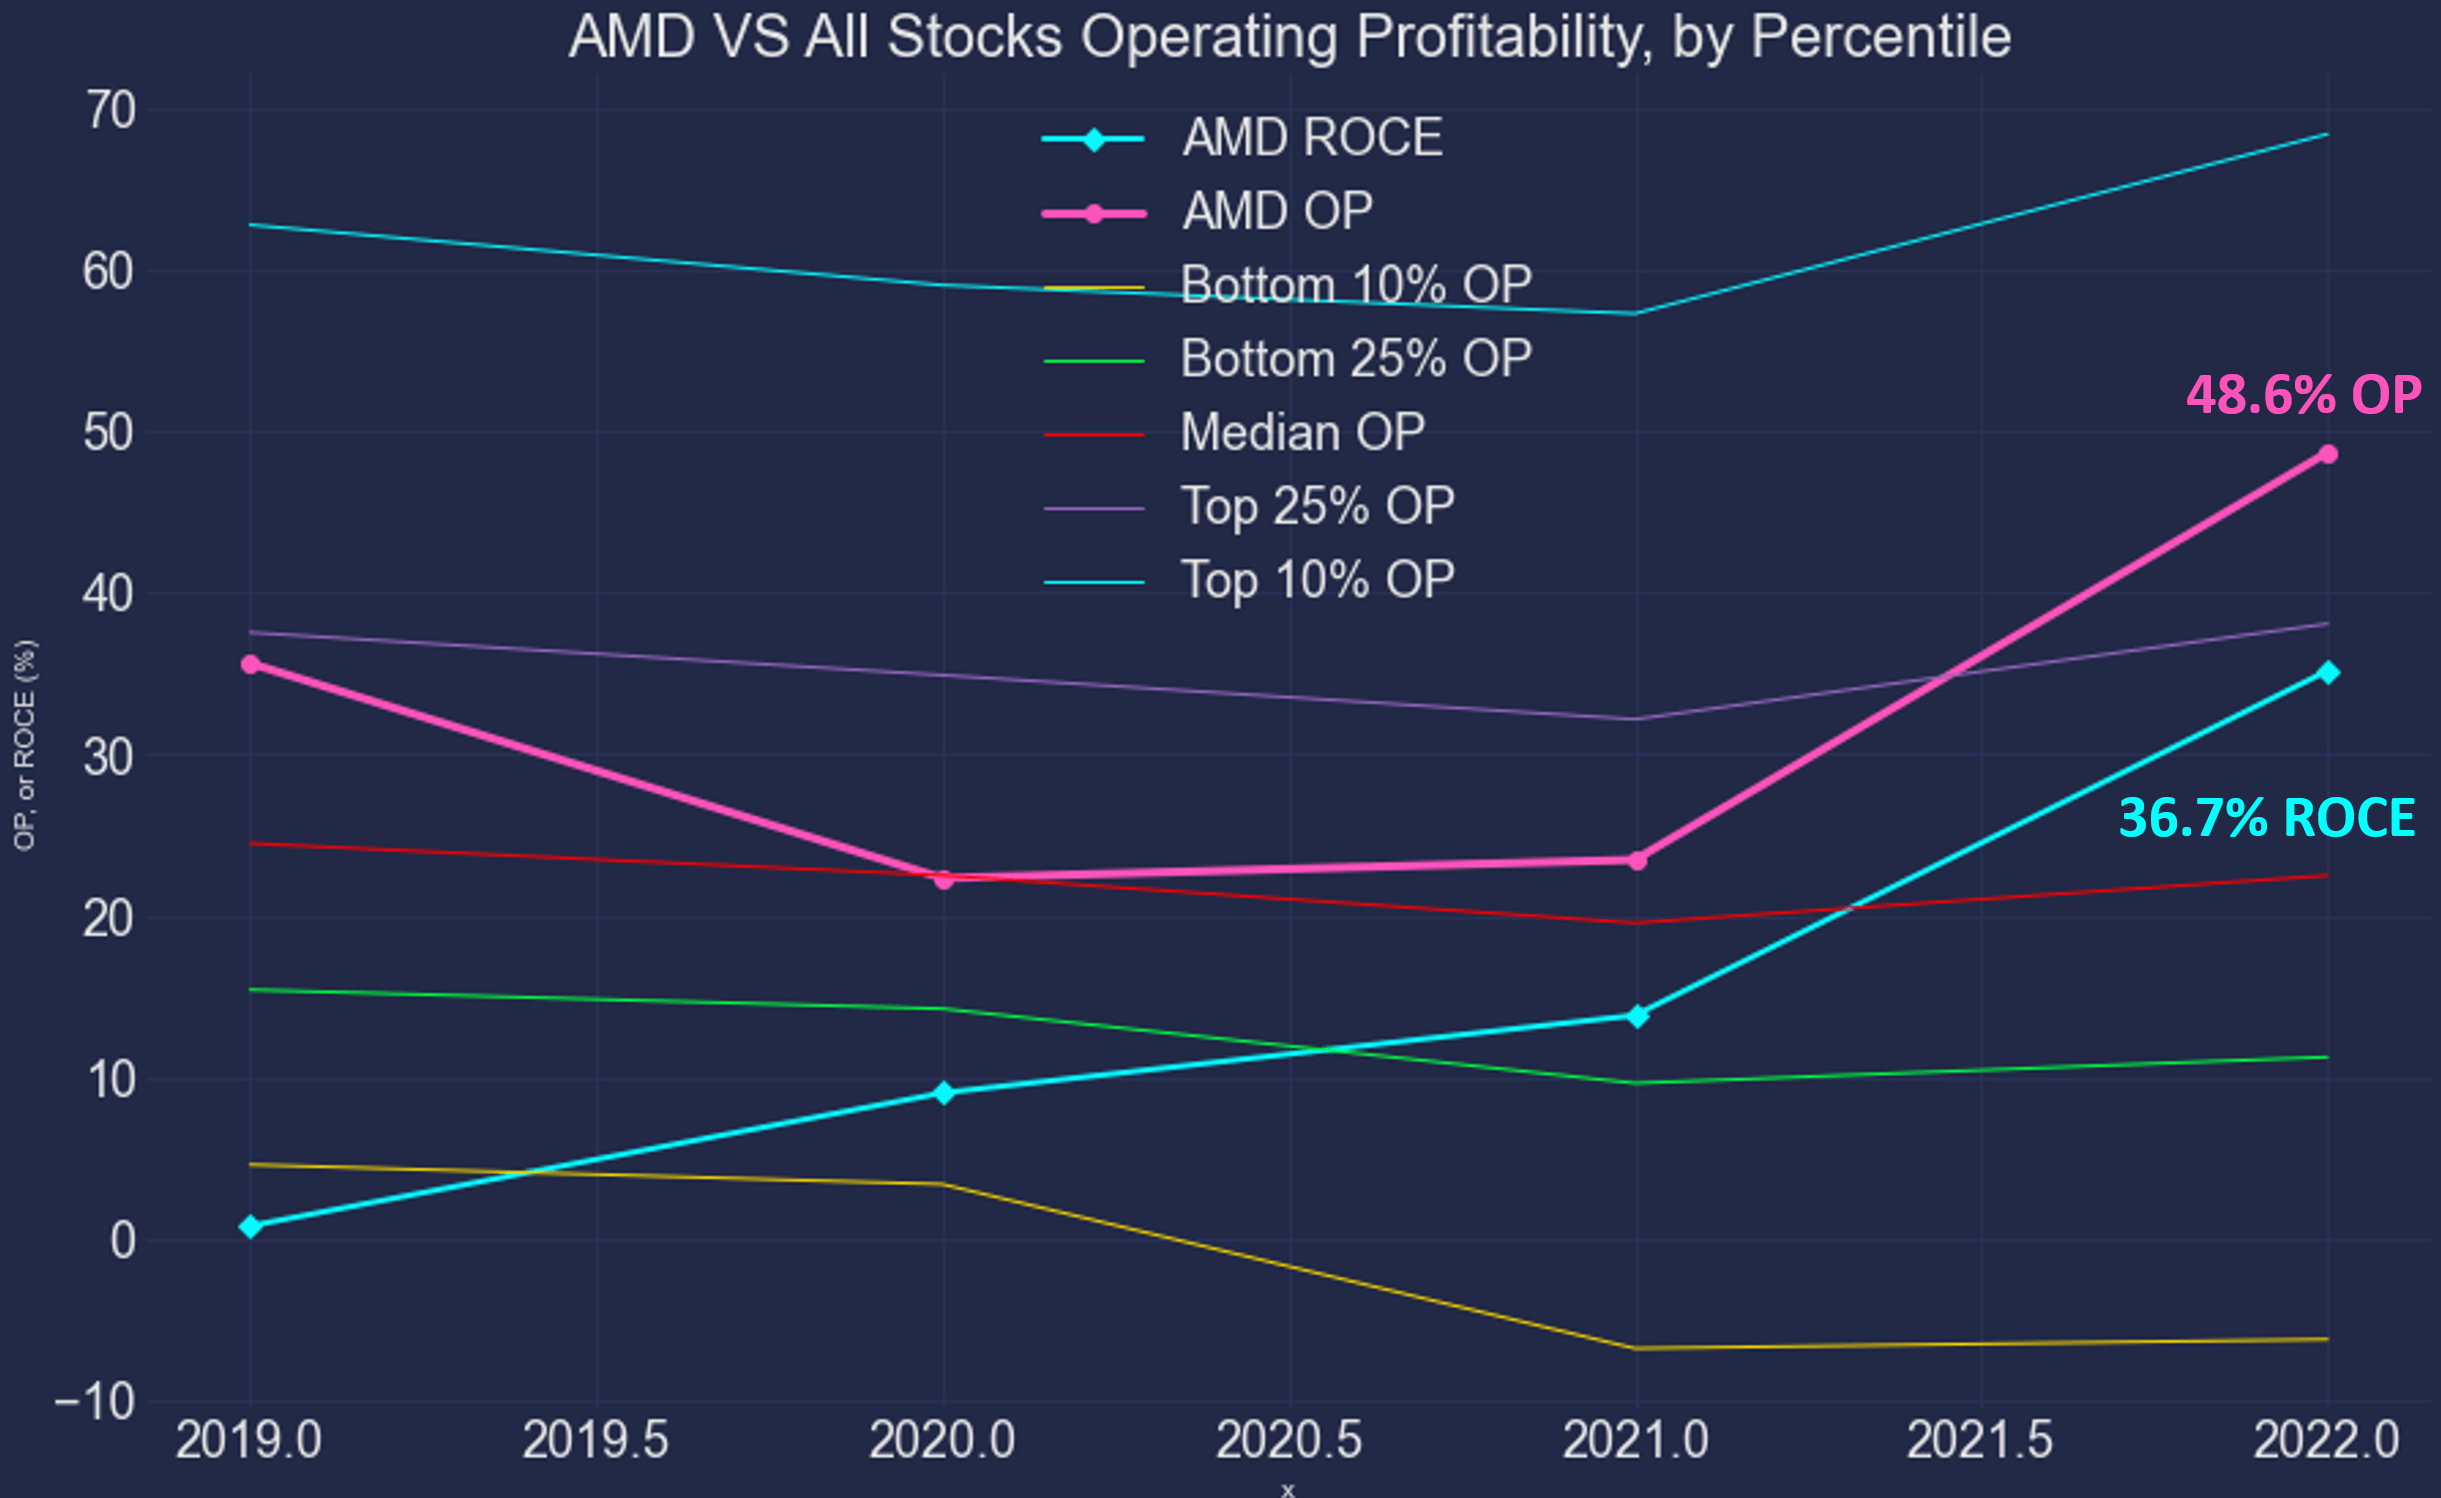
Valuation is nowhere near 20%
The chart below displays AMD’s P/E factor compared to the overall market. And hopefully, this makes it clear why the $55 to $85 window is a Christmas present for long-term investors.
My estimate of its FW EPS is around $4.25. As a result, at its current prices (~$75 as of this writing), its current FW P/E is only about 17.6x. As seen, a P/E of 17.6x is below the current market median P/E (shown by the thin brown line), representing a tremendous discrepancy to its profitability ranking which is close to the top 20% percentile as just mentioned. Even if the price rises to the top bound of the range (i.e., $85), the FW P/E ratio would be 20.0x and is only on par with the market median as seen.
While if the price falls to the lower bound of this range again (i.e., $55), the FW P/E would shrink to 12.9x, closer to the bottom 25% percentile of the overall market, leaving a huge margin of safety considering its top 20% profitability ranking.
Source: Author based on Dartmouth data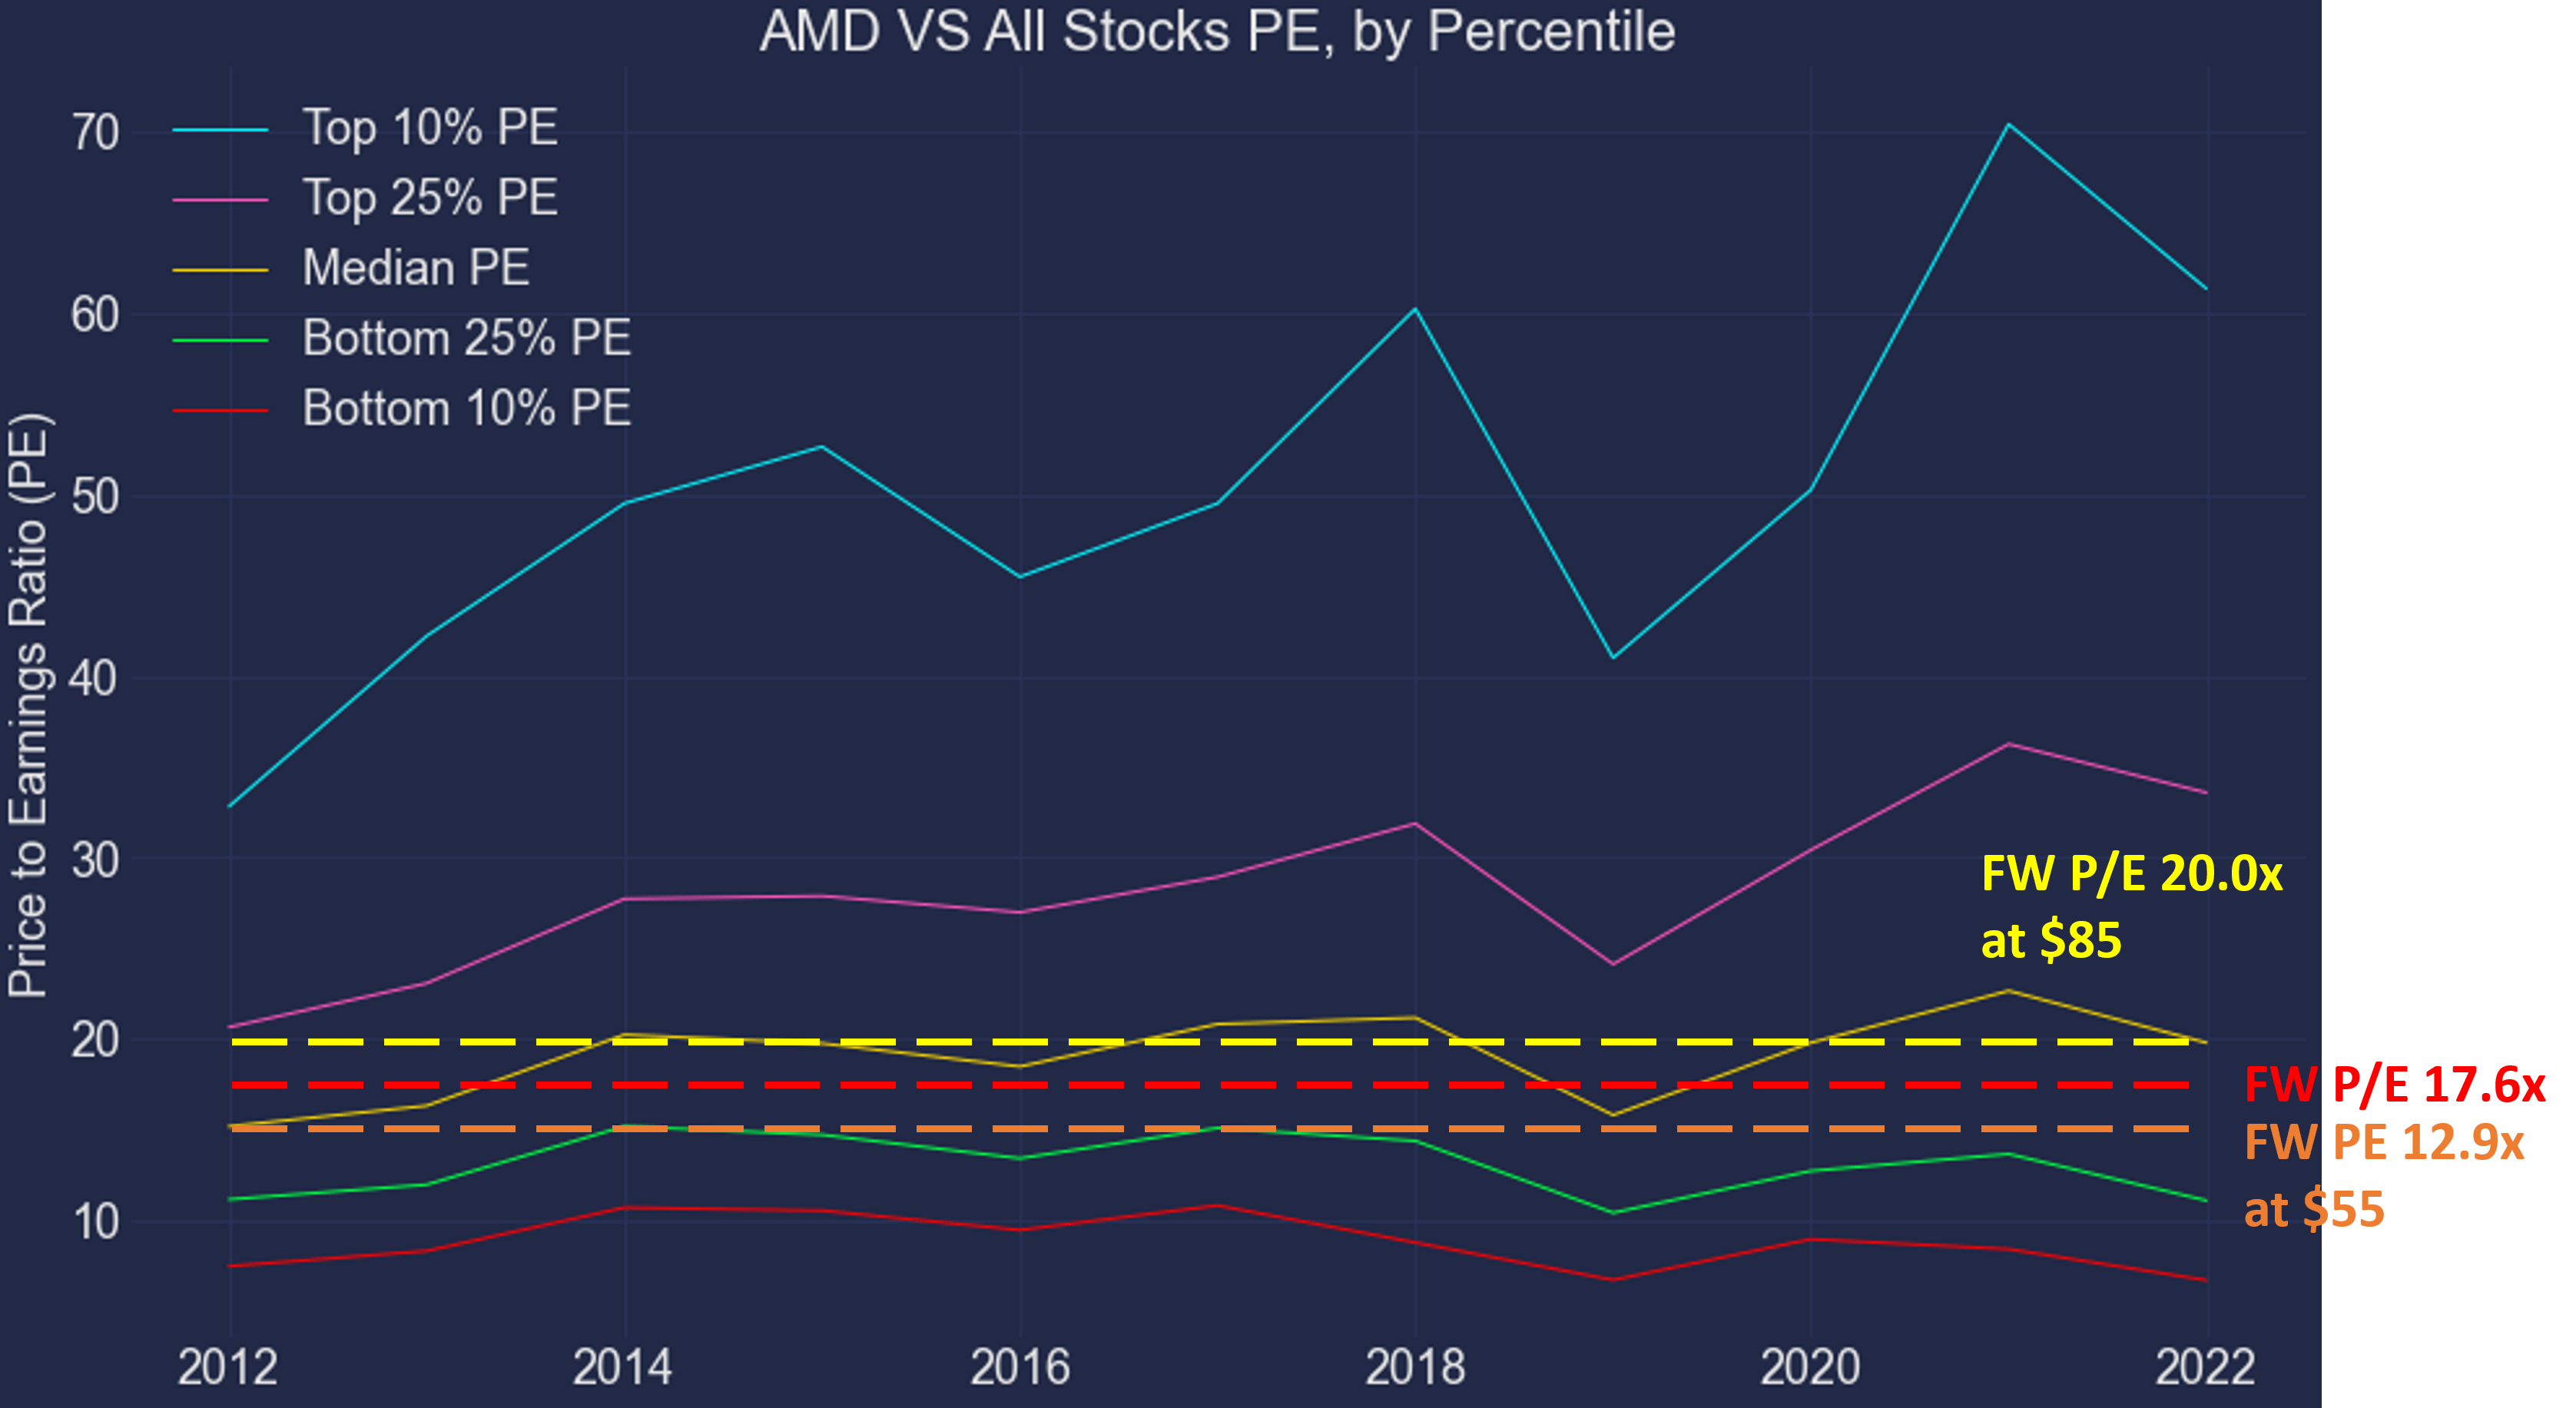
Risks and final thoughts
To recap, AMD has been undoubtedly facing some strong headwinds and many of them will persist into the next year or so. The softening of global PC demands will take some time to recover, the global supply chain congestion will need more time to clear up, and the hoarding of its own inventory needs time to clear too (and possibly at discounted prices too).
However, once we look beyond the immediate issues, I am seeing a business with superb profitability (near the top 20% percentile of all stocks) but for sale at a valuation that is well below the market median P/E. The signal from this big picture is too loud to miss in my mind. The discrepancy between its P/E factor and OP factor is simply too large and the margin of safety too wide, creating very favorable odds for market-beating performance in the years to come.
Be the first to comment