

pressureUA/iStock Editorial via Getty Images
Introduction
In 2022, mega-cap tech stocks have come under pressure amidst a broad market sell-off. However, a spectacular bull run over the last few years has led some of these names to trade at high (four-digit) stock prices, making them unaffordable for retail investors. With high-profile companies like Amazon (NASDAQ:AMZN), Alphabet (GOOG) (NASDAQ:GOOGL), and Tesla (TSLA) announcing stock splits in the first half of this year, I feel obliged to share my thought process around stock splits and my positioning related to these mega-cap tech names. In my latest public article, I discussed Tesla and outlined my logic for avoiding its stock at current levels. Despite the announcement of a 3-for-1 stock split in the after-hours sessions, I continue to remain neutral on Tesla. With that being said, I am very much bullish on Amazon and Alphabet:
- Is Amazon’s Stock Price Near The Bottom, Or Will It Continue To Drop?
- Microsoft Vs. Google: Which Stock Is The Better Buy?
Among mega-cap tech stocks, I own Meta Platforms (META) and Amazon; however, these are long-term “buy and hold” investments for me. While Alphabet is not currently a part of my individual portfolio, the decision to concentrate into Facebook and Amazon has nothing to do with Alphabet’s business but the structure of my portfolio.
In today’s note, we will analyze Amazon and Alphabet to evaluate them as potential buys considering their respective 20-for-1 stock splits. As you may know, Amazon completed its stock split on June 3, 2022 (announced on March 9, 2022). And Google’s stock split is set to happen on July 15, 2022 (announced on February 1, 2022). Since their respective announcements, both Amazon and Google are down by ~20%. I think it is fair to say that stock split announcements haven’t helped Amazon’s or Google’s stock.
What is a stock split?
A stock split increases the number of shares outstanding and decreases the share price proportionately, with market capitalization remaining constant. Here’s what a stock split looks like:
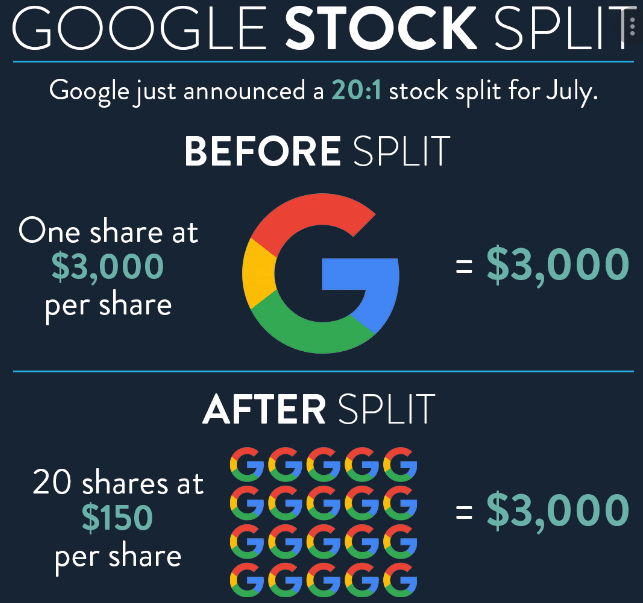
personalfinanceclub.com
While stock splits do not impact business fundamentals, they are a proven source of (near-to-medium term) alpha generation. Historical data (from 1980) shows that, on average, companies tend to outperform S&P 500 (SPX) by 16.3% (12-months after their stock split announcements).
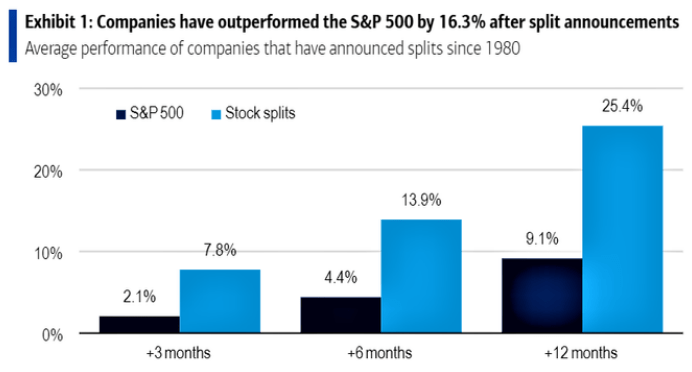
BofA Research Investment Committee, Bloomberg
Theoretically, the stock price of companies showing strong business momentum rise to elevated levels. When these companies execute stock splits, the affordability and liquidity of these stocks go higher, and the removal of perception of a high stock price leads to the discovery of true value. Hence, stock splits are broadly viewed as bullish catalysts.
In investing, nothing is guaranteed, and that is true for stock splits too. Historically, 30% of stock splits tend to result in negative returns (12 months after the announcement). However, the positive outcomes are more frequent and tend to be of larger magnitude. Both Amazon and Google are good long-term buys at current levels, but let’s analyze these stocks for a shorter-term investment (6-12 months) to identify the better stock split buy. In order to do so, we shall compare Google and Amazon based on fundamental, quantitative, and technical data.
Google Is The Better Stock Split Buy
In the last twelve months, growth rates for both Alphabet and Amazon have been trending down; however, Alphabet’s Q1 2022 growth rate of 23% was healthier than Amazon’s Q1 growth of 7%. Now, Amazon’s top-line numbers do not tell the whole story because the weakness in its retail ecosystem is masking the strength in AWS and digital ads businesses. If we go by cold hard factual data, Google is a cash flow machine that has generated ~$69B over the past twelve months, whilst Amazon has burnt ~$25B during the same period. Hence, Google is growing faster, and it is much more profitable.

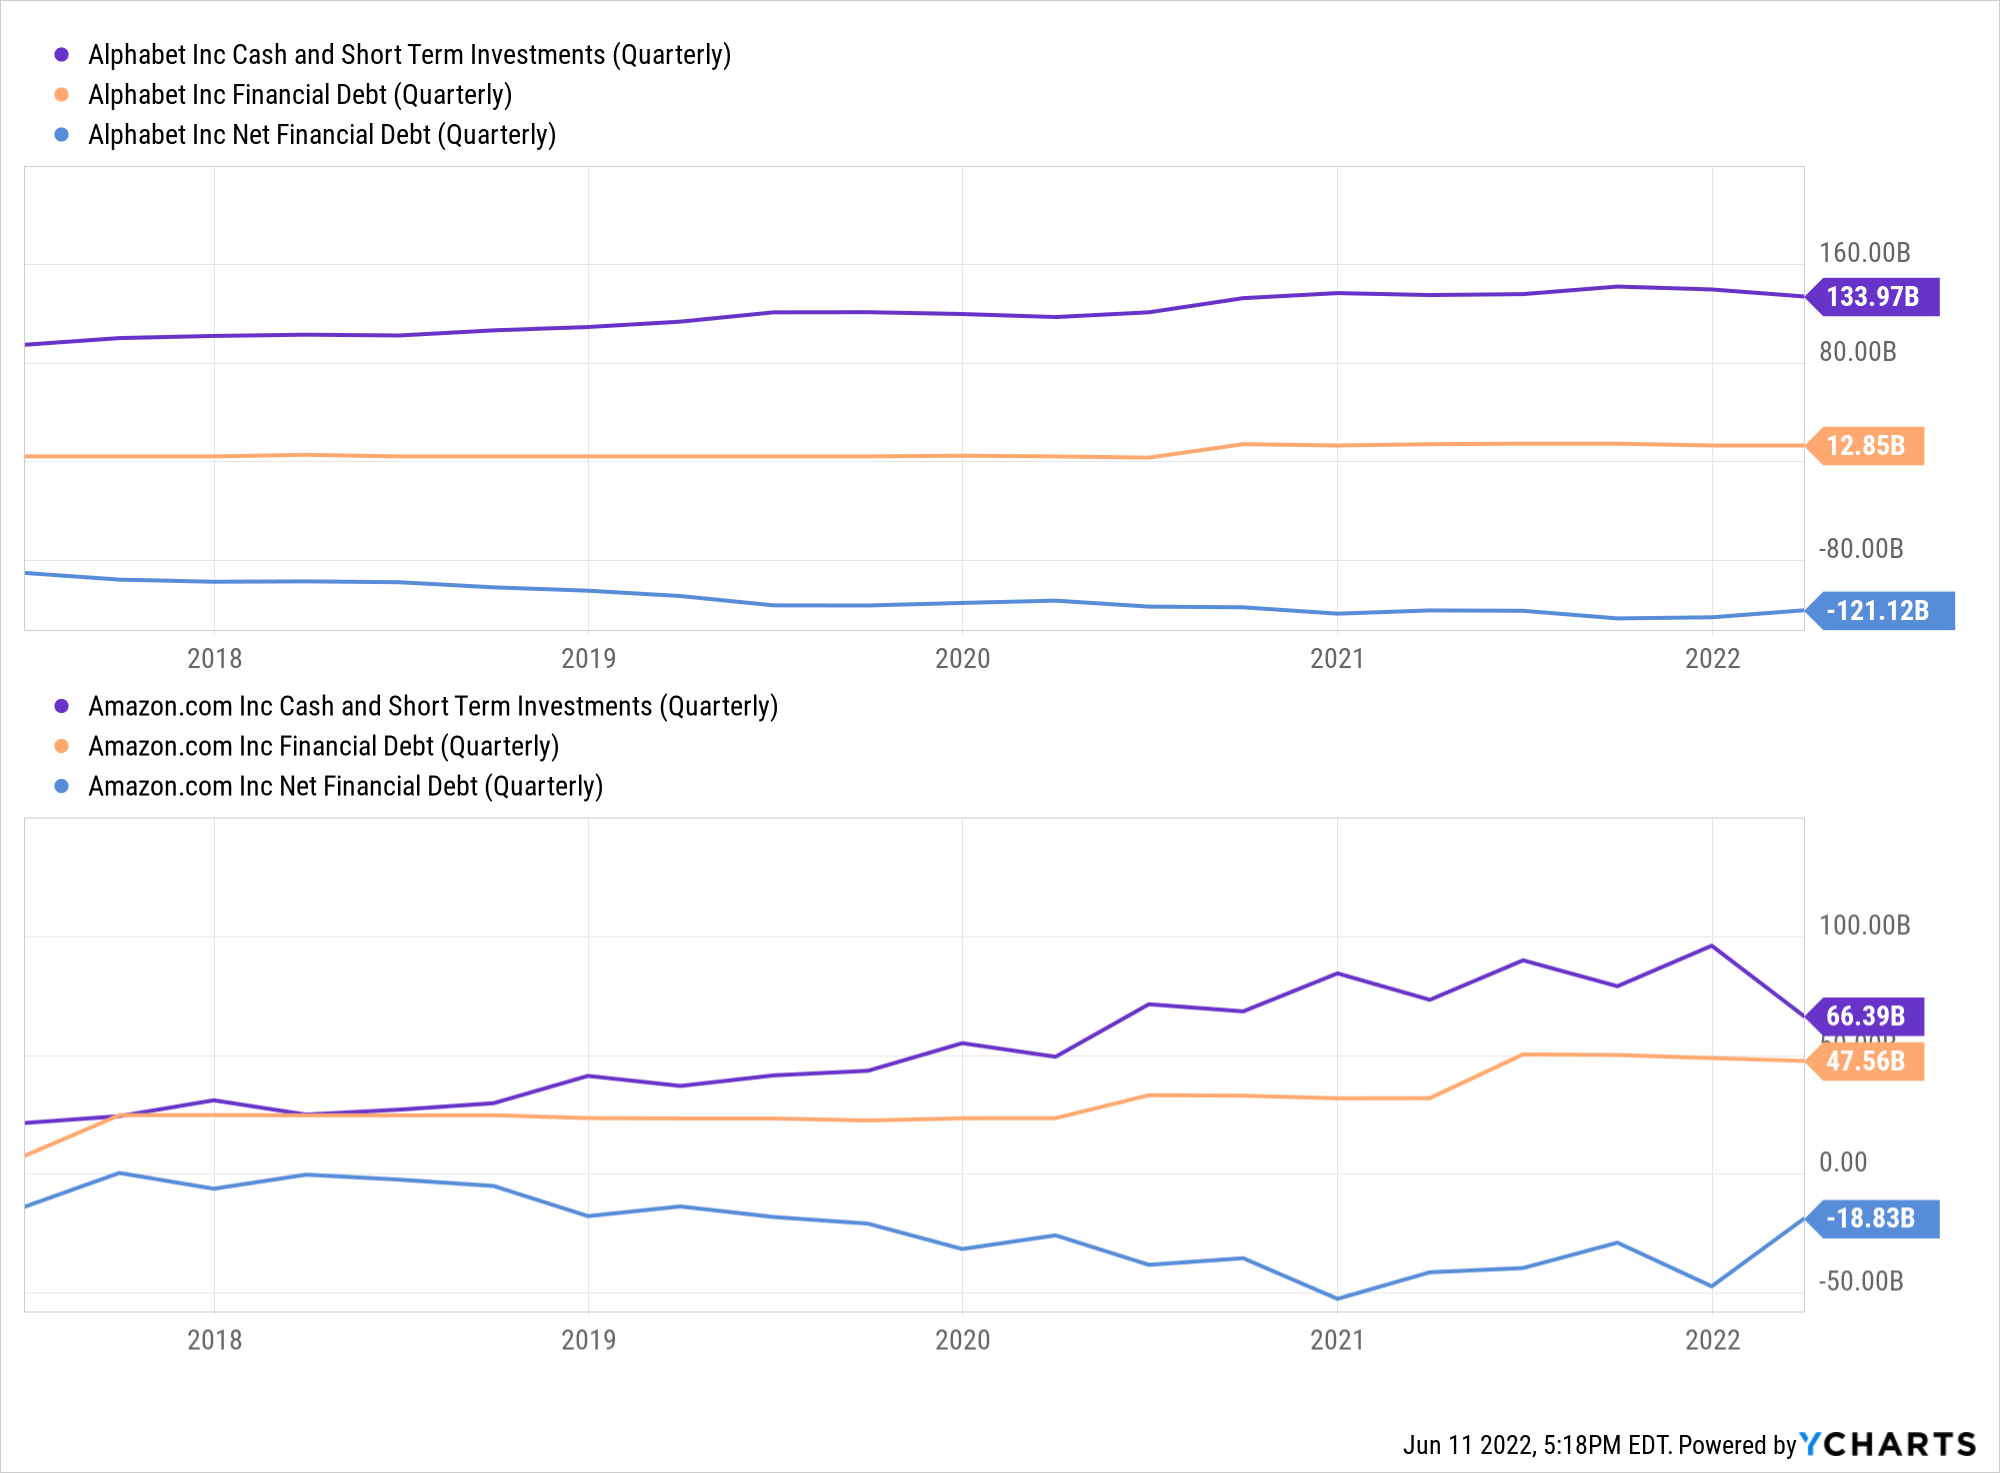
YCharts
Looking at key balance sheet metrics, it is fair to say that both Amazon and Google are well-capitalized companies. While Amazon’s net cash balance of $18B seems somewhat precarious considering its recent cash burn issues, I believe that Amazon will return to positive free cash flow generation over the next 12-18 months. With a net cash balance of $121B, Google’s balance sheet is pristine. In comparison, Google’s balance sheet is better than Amazon’s.
YCharts
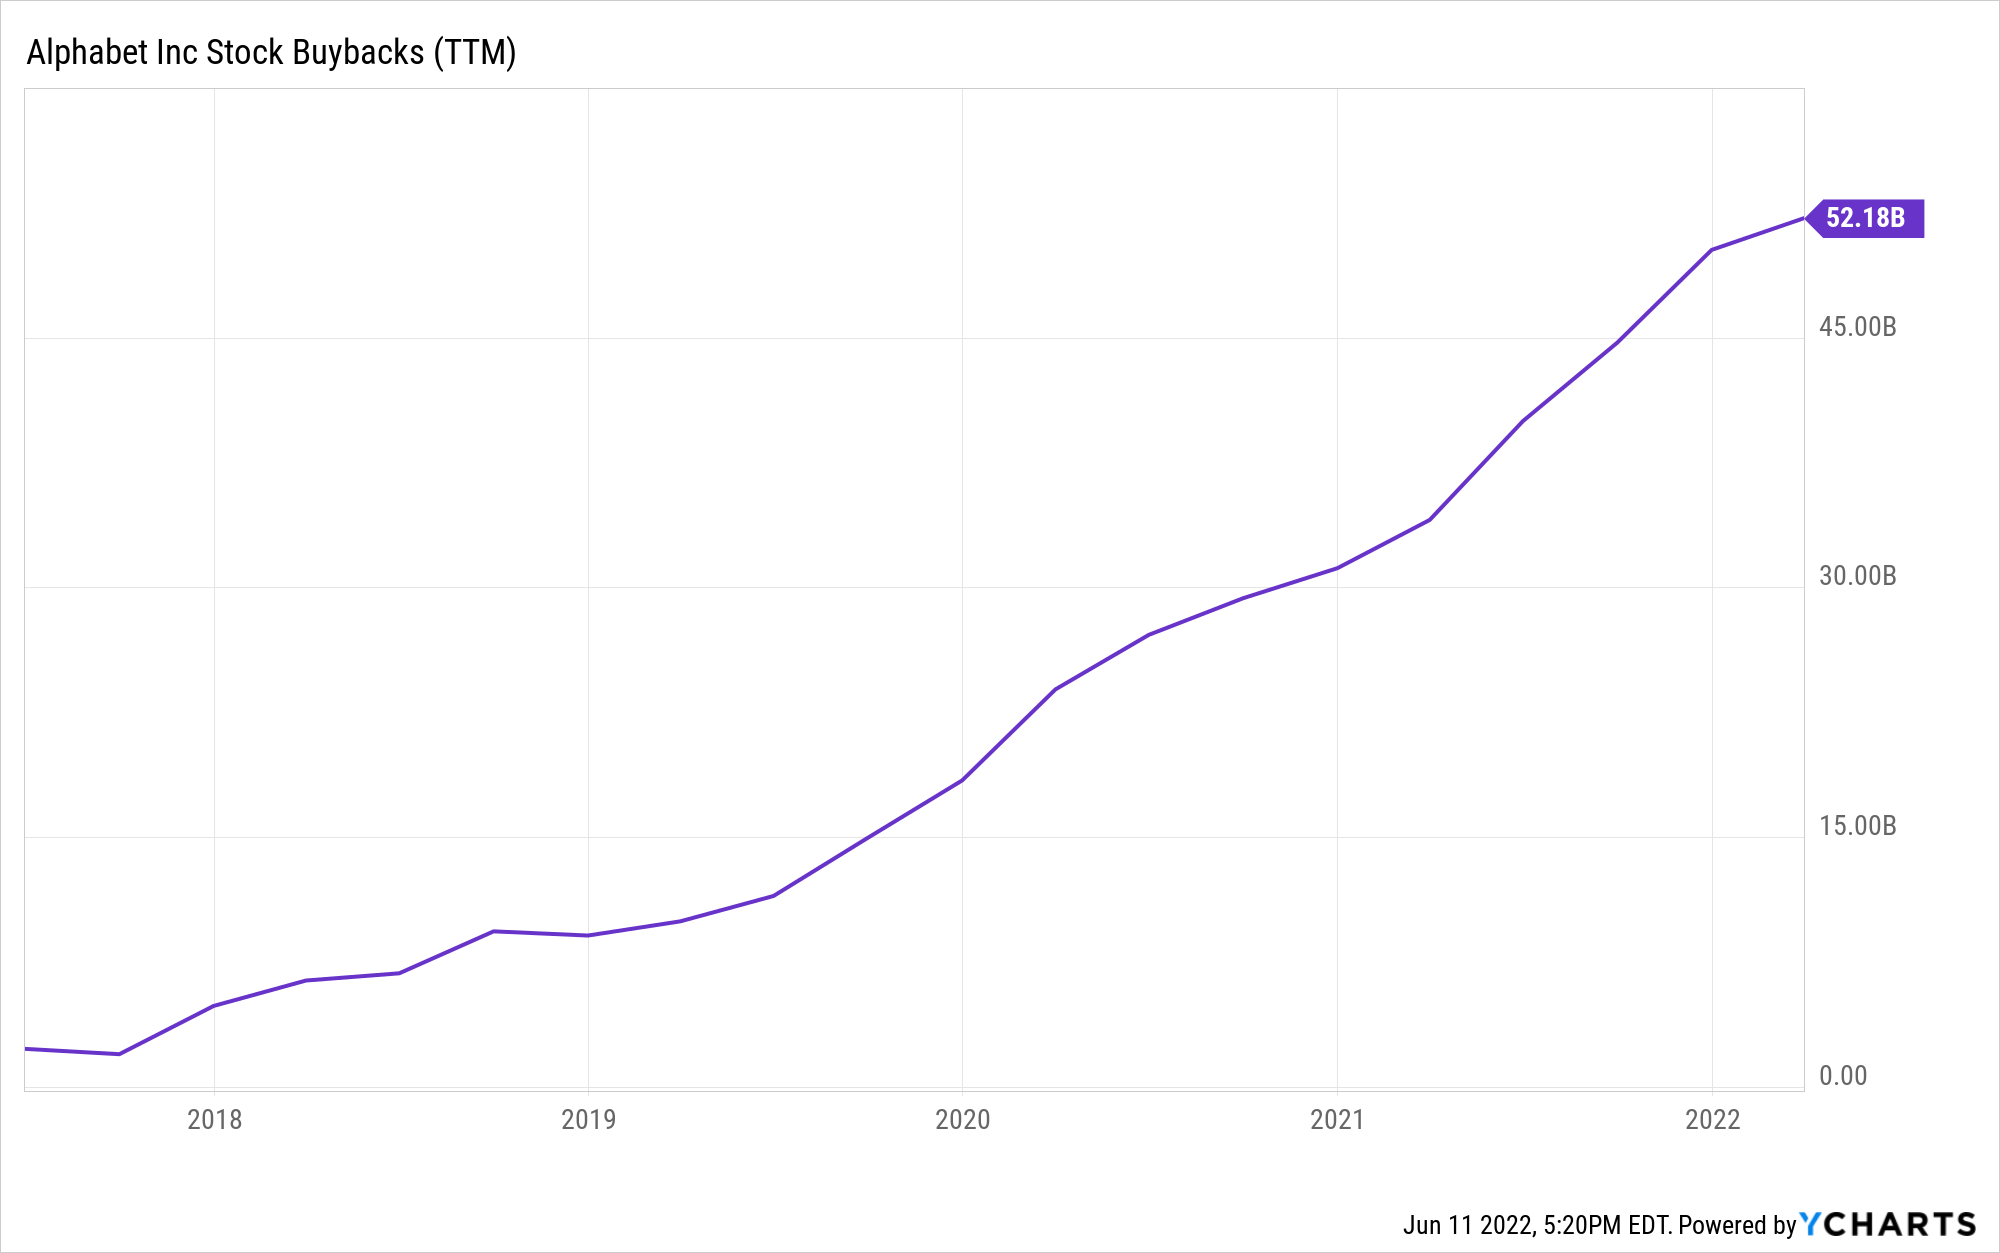
In addition to its financial results and balance sheet, Alphabet’s capital return program outshines that of Amazon. While Amazon recently announced a $10B stock buyback program, it is not substantial considering its market cap of $1.1T. On the other hand, Google repurchased roughly ~$52B worth of its shares over the last twelve months and added another $70B to its stock buyback authorization in late April. Clearly, Google’s stock has far greater support from its buyback program compared to Amazon.
YCharts
Now, let’s turn our attention to quantitative data.
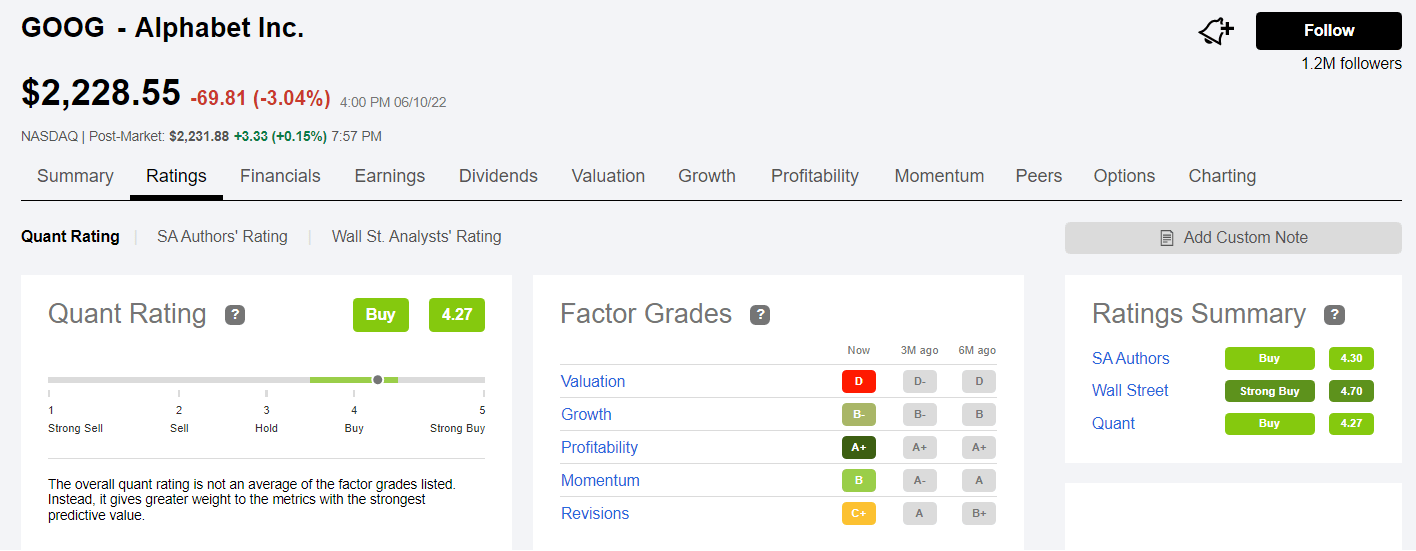
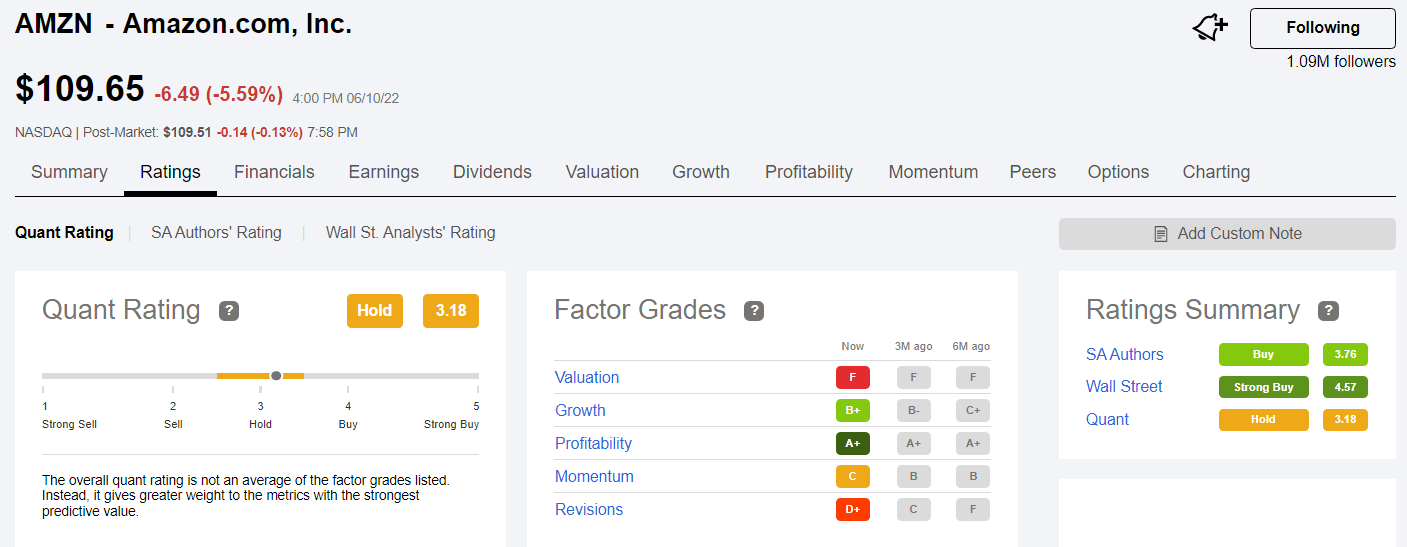
According to Seeking Alpha’s Quant Rating system, Google is rated as a buy, whereas Amazon is rated as a hold. While both companies have the same factor grade (A+) for profitability, Google is rated higher than Amazon on Valuation, Growth, Momentum, and Revision. Hence, from a factor grade perspective, Google is the better buy.
Seeking Alpha
Seeking Alpha
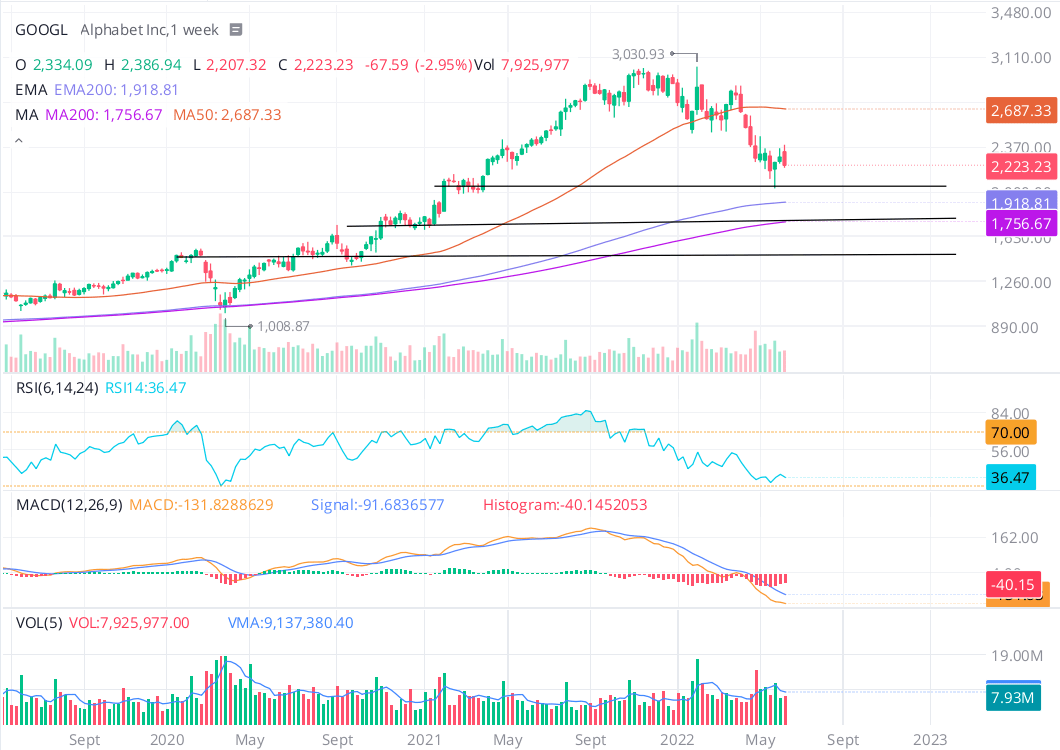
Since the Fed’s pivot in November, both Google and Amazon have been trending lower, with the sell-off getting worse in recent weeks. So far, Google has held a support zone at $2,000, and it is currently forming a base above this support. A breakdown of this support opens up downside to 200DMA levels of ~$1,750, with the next demand zone located at $1,500. With an RSI of 36, Google is close to oversold territory; however, the MACD is still trending lower (despite being highly negative).
WeBull
Amazon’s technical chart is looking weaker than Google’s, with the e-commerce giant’s stock trading below its 200DMA (after recent rejection at this level). Now, Amazon’s stock is sitting above a strong demand zone; however, if the support at $105 is broken, the stock could break down to $87. With an RSI of 32, Amazon is nearly oversold; however, the MACD is still trending lower.
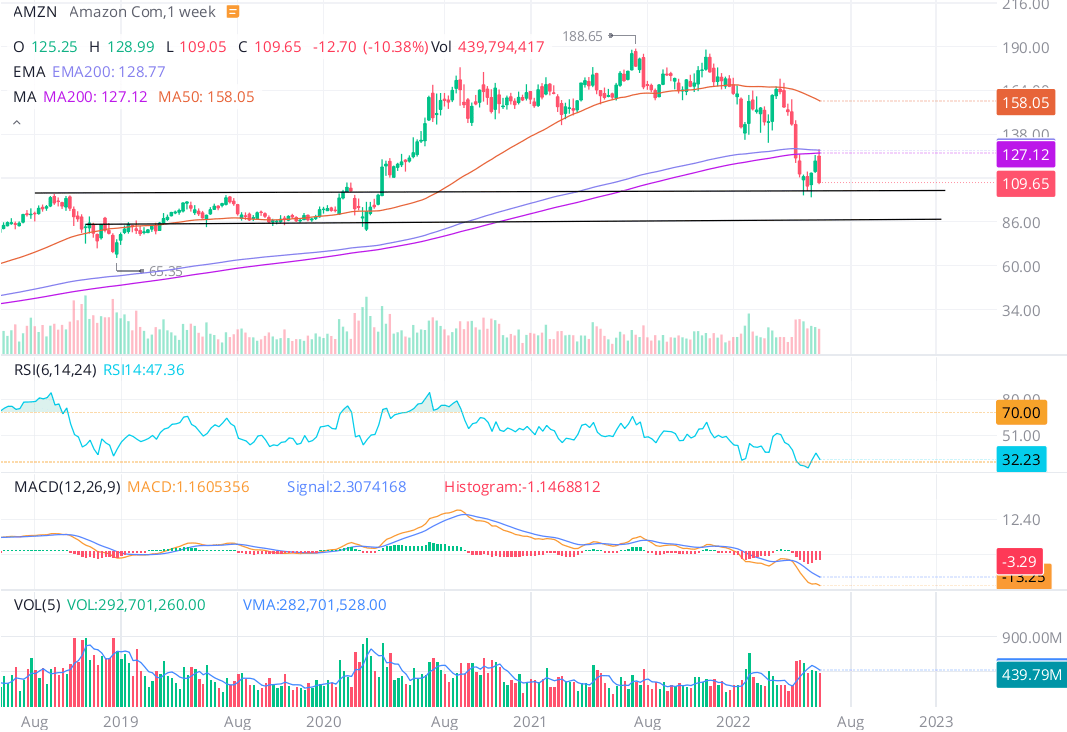
WeBull
The technical setup for both Google and Amazon is bearish. From a long-term perspective, broken technical charts could be great buys if business fundamentals are robust. If we consider relative valuation, Google is trading at a P/E ratio of ~20x while Amazon is trading at a P/E ratio of ~53x. Even after factoring in growth, Google is cheaper than Amazon.
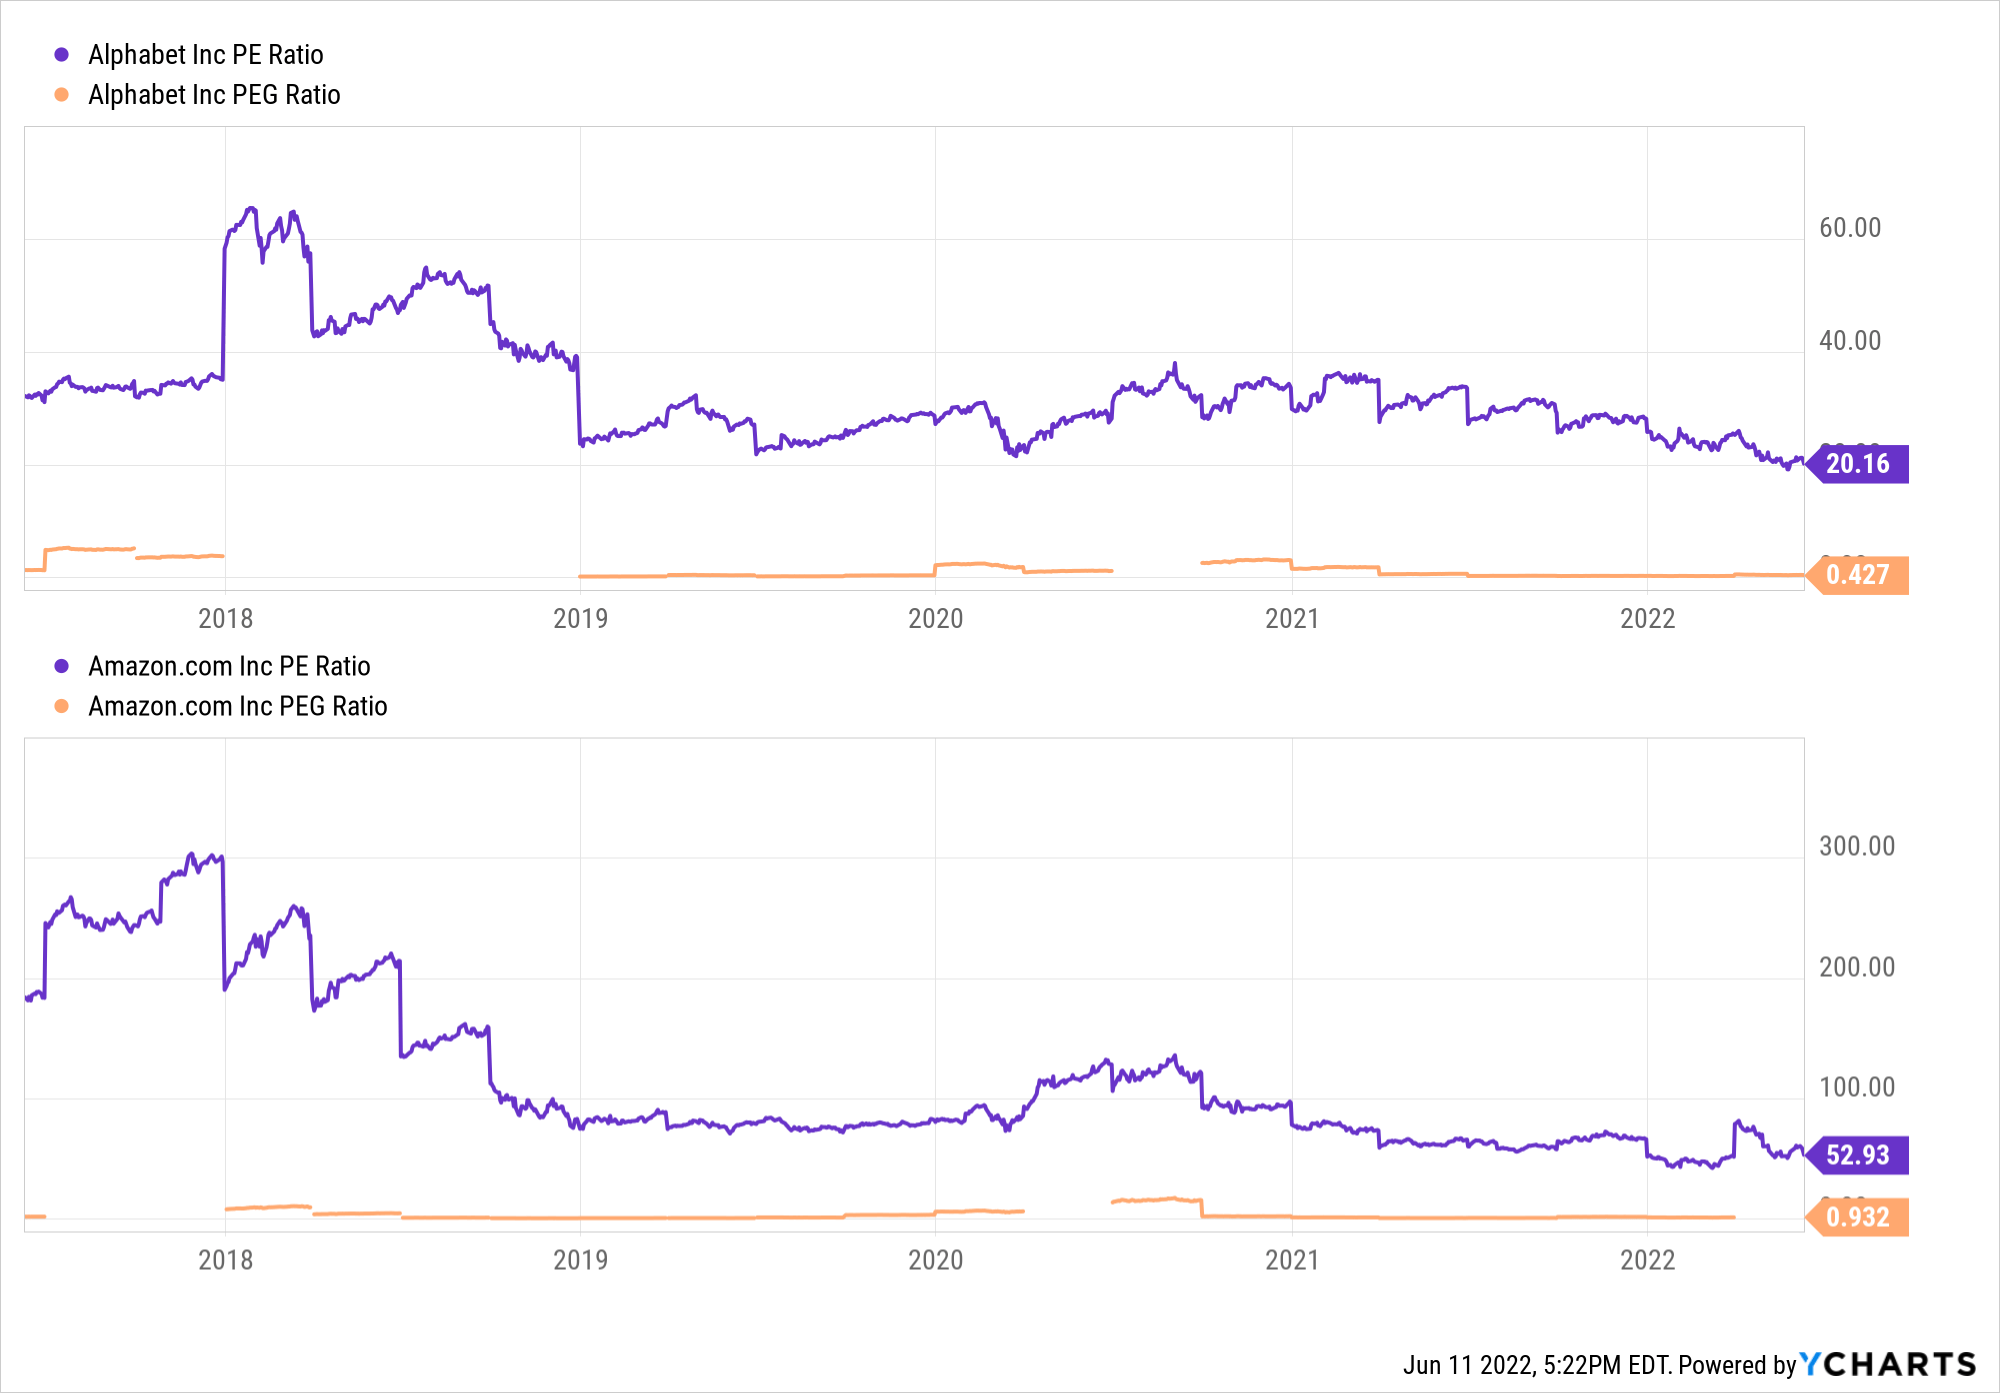
YCharts
Concluding Thoughts
My followers know that Amazon is one of my largest positions; however, that position is based on a long-term time horizon (5+ years). If I must choose between Google and Amazon as a stock split (short-term, less than 12 months) buy, I would go with Google due to stronger fundamental and quantitative data, similar technical setup, and lower relative valuation.
Key Takeaway: I rate both Amazon and Google as “Strong Buys” at current levels; however, as a stock split (near-term catalytic) buy, I prefer Google.
As always, thank you for reading, and happy investing. Please feel free to share any thoughts, questions, or concerns in the comments section below.
Be the first to comment