

4kodiak/iStock Unreleased via Getty Images
Investment Thesis
Amazon.com (NASDAQ:AMZN) still has a long runway for growth in its market and has been run by a good management team well known for having a long-term view. Its two main business areas, retail and cloud, have in common that they both can benefit from maximizing operating leverage.
Operating leverage results from a cost structure that mainly consists of fixed expenses. The company has invested a lot of money in building fulfillment centers for retail businesses and data centers for cloud businesses. These capital expenditures run through income statements as a fixed expense for the long term. However, its massive spending will hurt the stability of its cash flows immediately even though it is set to be long-term.
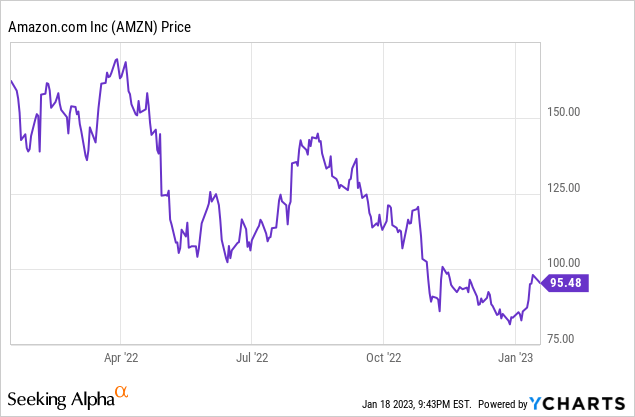
The company’s stock price declined severely after the market shifted its focus toward negative free cash flows. However, I do not see it negatively. It increased its spending during the pandemic and its networks doubled during that time. The next step is that it will maximize its operating leverage by streamlining the network it has invested in. So, the recent stock price drop provides a good investment opportunity for long-term investors, considering the company’s attractive growth potential and competitive advantages such as high barriers to entry.
Company Overview
The company generated annual revenue of about $469 billion and annual operating profits of about $24 billion in 2021. It reports its financial performance by three business segments including North America, International, and AWS. The North America and International segments consist of retail sales and subscriptions in each geographical market while the AWS segment reports the global sales of compute, storage, database, and other services. The North America accounted for the largest share at nearly 60% of the total sales while AWS represented about 10%. On the other hand, AWS is making larger profits than the North America segment at over 70% of the total operating profit in 2021.
| Business Segments | The share of Revenue | The share of Operating profit |
| North America | 59.6% | 29.2% |
| International | 27.2% | (3.7%) |
| AWS | 13.2% | 74.5% |
Source: Annual reports 2021
As you can see, the company is one of big tech companies on a global scale but you may think its business segments are not correlated compared to rival companies such as Microsoft (MSFT) and Google (GOOG) (GOOGL). MSFT and GOOG are both more software-centric and asset-light while AMZN seems more related with physical assets such as fulfillment centers and even a fleet of airplanes.
But, I believe the company’s businesses have more in common. First, retail and cloud computing businesses require heavy capital expenditures to build fulfillment centers for retails and data centers for cloud computing services.
Second, location and scale are critical to do both businesses to be competitive in both. As e-commerce grows more and more, customers expect the faster delivery from retailers, and in order to meet that expectation, the widespread networks of fulfillment centers or warehouses must be in place. Likewise, the requirements for logistics are also applicable to data centers. Organizations are increasingly moving to cloud services instead of running their own IT infrastructure but with data centers off-site, reducing or minimizing latency issues is very important. To deal with latency issues, data centers must be geographically scaled.
Third, thanks to the two reasons mentioned above, both businesses show a great level of operating leverage. Due to the heavy investment in fixed assets, their cost structures consist mostly of fixed expenses. A business with heavy fixed assets creates high barriers to entry by itself. And by fending off competitors, it can maximize profits just by increasing sales. Therefore, it is important for a business with high operating leverage like AMZN to have a big and growing market.
AMZN has endlessly long runway for growth
The company is in global retail and cloud industries. And both are a huge and growing market. First, according to the U.S. Census Bureau, U.S. retail sales excluding gasoline reached $6,522,609 million in 2021, growing at a compounding annual rate of 5.3% from 2011. On the other hand, the company’s U.S. sales just accounted for 4.7% of total U.S. retail sales, indicating more room for growth for decades.
When it comes to e-commerce, according to the same agency above, the sales of U.S. e-commerce reached $958,715 million, indicating that about 16% of retail sales are made online, increasing from 5.6% in 2011. And as you all know, the growth of e-commerce was accelerated during the pandemic. From 2011 to 2021, the size of e-commerce increased at a compounding annual rate of 17.0%, but from 2019 to 2021 it grew at a rate of 30.0%. When compared to only e-commerce, the company’s market share in U.S. is up to about 30.0%.
If you look at e-commerce alone, you might think that Amazon has already entered the maturity stage. But I don’t think so because it is not a separated market. The market penetration rate of e-commerce is highly likely to increase more than it is now. Since online purchases provide more valuable experience to consumers than offline, companies that can best serve consumers will seize the fruits of the growth of the retail market in the future.
According to the data from the U.S. Census Bureau linked above, the U.S. retail industry generated consolidated operating profits of $596,623 million in 2021 and showed operating margins of average 7.5% for the past decade. On the other hand, the company’s operating margin was averaged to be 3.5% for the past five years. It does not mean that the company lost money or lacked competitive advantages. It invested its resources to grow for the future because it is still a growing company.
AMZN has an ability to sustain its strong moats in the industry
To compete to capture the value in the retail industry, retailers must do innovative jobs. McKinsey & Company provides a report about their insight of seven imperatives for retailers. Among them, improving delivery speed provides a distinct competitive advantage. According to the report, over 90% of consumers see 2- to 3-day delivery as the baseline, and 30% expect same-day delivery. In addition, over 75% of the specialty retail supply chain leaders have made 2-day delivery a priority, and 42% are aiming for same-day delivery by 2022.
In that sense, AMZN’s increased investments during the pandemic have made its moats wider and stronger, and took the better position to prevent rivals from competing. From the recent earnings call, the company management said the company’s network doubled over the last 2.5 years. This increase seemed too much. But e-commerce is forecast to exceed 20% of total retail sales, but fulfillment networks were built to handle half that volume. Given that penetration rate was 17% in 2021, the company’s decision to expand its networks was not too much, but rational. And it was made when the money was the cheapest.
The next step is maximizing operating leverage it has made and will be able to capture the value with its superior fulfillment systems. Retailers with technology will be expected to improve margins from 300 to 800 basis points, for example, by automating the supply chain and distribution centers or boosting private-brand innovation and sourcing excellence. I expect the company to achieve the margin improvement over the long term.
There is much sweeter growth and value in cloud computing, but it is not easy to get
AWS, one of Amazon’s main businesses, provides cloud computing services. The benefit of cloud computing to customers is that it can save them money and provide flexible capability of their IT infrastructure. Thanks to its value proposition compared to own IT systems and technological advances, the cloud industry has a long runway for growth. McKinsey & Company estimates there is more than $1 trillion dollars up for grabs across fortune 500 companies. The company’s AWS sales were about 62,000 millions, indicating about 6.2% market share of potential value of cloud computing.
AWS is ahead of Microsoft and Google by revenue. As mentioned earlier, cloud businesses benefit from economies of scale. First, bigger data centers can deploy computational resources at significantly lower cost per unit. Second, scale help secure more diverse customers, geographic regions, and application demand patterns, which improve the utilization of computing, storage, and network resources. Third, multi-tenancy locations can lower application maintenance labor costs.
I think the second one is important. The reason why cloud computing services are attractive from a customer’s point of view is that they make customers’ IT expenditures a variable cost. When they operate their own IT systems, it is spent as a fixed cost. And once installed, making adjustments is difficult, resulting in wasted resources.
However, cloud computing services allow them to use as much as they want and the cost is incurred accordingly. That’s why cloud computing services provide a better value proposition than directly operated IT systems. But, as a cloud service provider, if you have built data centers, you need to get customers enough to compensate for fixed costs. If customer demand declines at the same time, profitability would decrease. Therefore, it is necessary to secure a variety of customers, geographical demands, and usage patterns. To do this, it is important to maintain a vast networks of data centers that can meet various demands and diversify the risks.
AMZN not only has a competitive scale, but also operates in areas where technology can unlock more value. That is retail. By leveraging the cloud, retailers can analyze very large amounts of data to increase accuracy and reduce waste, enabling inventory optimization. Optimization and analysis by cloud is also applicable to other industries like healthcare, oil & gas, and banking. So I think the synergy that the company gets from retail and cloud together is significant because the company can provide real use cases to its customers unlike its rivals.
Valuation
I prefer to use the earnings-yield method for valuation of companies with stable cash flow, such as Amazon. The company’s credit rating, according to S&P, is AA, which is comparable to that of U.S. Treasuries. U.S. 5 year treasury yield is about 3.526%, which means we can earn about 3.5% investment returns over 5 years with certainty.
To compare with the risk-free return, I forecasted next 5 year cash flows of Amazon. My assumption is as follows.
First, the company’s sales growth rate is expected to show a high growth rate, considering that the market size of the industry the company operates in is large and has sufficient growth potential, as discussed above. North America expects an average annual growth rate of 20%. International is expected to grow 15%, considering the high volatility of past growth rates. AWS will grow at a rate of 30% to 20% over the next five years.
Next, I assumed expenses. Cost of sales as a percentage of revenue is expected to remain at the historical average of 60%. Operating expenses such as marketing, G&A, research, and other operating expenses are expected to increase by +1%p compared to the past average, and then decrease by -0.5%p from the past average in anticipation of margin improvement through optimization of invested assets.
Based on the assumptions I made, the EBIT margin will increase from 0.8% in the first forecast year to 6.8% over the next five years. The average EBIT margin over the past five years was around 5%. And finally, since the company is a tech company anyway, I capitalized operating expenses such as research and marketing to adjust its operating profits and invested capital. The goal of capitalizing these expenses is to treat them as capital expenditures.
My valuation results are below.
| (Unit: Million, %) | LTM | 2023(F) | 2024(F) | 2025(F) | 2026(F) | 2027(F) |
| EBIT | 12,971 | 5,011 | 13,016 | 30,309 | 51,498 | 83,685 |
| (+) Selling & Marketing | 40,230 | 43,446 | 50,618 | 56,287 | 61,798 | 69,728 |
| (+) Research & Development | 67,712 | 79,650 | 94,004 | 108,245 | 125,656 | 143,149 |
| (-) Selling & Marketing Amortization | (21,036) | (27,434) | (32,772) | (38,720) | (44,576) | (50,317) |
| (-) R&D Amortization | (29,166) | (36,875) | (45,430) | (55,145) | (65,765) | (77,743) |
| EBIT, adjusted | 70,711 | 63,798 | 79,437 | 100,976 | 128,611 | 168,503 |
| Current Enterprise Value | 1,075,478 | |||||
| Forward Earnings Yield | 5.93% | 7.39% | 9.39% | 11.96% | 15.67% | |
| 5-Year Treasury Rate | 3.53% | 3.53% | 3.53% | 3.53% | 3.53% |
Comparing the next year’s earnings yield with 5-year treasury yield, the investment in the AMZN stock does not compensate for equity risks. But the advantage of investing equities is that it can take profits from the growth while fixed income securities provide no growth. If we evaluate the investment with a long-term view, not just the next year, we can expect the earnings yield to grow to above 15% at the current market valuation over the next five years.
I believe it is highly probable considering that the company’s recent expansionary investment, operating optimization, and growth prospects in a very large market.
In conclusion
Amazon has a still long runway for growth in big markets, and competitive advantages to sustain its superior position. Recently, the market has concerns about its ability to make positive free cash flows, but when there is demanding priority for growth, it is inevitable to spend capital for growth. Now is the time to see how the company optimize its pre-spent investments to make a huge profits in the future, which the company is well known for being good at. So, I believe it is a good time to initiate the investment in the company’s stock for long-term investors.
Be the first to comment