

georgeclerk/iStock Unreleased via Getty Images
Amazon is trading cheaply on its historical metrics
Amazon.com, Inc. (NASDAQ:NASDAQ:AMZN) is a company that is beloved by a couple of fund managers that I respect a lot. Namely, Joel Greenblatt and Bill Miller, both value investment legends. On a March episode of “Richer Wiser Happier with William Green,” William was able to have an in-depth interview with Greenblatt, who labeled Amazon amongst the strongest 3 companies he has ever seen. While we can see that Amazon is represented prominently in Gotham Asset Management’s 13f top 10, the interview indicates that Amazon most likely occupies a top 3 spot in Greenblatt’s personal portfolio.
Gotham 13F (Whalewisdom.com)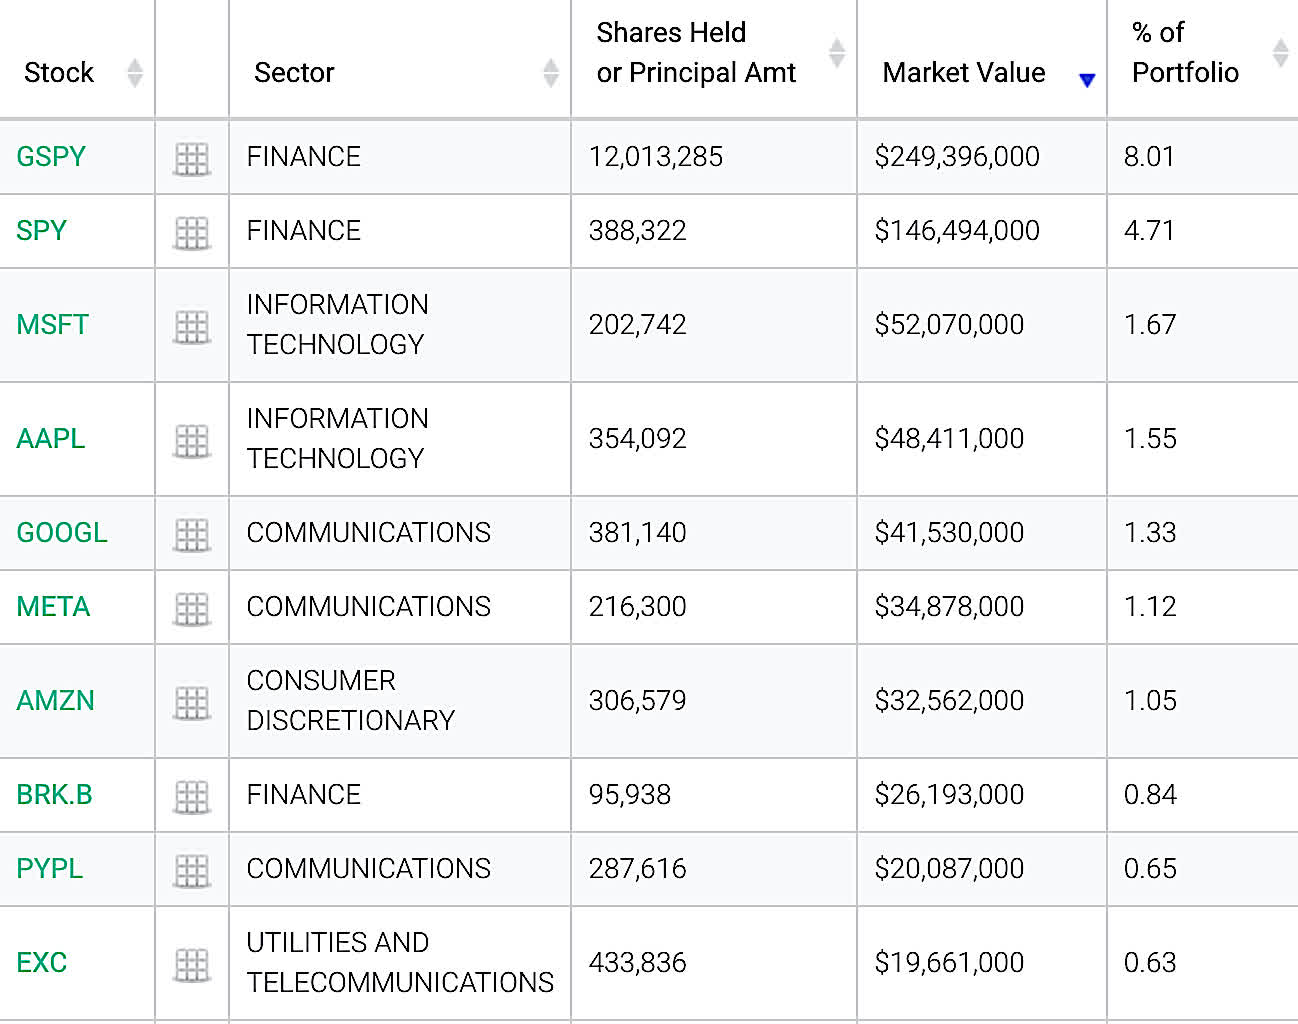
The other two companies he labels as the 3 strongest he’s seen would be Microsoft (MSFT) and Google (GOOG, GOOGL). All three share the commonality of large R&D spend plus high returns on invested capital. The other metric that Greenblatt often likes to reference as a measure of value is the earnings yield, or EPS/Share price. The earnings yield metric is particularly effective when comparing equities to bonds. This shows what is your actual total return in earnings per share as a percentage of the share value. If we use this metric for Amazon, we get TTM EPS is $1.12/ $135.9 = .8%, a very paltry yield to say the least, yet one of the higher yields for Amazon on a historical average. This is not the metric floating their boat.
Getting into Amazon’s return on invested capital, the company on a TTM basis is achieving a return of 15.43%. This is the return they make on the money they invest in their operations. 15+% is excellent, but Amazon has shown much higher ROIC in the past when a larger amount of their capital was being invested in technology vs. PPE (Property, Plant and Equipment).
How about Bill Miller? While we can argue that Bill is not a traditional value investor, he is certainly the largest Amazon bull, putting a reported 80% of his wealth in Amazon and Bitcoin. You can also listen to a recent interview with him regarding this investment on Richer Wiser Happier May 2022 podcast.
Miller Value Partners 13F (Whalewisdom.com)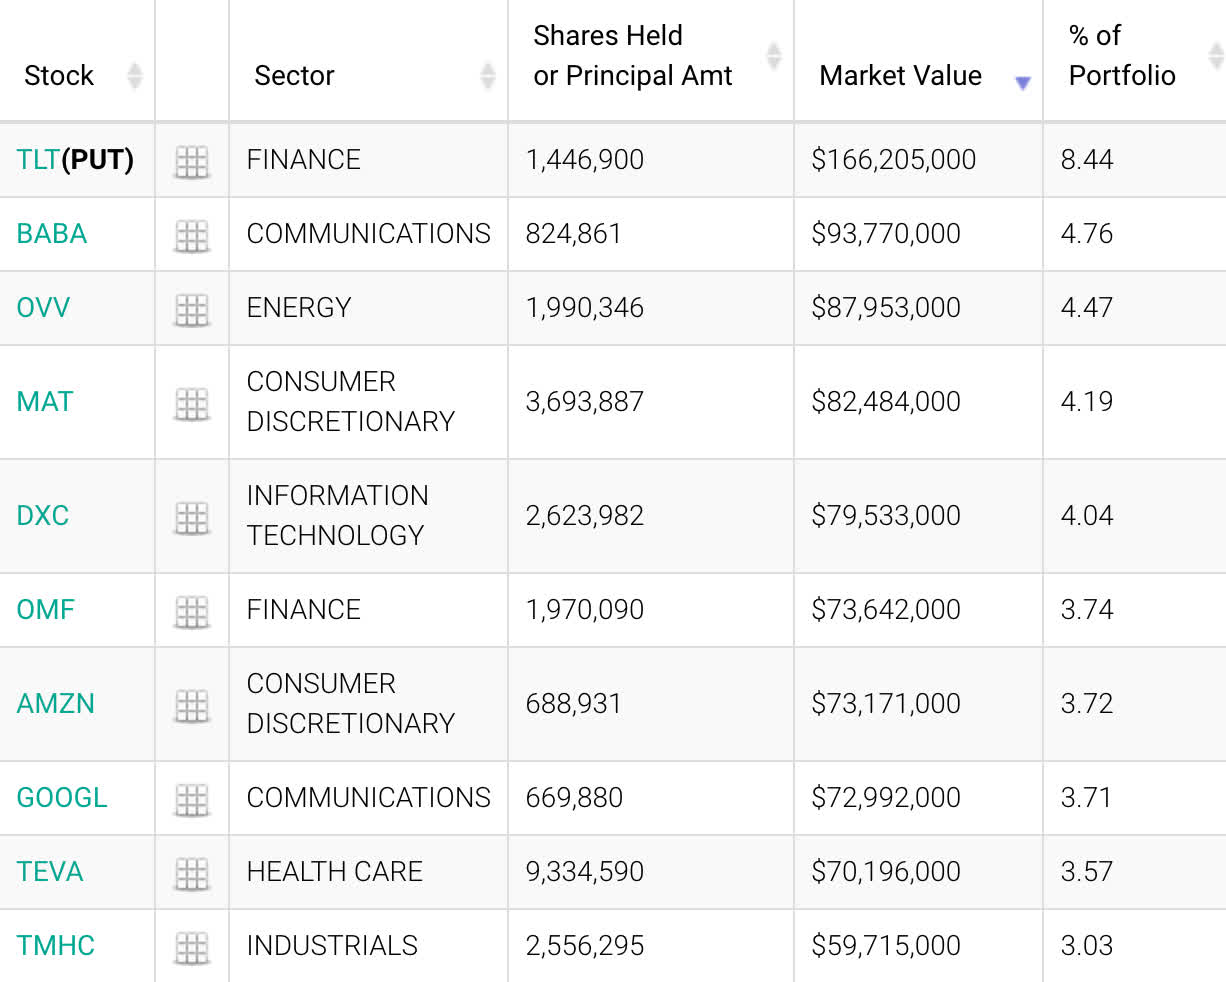
Here we can also see in Miller Value Partner’s 13F that Amazon rounds out the top 10, but not in the top 5, indicating it’s not the best value he sees right now, a similar indicator on Gotham’s 13F. However, they both personally hold large positions in their personal accounts as indicated in interviews.
As most investors in Amazon probably know, the company is historically valued on a price to sales and enterprise value to EBITDA basis. With Amazon, this is a very unique enigma because they both have massive amounts of R&D as well as property and equipment depreciation. They have engineered a business that can shelter itself from taxes for a long time to come. Although the warehouse business is not its biggest grower or profit maker, it provides a substantial amount of straight-line PPE depreciation that protects the earnings of the other businesses. This system creates an amazing internal system of compounding business growth that continues to expand both revenue and EBITDA.
macrotrends.net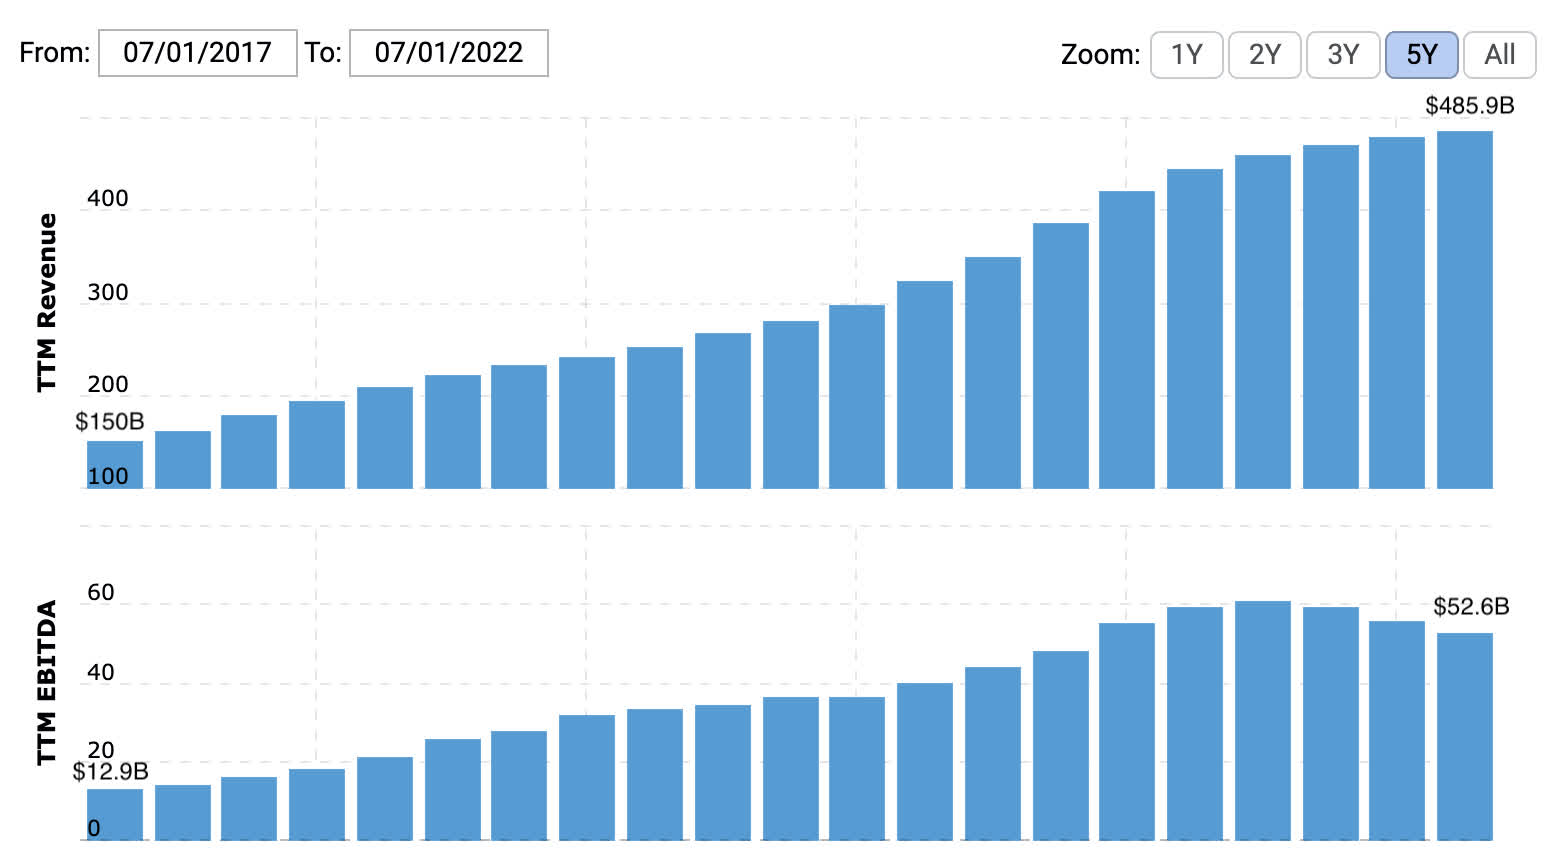
Here we can visualize the company’s growth in revenue and EBITDA from 2017 to current. The CAGR in EBITDA from 2017-2022 is 32.15% while the CAGR in revenue is 26.45%. Both of these are outstanding over 5 years. While Amazon is not the cheapest stock in tech at the moment, it is unique with a wide moat in both its business and accounting write-offs, trading at one of its lowest valuations on an EV/EBITDA basis at 27 X EBITDA.
My thesis is the stock is a buy at these levels and below. This article will analyze the recent CAPEX the company has on its books and the future tax advantages it will create. We will furthermore delve into the historical Enterprise Value to EBITDA multiples the stock has traded at to see how low we are today versus history.
Property Plant and Equipment during Covid
Amazon PPE (yahoo finance)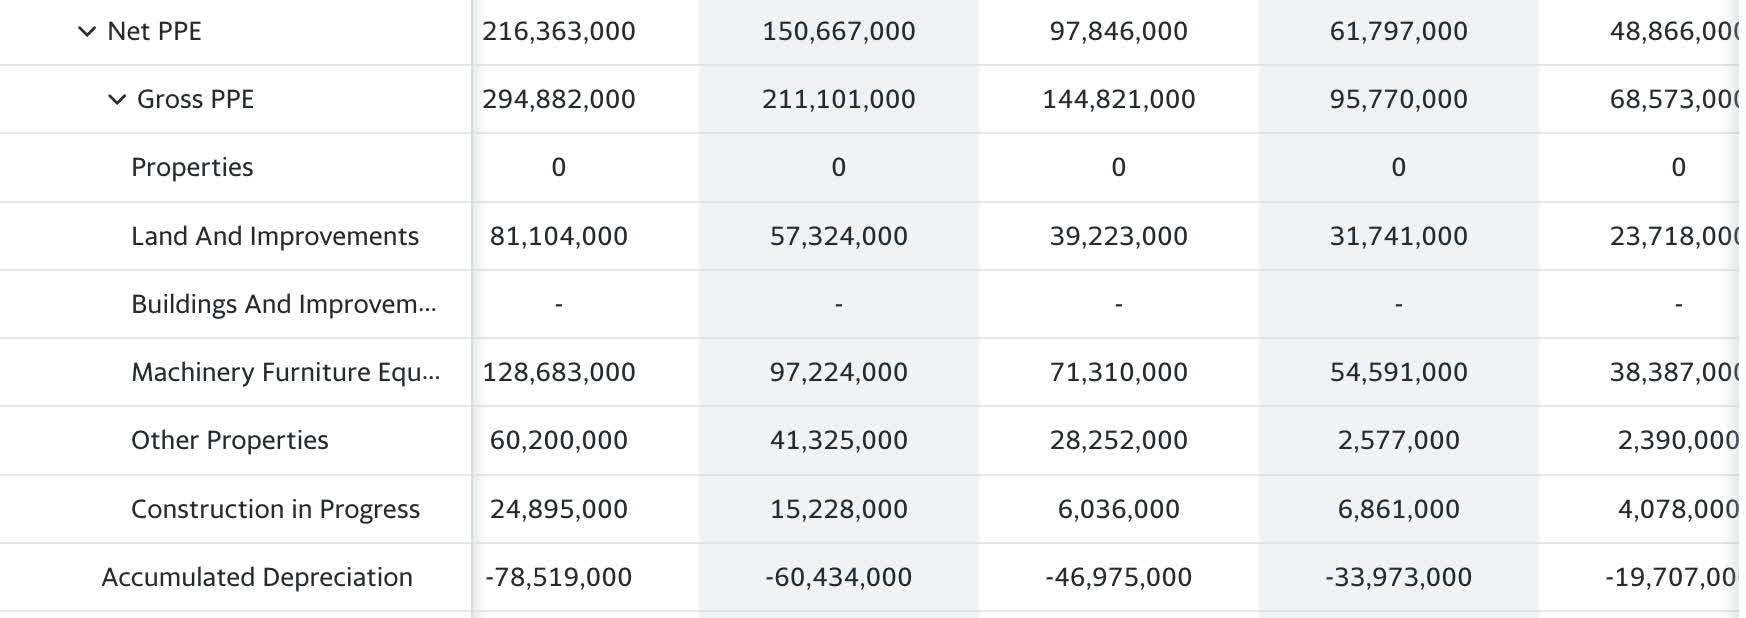
Let us first take a look at the Gross PPE growth rate for the years 2019-2021 which went from $144 Billion to $294 Billion. The growth rate in value on property plant and equipment averaged 26% increases each year for this period. The period preceding this, 2017-2018, only averaged 18% increases in gross PPE. We can divulge from this that construction and spending on tangible assets increased significantly in the past few years. The net PPE, the amount after adding all items included in gross PPE minus accumulated depreciation of $78 Billion, leaves Amazon with $216 Billion in net PPE to carry forward and depreciate.
While accumulating a database of all equipment ages and useful life of tangible assets is beyond the scope of what we are going to do here today, we can analyze the annual growth rate in accumulated depreciation to see what to expect from forward depreciation expenses. In 2017, accumulated depreciation was at $19 Billion, and in FY 2021 it was at $78 Billion, a 5-year average increase of 32.63 % per year. From this reasonable estimate for forward depreciation expense, we can expect to add $25 Billion in write-offs ($78 B *1.3263= $103B -$78 B= $25 B) to the war chest.
An additional $25 Billion in tax deductions, preserving the capital to reinvest in a company that has an ROIC of 15% could create a lot of future growth in EBITDA.
Recent R&D spend
Amazon R & D (macrotrends.net)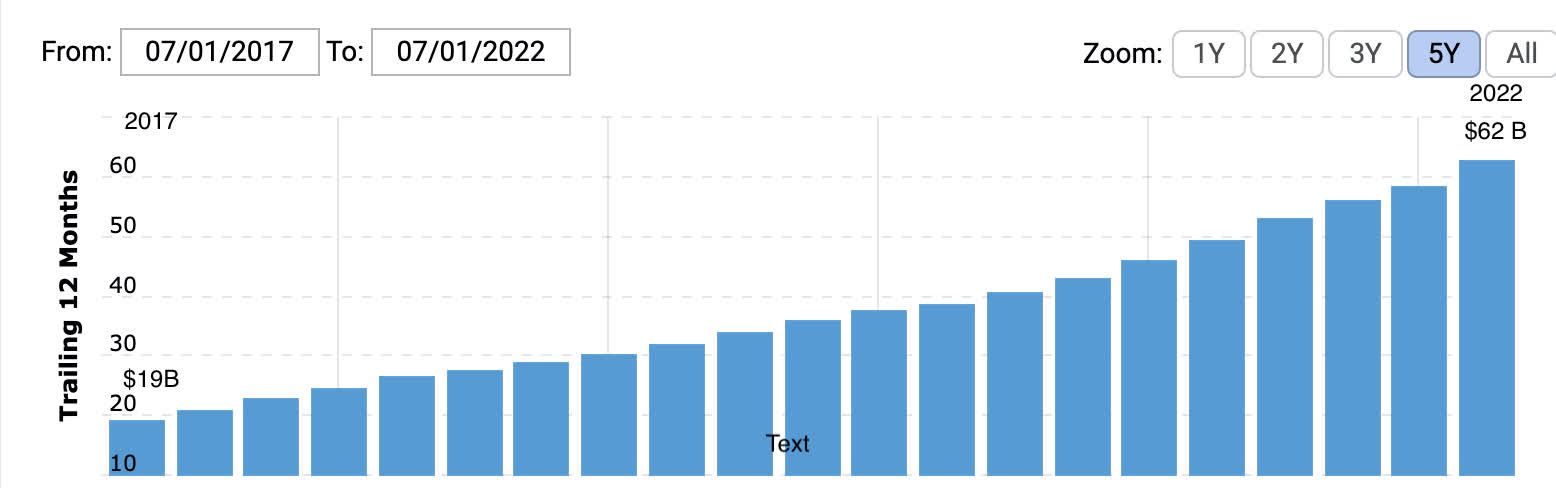
Taking a look at Amazon’s R&D spend from 2017 to 2022, we can see the expense growing from $19B to $62B, a CAGR of 26% over these 5 years. Being that research and development is a tax credit, reducing tax liability dollar for dollar, this allows Amazon to continue innovating and inventing amazing products and patents. Some of these include AWS and Alexa.
This subsidized benefit is responsible for most of Amazon’s profit-making machines. Again, to visualize what kind of extra profit can be created by $62 billion in tax savings for a company getting a 15% return on invested capital, it is in the neighborhood of $9 Billion in EBITDA.
Amazon Profit (visualcapitalist.com)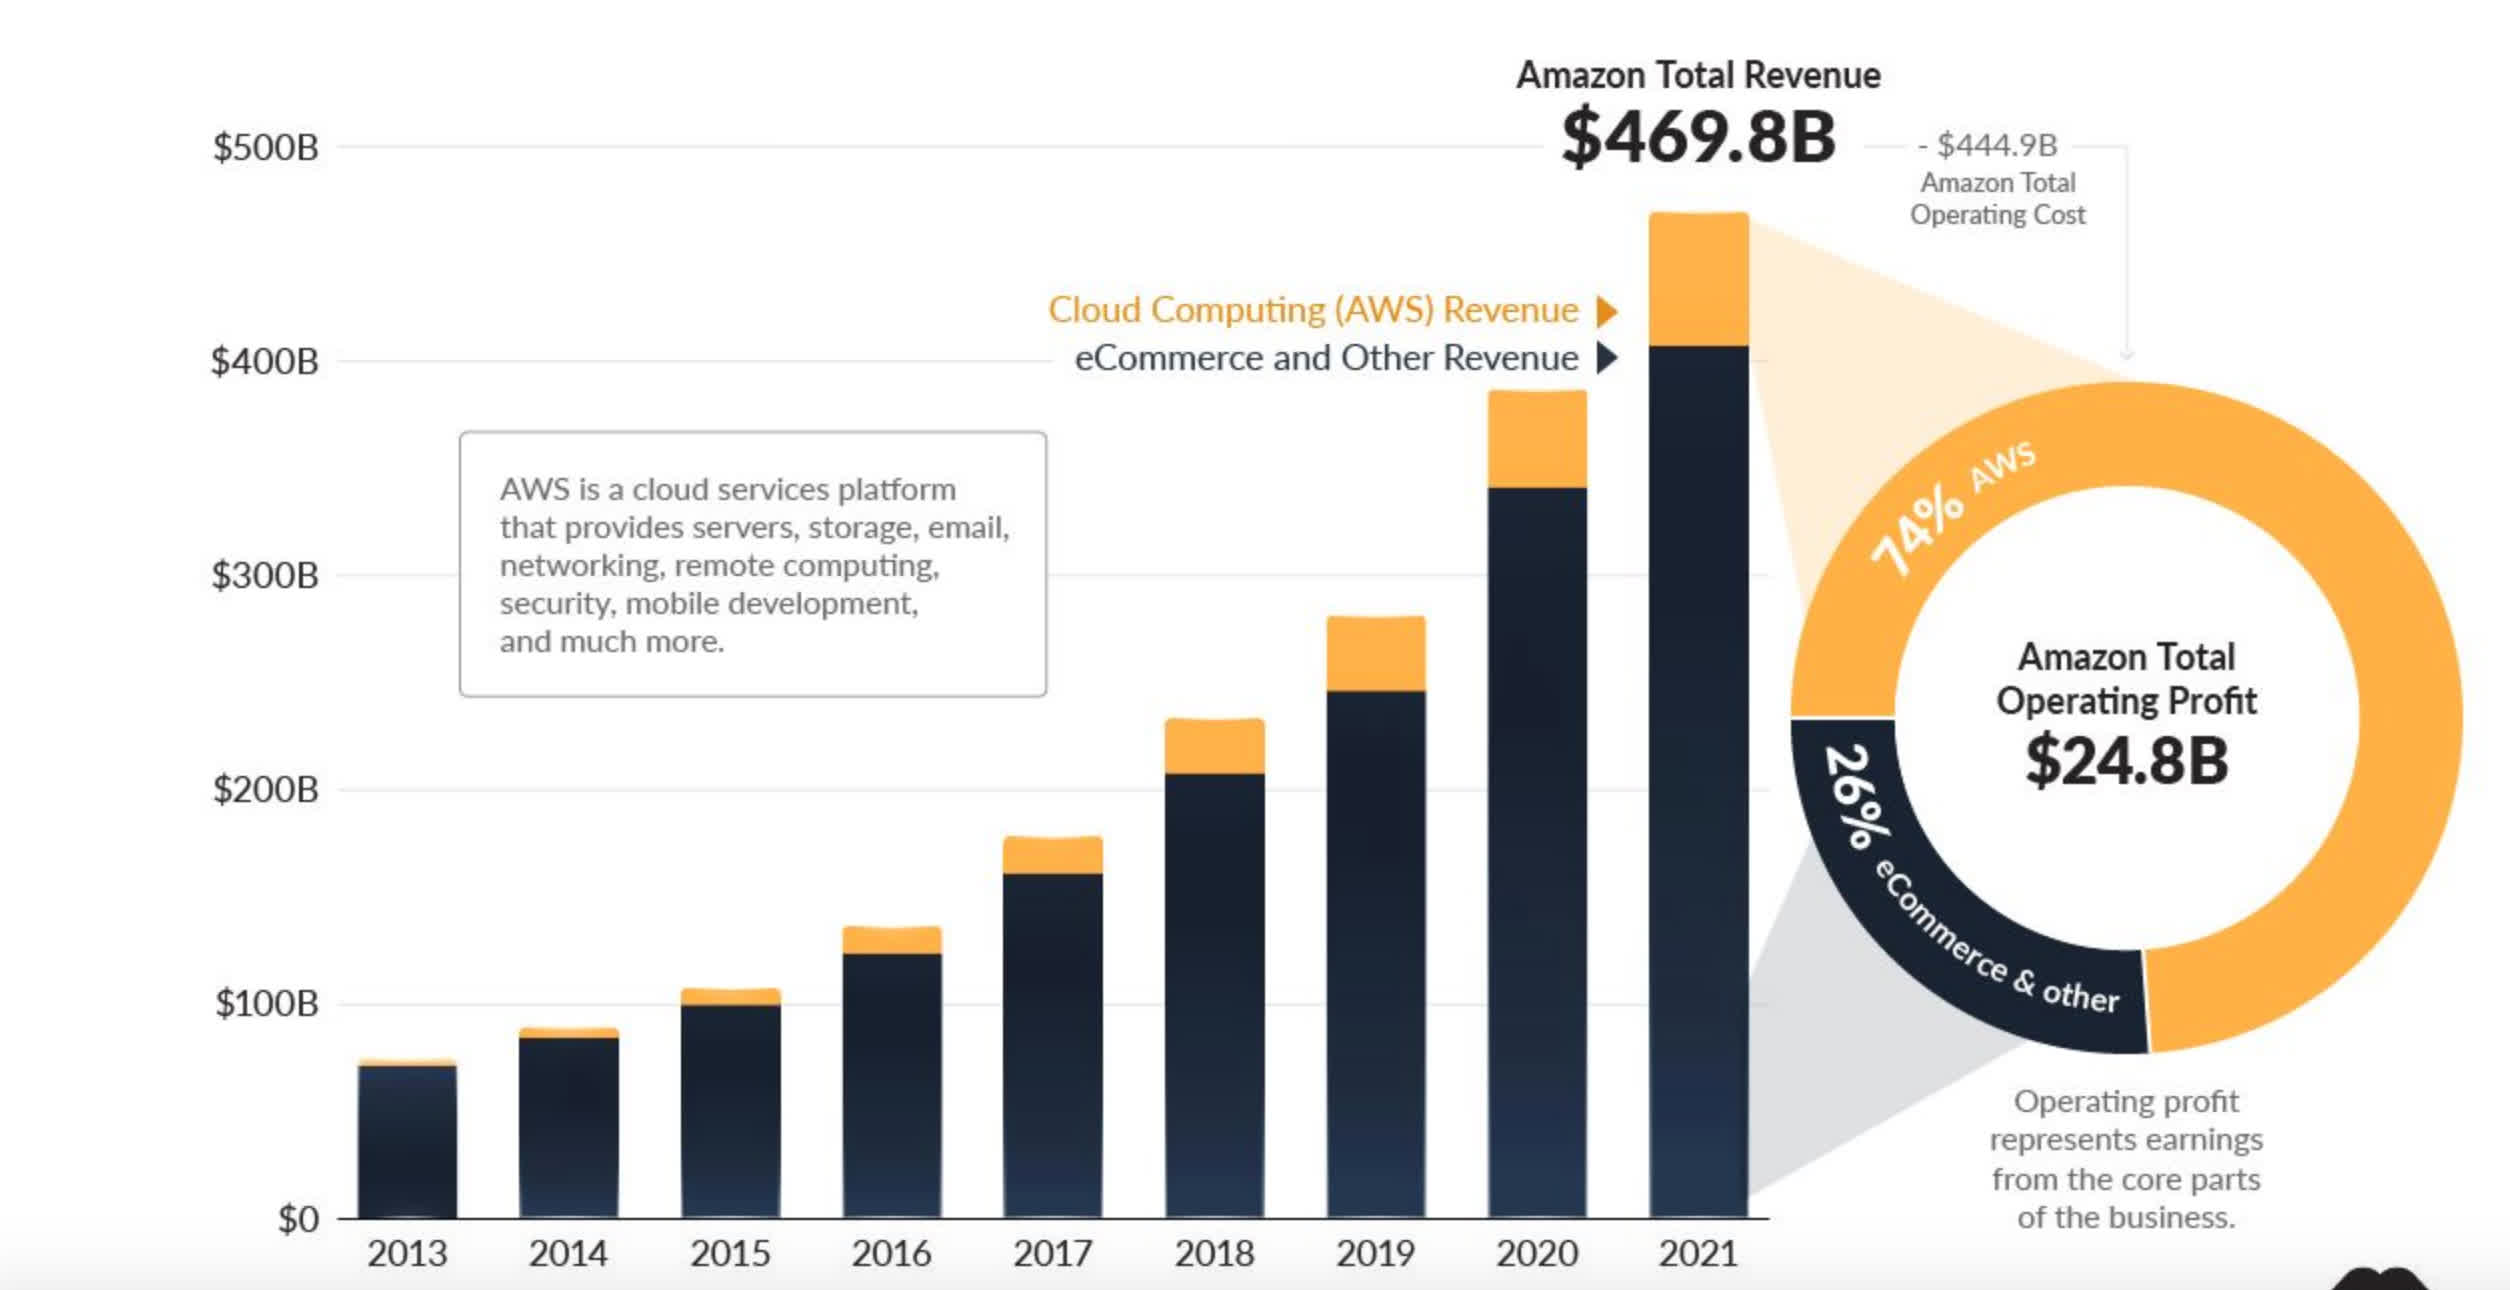
One of the best visual breakdowns I could find from this came from visualcapitalist.com. We can see that although the eCommerce segment contributes to the lion’s share of the revenue, 74% of the operating profit comes from AWS. With hints of a PPE expansion slowdown on the horizon, R&D spending for future projects has a high likelihood of being a good place to reposition capital.
Even though many new developments fail, the ones that hit can add enormous profit in higher margin areas. Combine this with a lot of built-up depreciation expense to be used in future years from the Covid warehouse expansion and Amazon is certainly rife for a few more R&D hits on the horizon.
A possible shift in spending
Having followed several Amazon stories recent, the company has indicated that it may have created too much capacity in its warehouse business during COVID, leading to plans to shutter some of the locations. The warehouse business occupied a large portion of its invested capital and business growth during the COVID era. The plans to contract vs. expand this segment could indicate a shift back to AWS and other technology-related investments versus hard assets.
So here is the strange fundamental anomaly we are faced with today, Amazon has been increasing its tangible assets at a record clip whereas in the past a larger portion was dedicated to intangible assets. This puts us at near record low book value on the company at 10 x (I know, not that impressive, but compared to its high of 28 X it’s to be noted). The only other period where it traded in this range was from 2008-2011, and in 2008, EBIT and EBITDA were nonexistent, earnings were negative. In 2011, Amazon only had $631 million in earnings and about $1 Billion in EBIT.
The increase in tangible assets combined with the large amount of EBITDA has led to the lowest Enterprise Value to EBITDA price on Amazon I can find on record.
Valuation..
We’ll look at a few metrics here, first using the PEG ratio tweaked to account for EBITDA versus earnings per share. For those unfamiliar with the PEG ratio, it was popularized by Peter Lynch at Fidelity’s Magellan Fund. From 1977 until 1990, the Magellan fund averaged a 29.2% annual return, and as of 2003 had the best 20-year return of any mutual fund ever.
The ratio is quite simple, compare the trailing 3-5 years’ CAGR in earnings growth to the current P/E ratio. If a stock’s CAGR was growing at 25% per annum and the P/E ratio was 25, we drop the percent sign from the growth rate as our G, representing the numerator, and use the P/E of 25 as the denominator. 25/25=1, a PEG ratio of 1 and below indicates a cheap stock.
If we examine the past 5-year increase in EBITDA for Amazon, we come to a 32.15% CAGR in EBITDA growth. Using an EBITDA to EV (enterprise value) ratio instead of a price to earnings ratio, the enterprise currently sits at 27 X EBITDA. If we divide 27 by 32.15, we get a reworked PEG ratio of .83. Maybe we should call it the EVEBITDAG ratio (doubting that acronym would catch on).
With Amazon EBITDA at $52.6 Billion and net income at $11.6 Billion in FY 2022, EBITDA is 4.48 X greater than net earnings. With TTM EPS at $1.12 a share, EBITDA is 4.48 X more, or about $5 per share in EBITDA. If are willing to use the above ratio and 32.15 as our multiplier, we would get a fair value of 32.15 X $5 = $160 a share.
I know from a logical perspective if I am to modify any classical formula I should be conservative and use EBIT instead of EBITDA. However, the Amazon story is almost completely predicated on tax deductions that subsidize the company to redeploy that capital into higher margin growth stories, so please forgive me in this one instance. If it were any other company besides Amazon I would say that EBITDA is an inappropriate metric to substitute for.
Historical EV/EBITDA
At 27 X EBITDA, I cannot find a lower instance in history where the stock traded at this value. It usually trades around 100 X EBITDA and the second lowest valuation I can find on record was 39 X EBITDA in 2008. If we are comparing Amazon to itself, all things considered, the stock looks cheap.
Potential catalysts
Semiconductors:
Within the AWS segment, Amazon also designs its semiconductors and GPUS, namely the graviton chip series which is in its third generation. As more and more systems and services move to the cloud, chips used in servers versus traditional desk and laptops are getting a greater and greater share of the semiconductor TAM (total addressable market). This is a great area for future R&D spending that could pay massive dividends for the company.
Additions to Prime Video original content:
There are a few good original shows here, but certainly an area that could use some extra capital. With Netflix (NFLX), Disney (DIS), HBO, owned by Warner Bros. (WBD), Apple (AAPL), and Paramount (PARA) going to war over the best streaming content, Amazon could step up its game and become a contender or even a leader in this space. I can imagine owning so much server farm capacity could lend a hand to Amazon in figuring out how to become the low-cost leader in highest resolution and highest speed data transfer to end users.
Astro home robot:
We have several other devices at varying stages of evolution (e.g., Ring and Blink provide the leading digital home security solutions, Astro is a brand new home robot that we just launched in late 2021), but it’s safe to say that every one of our devices, whether you’re talking about Kindle, FireTV, Alexa/Echo, Ring, Blink, or Astro is an invention-in-process with a lot more coming that will keep improving customers’ lives. – Amazon 2021 10 K
Astro the Robot (Amazon.com)
The Astro robot project integrates with several other wholly owned Amazon businesses. Whether or not this project becomes a hit is hard to say, but it is Avatar in real life, a robot that can monitor your home while you’re gone. It navigates any room in your house and delivers verbal messages to others. This comes at a time when the virtual robotic security guard market is just heating up.
Further AWS spending. Creating and innovating new patents to drive the AWS workhorse to higher and higher margins is a great, logical placement of capital. New CEO Jassy was the CEO of Amazon Web Services and should have some good ideas of where to spend and innovate to make AWS hum even faster.
How much extra might be allocated to R&D?
Versus 2021, we can see $24.8 Billion on the line item construction in progress, the most recent number is roughly $10 Billion higher than the previous year. Here is a good description of this accounting item from accountingcoach.com:
The costs of constructing the asset are accumulated in the account Construction Work-in-Progress until the asset is completed and placed into service. When the asset is placed into service, the account Construction Work-in-Progress will be credited for its balance (the accumulated costs) and will be recorded with a debit in the appropriate property, plant and equipment account.
Depreciation will begin after the asset is put into service.
Amazon Cash Flow Statement (yahoo finance)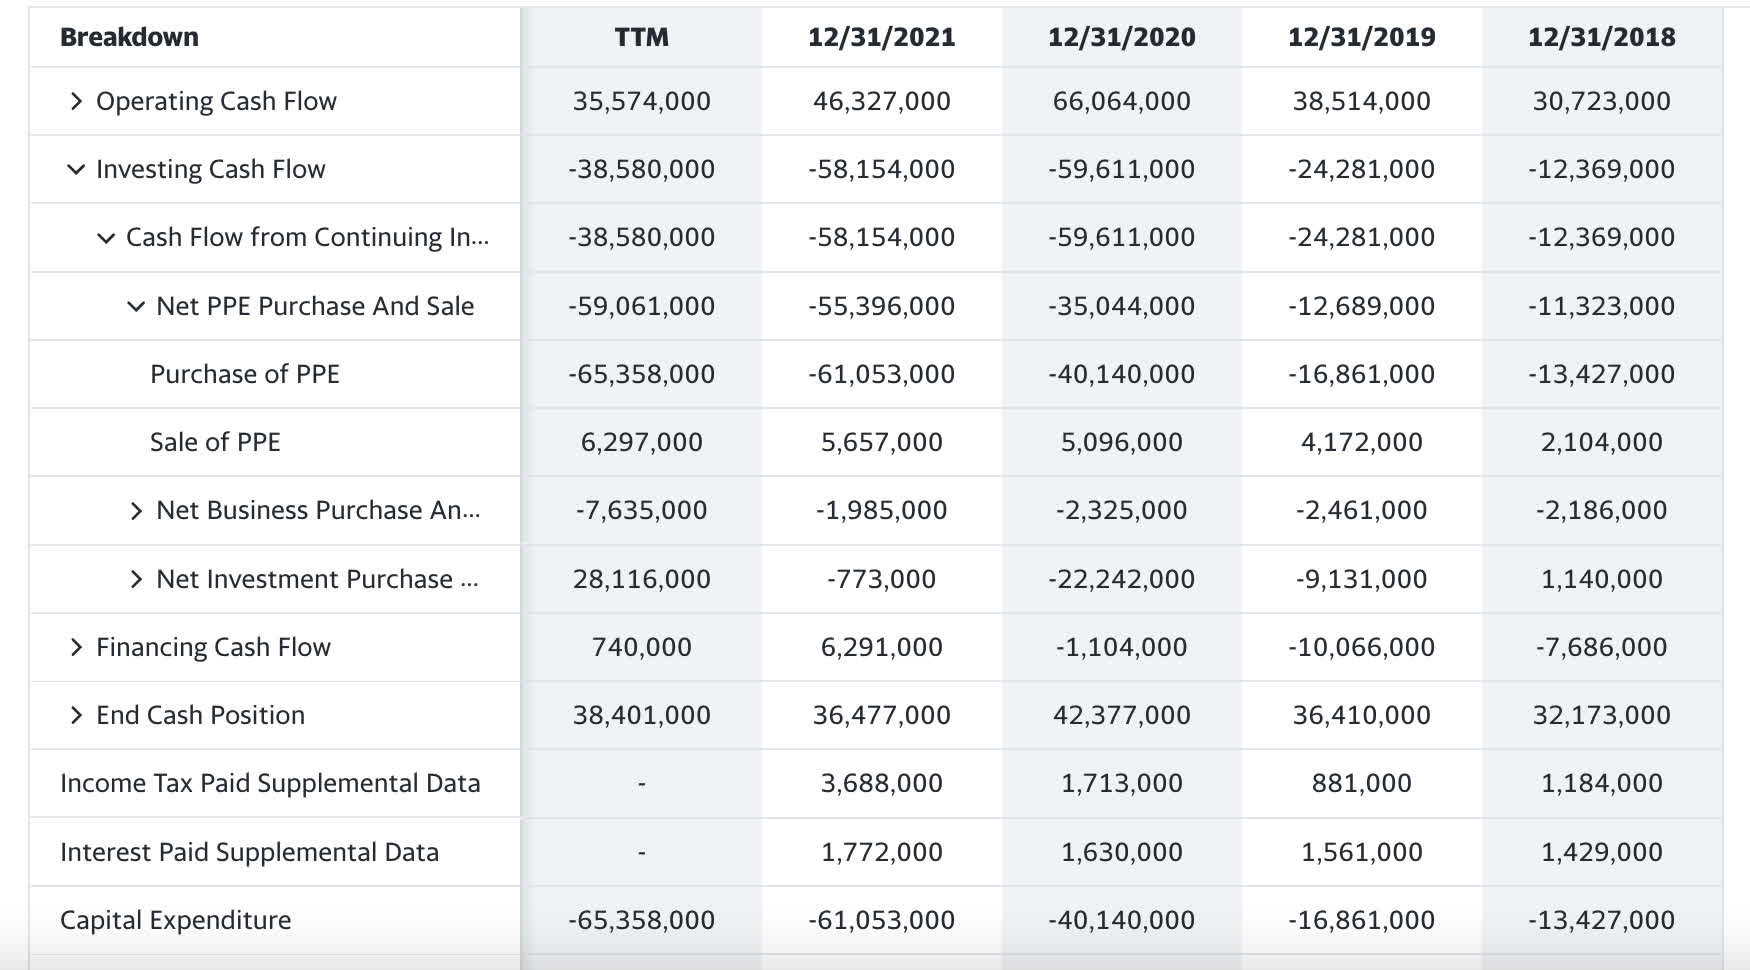
Upon digging into the Amazon cash flow statement, we observe a TTM of $59 Billion spent on PPE. This would include land, plants, equipment, automobiles, machinery etc. Let’s say the split in spending on plants is a 50/50 equipment and property spread. The main thing we’re trying to identify is how much has been spent on the construction of new warehouses. With an increase of $10 Billion on the construction in progress line, we can assume a majority of that is new construction spending. Into those factories goes equipment and logistics vehicles/equipment.
Assuming that new factories require new equipment and equivalent amounts of PPE spending are allocated to that, there’s $20 Billion of CAPEX that could be reallocated to R&D spending should Amazon cut construction spending. With 2022 profit margins for hit R&D-related projects like AWS at 29%, we might start to get excited at the prospects that Amazon could consider expanding these high-margin businesses with fewer dollars spent on new construction.
What about the debt?
Amazon’s cash on hand is $60 Billion, while cash and cash equivalents are at $96 Billion. Debt is relatively high for the company at $116 Billion which is a record. The debt to equity ratio for Amazon is 119% and the current ratio is just under 1 at .95. We can see that Amazon went on a record spending spree during Covid-19, expanding their empire at the fastest rate in the company’s history.
Interest expense
Amazon interest expense (yahoo finance)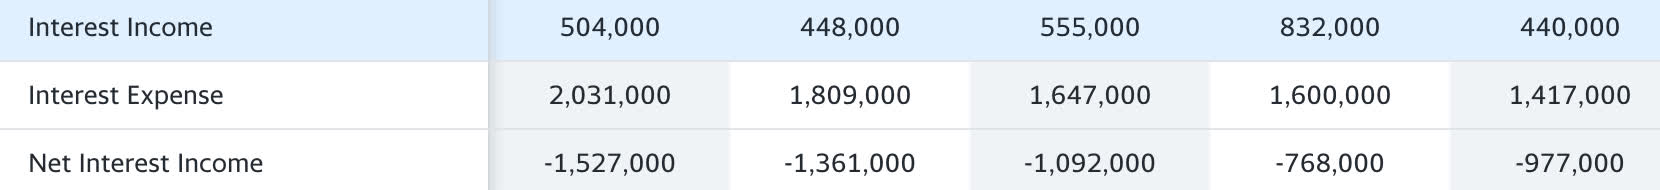
We can see net interest income at -$1.5 Billion, meaning they paid more than they collected on debt instruments. Negative net interest income has increased roughly 9% per year over the past 5 years with a notable increase from 2019 to current. This again coincides with large amounts of construction activities that we are assuming will slow down with the closure of a few properties indicating the company overbuilt its portfolio.
At this point, the debt would normally be a tad worrisome if the company had a dividend liability or low credit rating, especially in a rising interest rate environment. However, Amazon’s credit rating is stellar, with Fitch recently rating one of their debt offerings from April at AA-. This is an upgrade over their A+ rating last year, indicating Amazon is positioned for better debt coverage in the years to come.
Conclusion
After poking through Amazon’s income statement, balance sheet, and cash flow statement, I can begin to imagine some of the pieces to the puzzle that make this a compelling investment. The large increases in EBITDA combined with the lowest enterprise value / EBITDA rating I can find on record are all positives. While this is certainly not what I would consider the best value in tech, it does have an ultra-wide moat with its only comp being its historical valuations.
The company has an expanded footprint of data centers and warehouses after the Covid-19 “e-commerce wars.” The real property empire that they have will also provide a lot of carry-forward depreciation expenses for years to come. Re-allocating an estimated $20 Billion they used for new construction expenses into the general R&D pool of higher margin businesses and debt pay-down are exciting catalysts for me as well.
With Andrew Jassy as the new CEO, new high-margin R&D projects are right in his wheelhouse. Jassy was the previous CEO of Amazon Web Services from 2016-2021. I believe this is a good value at today’s prices when comparing it on an EV/EBITDA to EBITDA growth rate basis with a 27 X EBITDA and a trailing 32% EBITDA growth rate. This assumption uses 32 X as a multiplier and $5 EBITDA per share as the multiplicand. I’m finally beginning to understand what Greenblatt and Jim Miller see in the prospects of Amazon. Prices below $160 are a buy.
Be the first to comment