

5./15 WEST/iStock via Getty Images
Q3 updates and Thesis
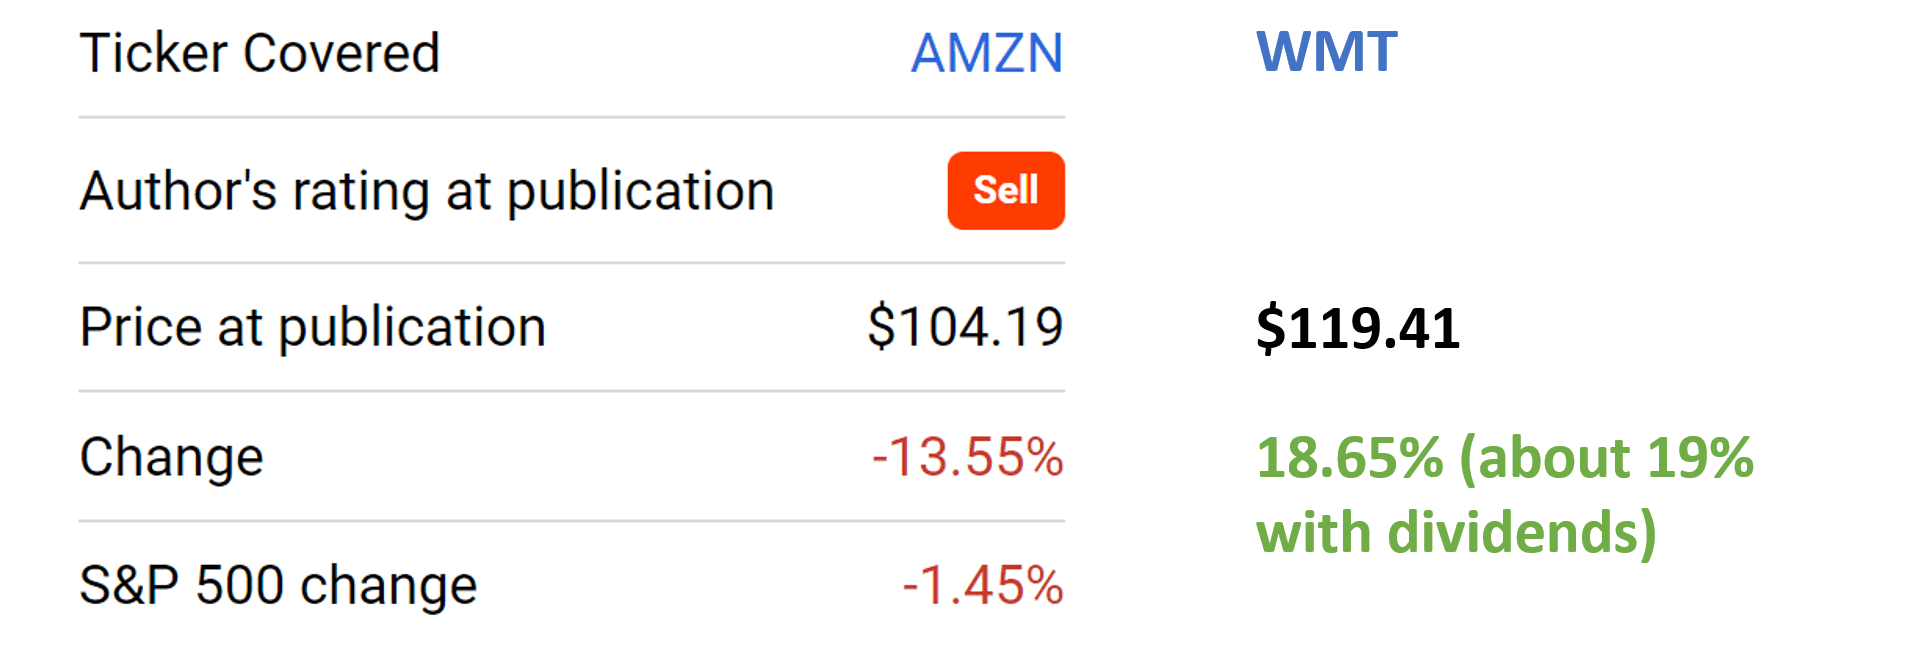
Back in June 2002 (June 13 to be exact), I co-produced an article with Envision Research on Amazon (NASDAQ:AMZN) and Walmart (NYSE:WMT). The article involved a pair-trade idea to sell AMZN and buy WMT. The gist of the thesis was:
- WMT’s sales composition makes it more resistant to surging inflation and fuel cost at that time than AMZN. Since then, there have been some changes in macroeconomic conditions such as inflation and fuel cost.
- I foresaw AMZN’s already negative FCF (free cash flow) becoming worse due to the inflation and fuel cost problems mentioned above. Combined with AMZN’s stock prices back then, I saw too large a valuation risk in AMZN, while WMT was very reasonably priced at that time.
In this article, I wanted to revisit this idea given a few key developments in the past 6 months or so. First, there had some large price movements in both stock prices to even out the valuation risks. As seen in the chart below, since our last article, AMZN has suffered a price correction of 13.5%, in contrast to a price gain of 18.65% for Walmart. Considering that WMT investors have also received a $0.56 quarterly dividend since then, WMT’s total return is about 19%, leading AMZN by more than 32%. Such price movements have canceled out some of the valuation risks in AMZN as to be elaborated on later.
Source: Author based on Seeking Alpha data
Secondly, there had been some changes in the macroeconomic conditions such as inflation and fuel cost also since then. And their Q2 and Q3 results since then have provided new catalysts (both upside and downside catalysts) into sight. To wit, Amazon reported its Q3 earnings report (“ER”) on Oct 27. Its GAAP EPS came in at $0.28, beating consensus estimates by $0.07. Its revenues came in at $127.1B, missing consensus estimates by $370M. As to be detailed later, I foresee the tech giant to keep feeling inflationary pressure, rising fuel costs, and currency headwinds in the next few quarters.
On the other hand, WMT is expected to report its CY Q3 earnings on 11/15/2022. The consensus estimate for its Q3 EPS is $1.31. Compared to the EPS for the same quarter last year ($1.45 per share), such a forecast represents a 10% YOY decline. In its Q2 ER, leadership provided sales guidance to rise around 5% in the third quarter. Although WMT is also expected to suffer negative impacts from currency fluctuations, estimated to be about $1.3 billion.
Looking further out, I see WMT is better positioned to weather the uncertainties ahead. I see its vast network of physical stores, viewed as a liability compared to AMZN by many analysts, to be a valuable and irreplaceable advantage. It has been working closely with carriers to ensure appropriate inventory levels, integrate more automation across the supply chain, and utilize drones and autonomous electric vehicles for delivery. And its store can serve as fulfillment centers and launch pads for all of these initiatives. In contrast, pressured by the slowing down retail expansion, Amazon has to rely more on its AWS to fuel growth. But its AWS will continue to require continuous heavy capital investment for years while its FCF problems keep deteriorating, as to be elaborated later.
All told, you will see that I still like Walmart better than Amazon. And the remainder of this article will detail my updated thoughts on the above issues. But I do feel more positive about AMZN now given that its valuation risk is a lot lower now than 6 months ago.
Fuel cost and inflation pressure updated
Before I go any further, let me clarify that I am fully aware that AMZN and WMT are not identical. Their key differences were detailed in my last article. But they compete in the same retail space, which currently contributes the majority of sales for both of them and makes them comparable. More specifically, as detailed in my earlier article,
AMZN derives most of its revenue from Online Stores (more than 47%) – which makes it very comparable to WMT. Behind online stores are a vast network of warehouses, suppliers, distribution centers, et al, just like WMT.
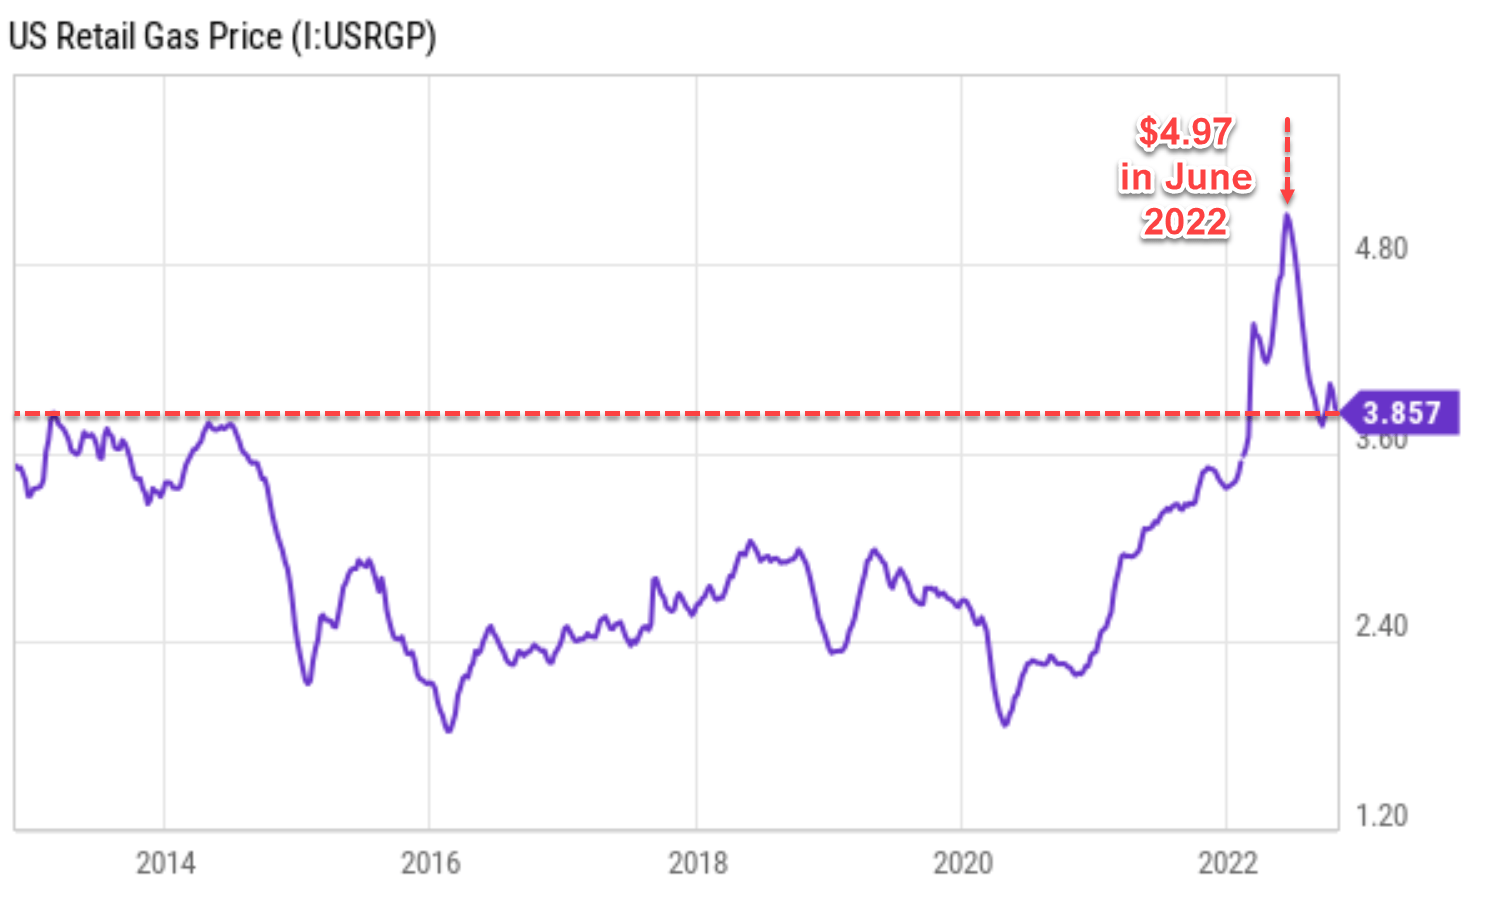
Given such a large overlap, one of the two pillars of my pair trade idea was quite straightforward. I see A) both to be hurt by the surging inflation, particularly record fuel costs, but B) the pain will be uneven with WMT suffering a lot less than AMZN. As seen in the chart below, when I wrote the original thesis, the national average retail gas price happened to be at a peaked level. It was close to $5 per gallon ($4.97 to be exact), which was the highest level ever and also a key reason why the thesis worked out so beautifully.
Source: Author based on Seeking Alpha data
The key idea was the AMZN will be hurt more by inflation and rising fuel cost than WMT for a few key reasons as argued in my last article:
Firstly, WMT’s sales composition makes it more inflation resistant than AMZN. In 2022, WMT is still largely a grocery store (and by far the largest one). Its grocery sales accounted for 55.7 percent of its net sales in the U.S. In contrast, AMZN’s mostly carried discretionary items.
Second, WMT’s transport cost is less sensitive to high fuel prices due to the geographical groupings of its stores. A Reuters report analyzed these advantages by comparison against Target but these arguments are valid when compared to Amazon also.
Third, WMT itself is one of the largest gasoline distributors in the country and can benefit from rising gasoline prices. It is a lucrative business segment at peak fuel prices that AMZN does not have.
And finally, gasoline distribution also creates a higher-order benefit that AMZN dost not have. Higher gas prices better funnel consumers to WMT than AMZN. Higher gas prices lure more people to WMT chains to fill up their tanks, given the lower prices thanks to their humongous scale. After filling up thank, naturally, these people are more likely to shop in the stores or even become members of the stores.
Fast forward to now, the average gas price has fallen from the $5 peak to the current level of $3.85, a decline of about 22%. However, as you can see from the chart above, the current gas price is still close to a 10-year peak level. And as a result, I expect the above effects to be weaker than they used to be six months ago, but only relatively. I still expect these factors to persist and help WMT more than AMZN (or hurt AMZN more than WMT) – depending on which angle you chose to see things.
And finally, retail gas prices could likely surge again in the near future given the ongoing wild cards afoot. The Russia-Ukraine war is still ongoing and also the energy demand in Europe would surely surge in the coming winter in my view.
AMZN’s cash problem keeps deteriorating
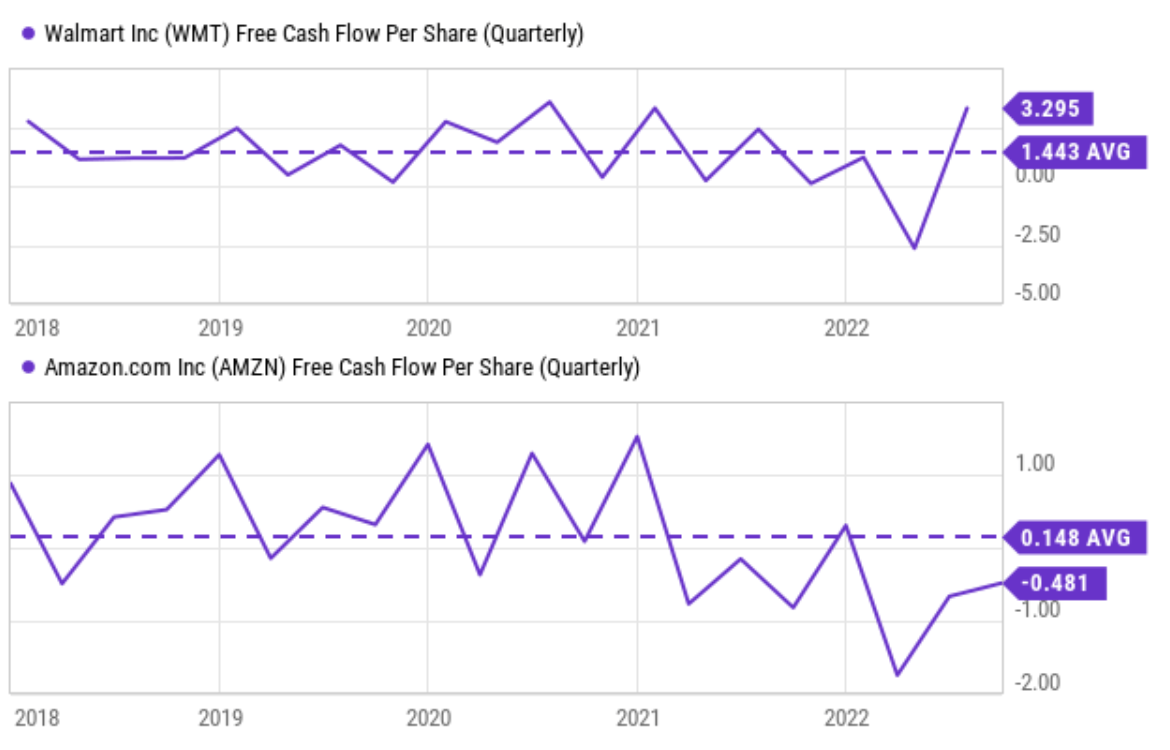
As aforementioned, AMZN will have to depend more on its AWS to fuel growth in the future given the pressure on its retail expansion. But its AWS will continue to require continued CAPEX investments heavily for years while its FCF problems keep deteriorating as shown in the chart below. To be clear, I see both WMT and AMZN feeling FCF pressure. WMT is not immune in any way. It is just I see the issue as more severe for AMZN.
To wit, WMT’s FCF per share has been hovering around $1.44 in the past few years. You can see the pressure in 2022 due to inflation and its CAPEX requirements. Its FCF dipped into the red for the first time in 5 years. But then it recovered in the next quarter to a remarkable $3.29 per share. In comparison, AMZN’s FCF showed a similar pattern. It also nosedived in the 1H of 2022. But AMZN’s FCF issues are much worse quantitatively. Its FCF declined from a positive level at the end of 2021 and remained negative since then. Currently, it’s bleeding $0.481 per share of FCF as of the last quarter. Even the small positive seen in Q4 2021 is not so when its lease obligations are considered, as detailed next.
Source: Seeking Alpha data
Details of the lease obligations are provided in my earlier analysis. And as you can see from the following chart, after its lease obligations are considered, its FCF problem is even more alarming. It reported a healthy FCF of $16.8B back in Q1 2021, and then its FCF turned to almost zero in Q2. Starting in Q3 2021, its FCF turned negative and kept retreating from there on. As seen, it was -$8.8B in 2021 Q3 and reached a negative $28.4B in 2022 Q3. A negative FCF on this order is a serious issue even for a giant like AMZN. The ongoing inflation and high fuel cost will create further pressure on its FCF. And as detailed in my original thesis:
The business will face some tough capital allocation choices going forward. It could scale back on its infrastructure investments, issue more equity when stock prices are low, and/or issue more debt when borrowing rates are climbing. None of these options seem attractive.
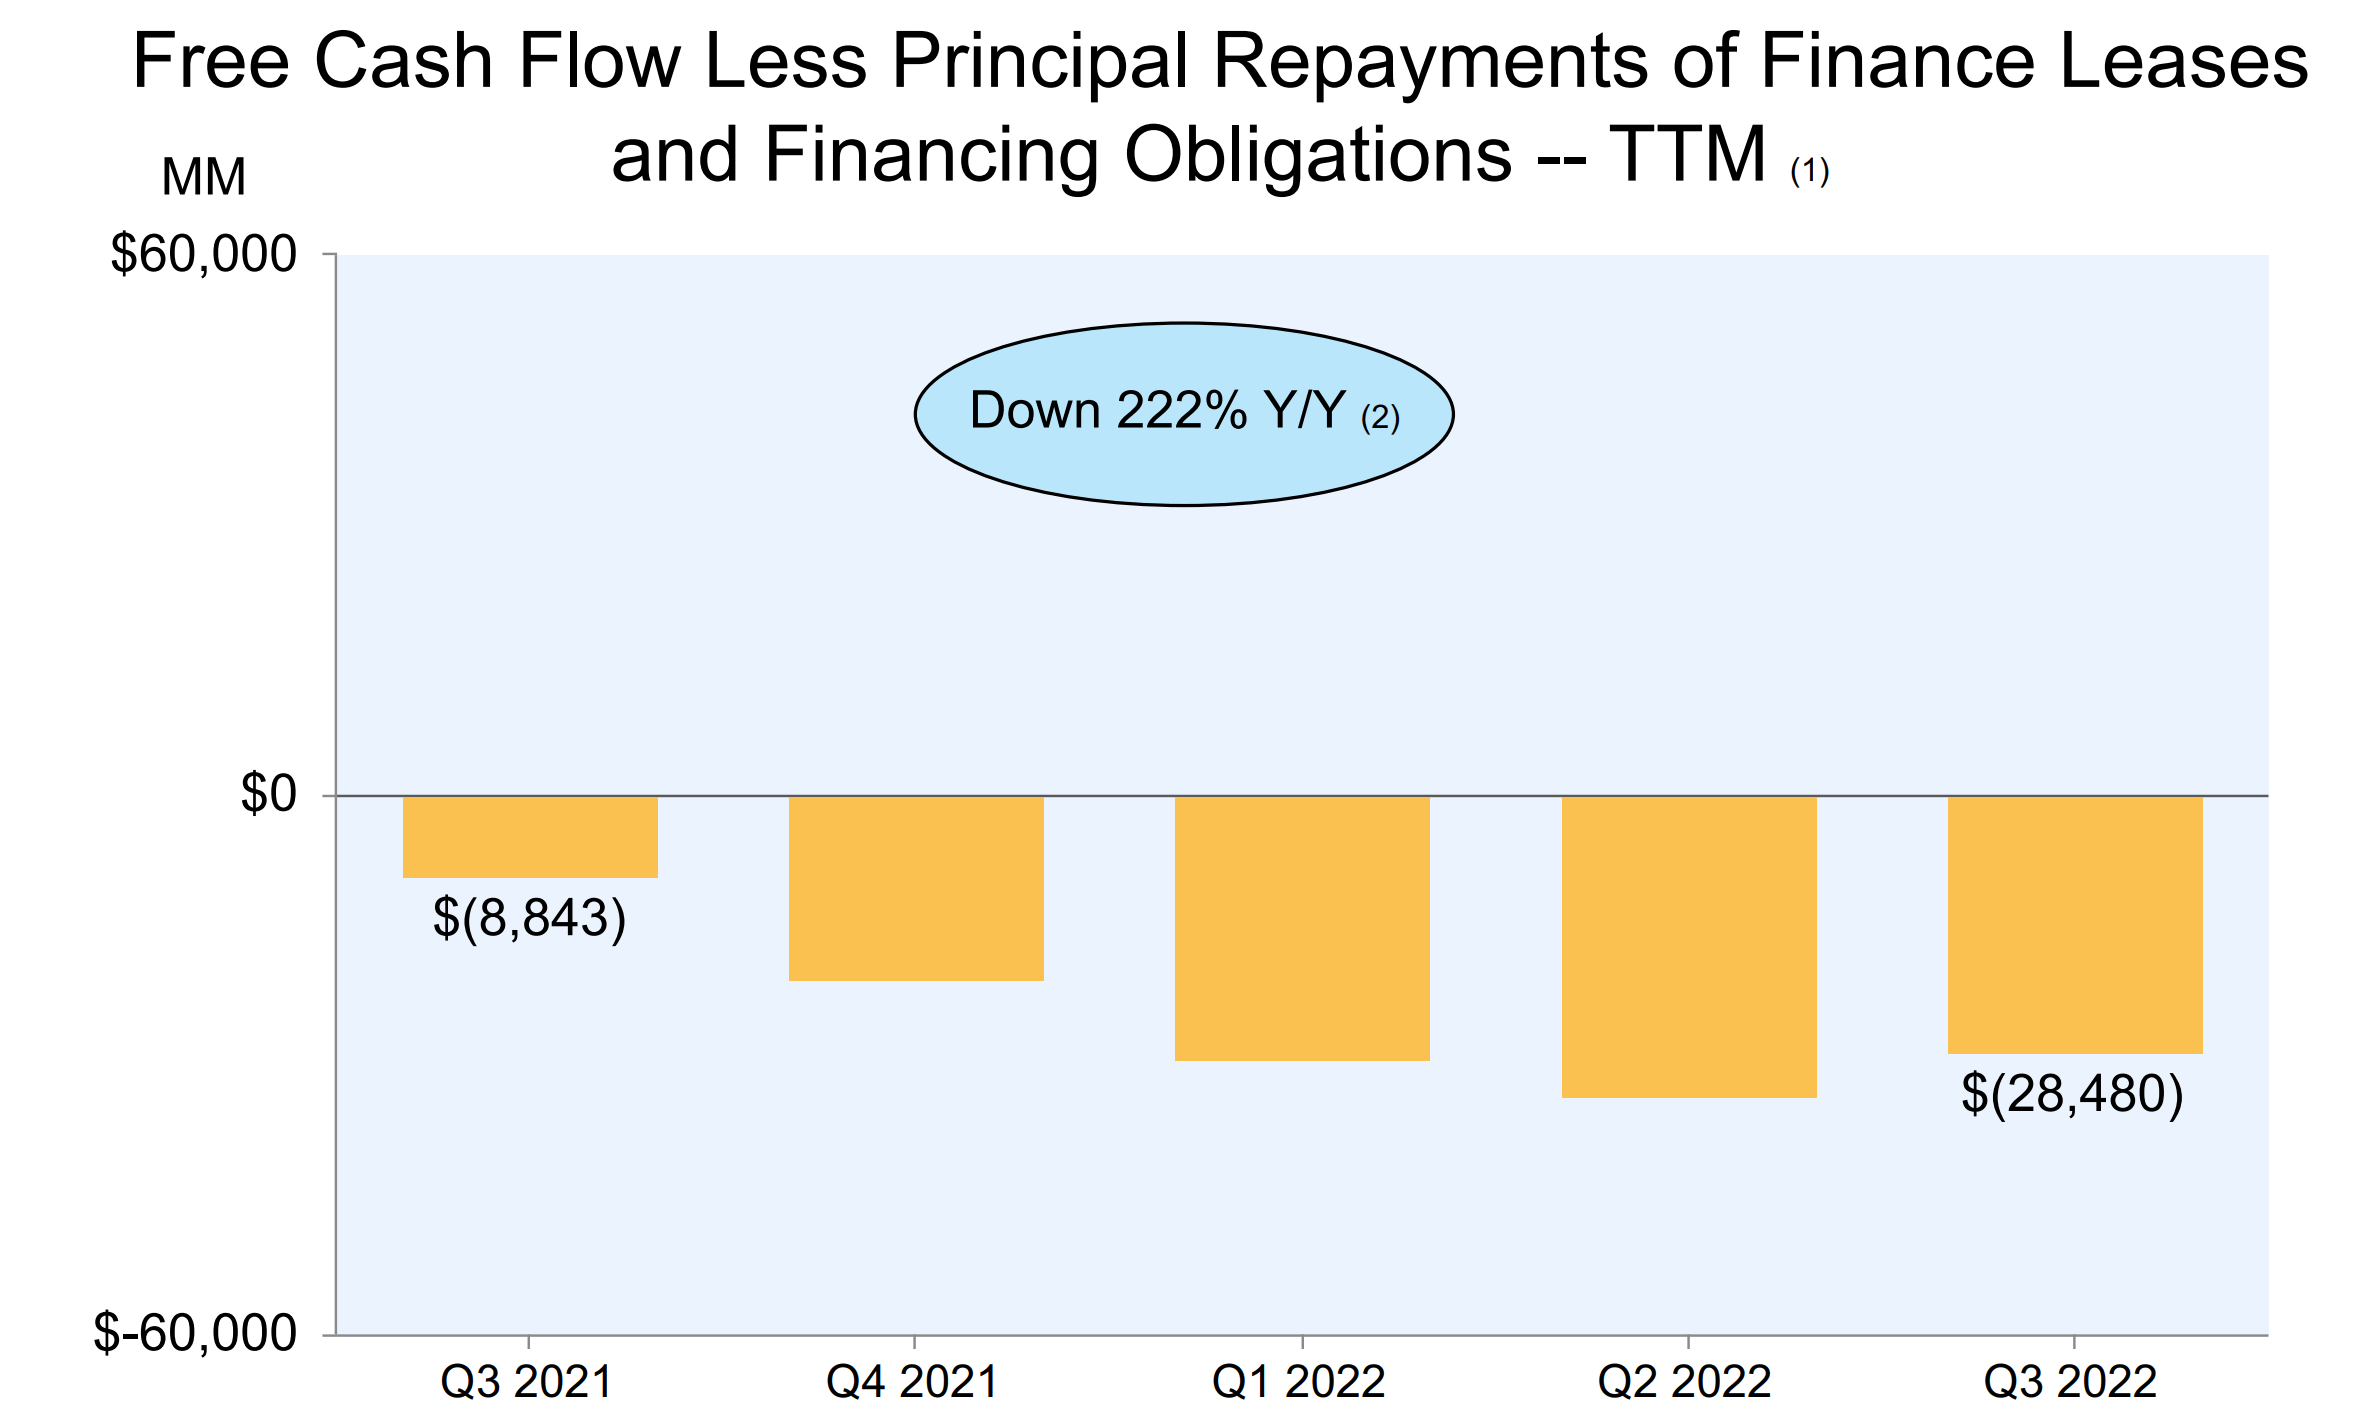
Source: AMZN Q3 ER
WMT vs AMZN: Valuation risks are more evened out now
As aforementioned, the large price movements since my original publication have evened out the valuation risks between WMT and AMZN. Due to the negative FCF mentioned above, profit-oriented metrics are not applicable for AMZN. As seen from the following table, its FY1 GAAP PE is NM and FY2 PE is 50.6x. In contrast, these metrics are perfectly applicable in the case of WMT. And they show a reasonable valuation, but much higher than at the time of my original writing due to the large price appreciation since then. To wit, WMT is priced at about 24.1x FW PE (vs. 19x FW PE at my original publication).
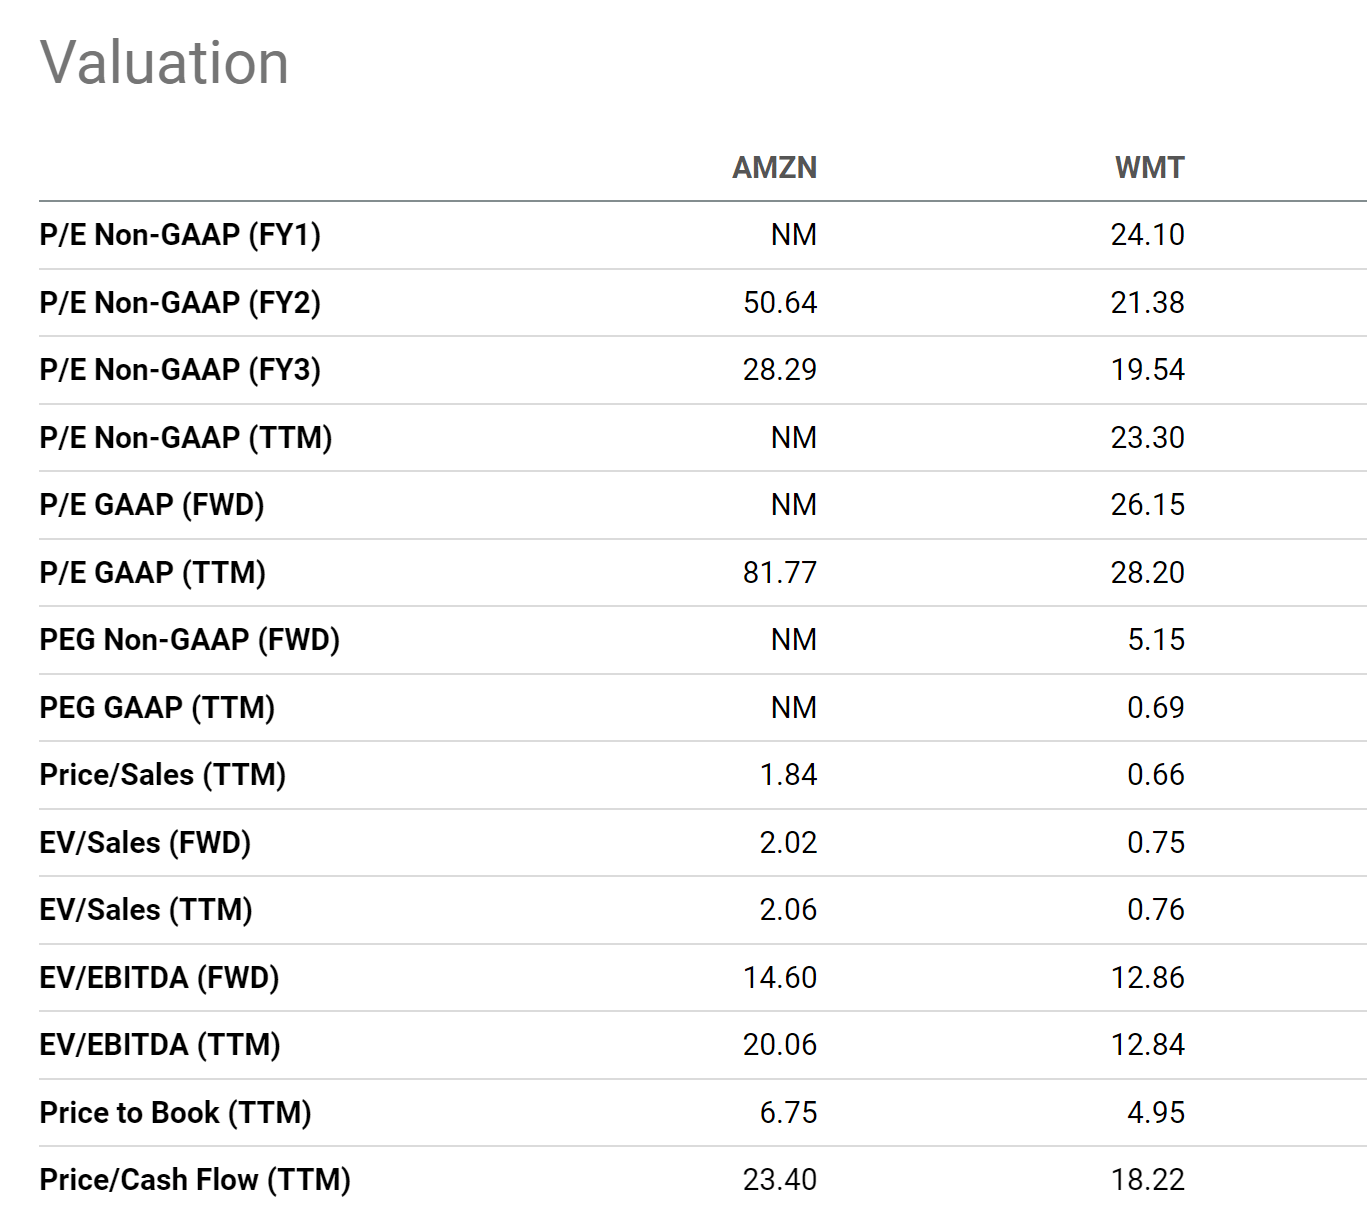
Source: Seeking Alpha data
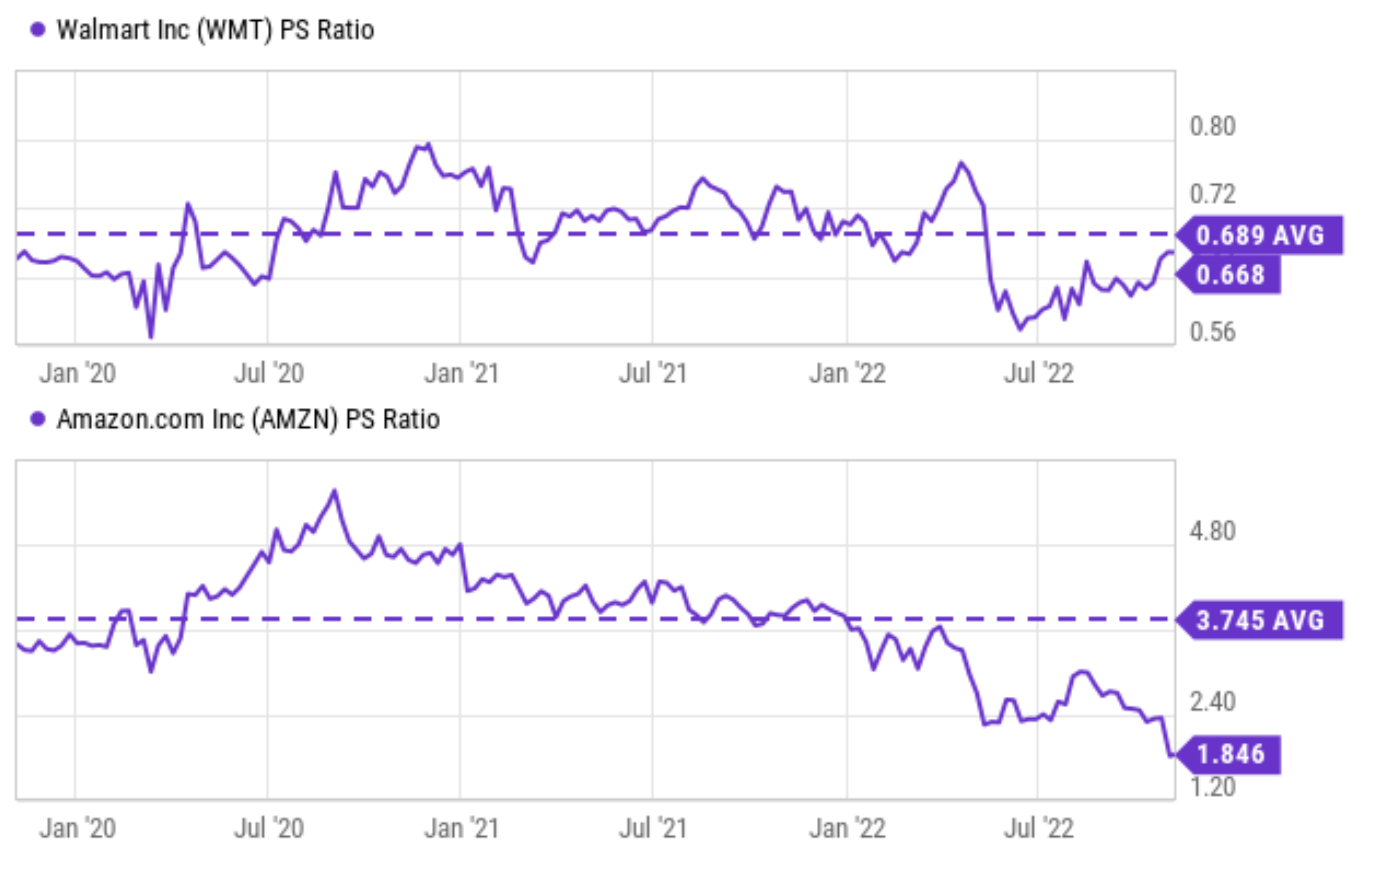
To further gauge their relative valuation premiums, let’s take a look at topline-oriented metrics since bottom-line-oriented metrics do not apply to AMZN meaningfully. As shown in the next chart, WMT and AMZN are trading currently at PS ratios of 0.66x and 1.85x, respectively. So, despite the recent divergence in their price movements, AMZN’s PS ratio is still about 3x higher than WMT’s.
Of course, the PS ratio needs to be considered together with the profit margins, as shown in the next chart. As you see, AMZN’s profit margin is 2.26% currently. And you can again see the negative impact it has suffered from the headwinds mentioned above so far this year. WMT’s profit margin currently hovers around 3.3%, actually higher than AMZN.
So, all told, I am still seeing a large valuation premium in AMZN that is difficult to justify given the current issues.
Source: Seeking Alpha data

Source: Seeking Alpha data
Risks and final thoughts
To reiterate, most of the risks mentioned above will impact both WMT and AMZN. My argument is NOT that WMT will be immune to some of these risks. My argument is that WMT is better positioned to navigate these risks in the near term than AMZN. And this brings me to the second risk of my thesis here: timeframe.
My above analyses are more oriented towards the near term, say next 1 or 2 years. In the long run beyond that, AMZN is an excellent business supported by an unstoppable secular trend in my mind. And finally, there are downside risks for WMT too. Even though WMT is a scale leader in the retail space, faces more competition from other brick-and-mortar stores both at home (such as KR and COST) and abroad (such as Lidl and Aldi). And even though it has been evolving and adapting, its competitors are largely evolving and adapting in the same way to keep a strategic equilibrium (for example, with personalized omnichannel experience and also automated delivery systems).
To conclude, this article revisits a pair trade idea between WMT and AMZN I originally published about half a year ago. The update was motivated by a few considerations. First, their price movements have gone in the direction as expected. Amazon suffered a large price decline of 13% and Walmart gained more than 19%. Such price movements have evened out the valuation risks considerably. Secondly, the average fuel cost has fallen from the $5 peak back then to the current level of $3.85. As a result, I expect the impacts of these factors to be less dramatic than they used to be back in June. Although I still expect these factors to persist and help WMT more than AMZN (or hurt AMZN more than WMT).
All told, I am still bullish on WMT now although I am less bearish on AMZN now given its reduced valuation risks combined with the lessened impacts from high fuel cost. As such, I am updating my rating on AMZN to hold.
Be the first to comment