

Viktor_Gladkov/iStock via Getty Images
The surge in interest rates this year, triggered by the highest inflation and most hawkish Fed in 40 years, has been a wonder to behold.
Daily Shot 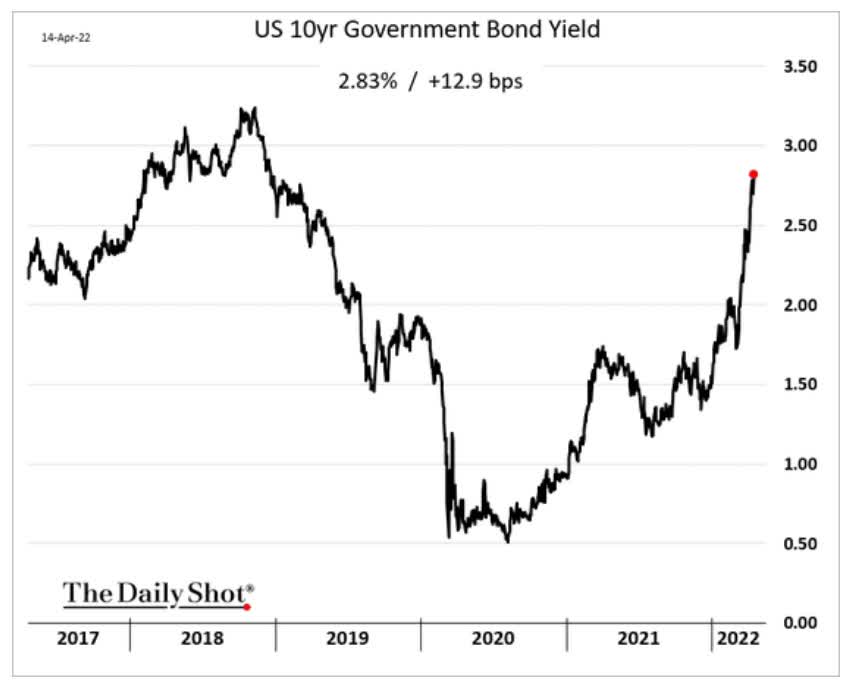
And not surprisingly, the speed and severity of this move in rates has caused a sharp selloff in many of today’s most popular growth stocks.
Daily Shot 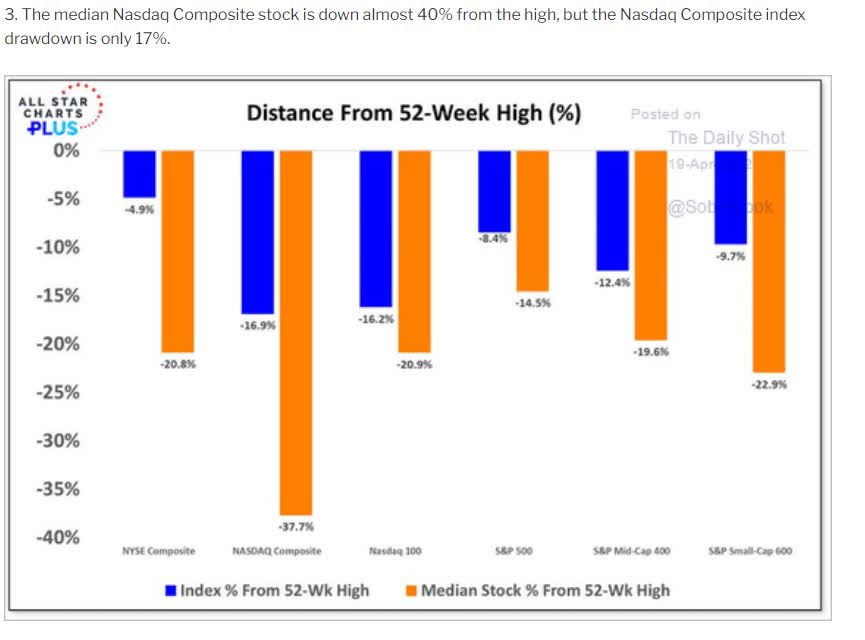
In fact, the median Nasdaq stock, which includes 3,700 companies, is down almost 40% off its high.
Ycharts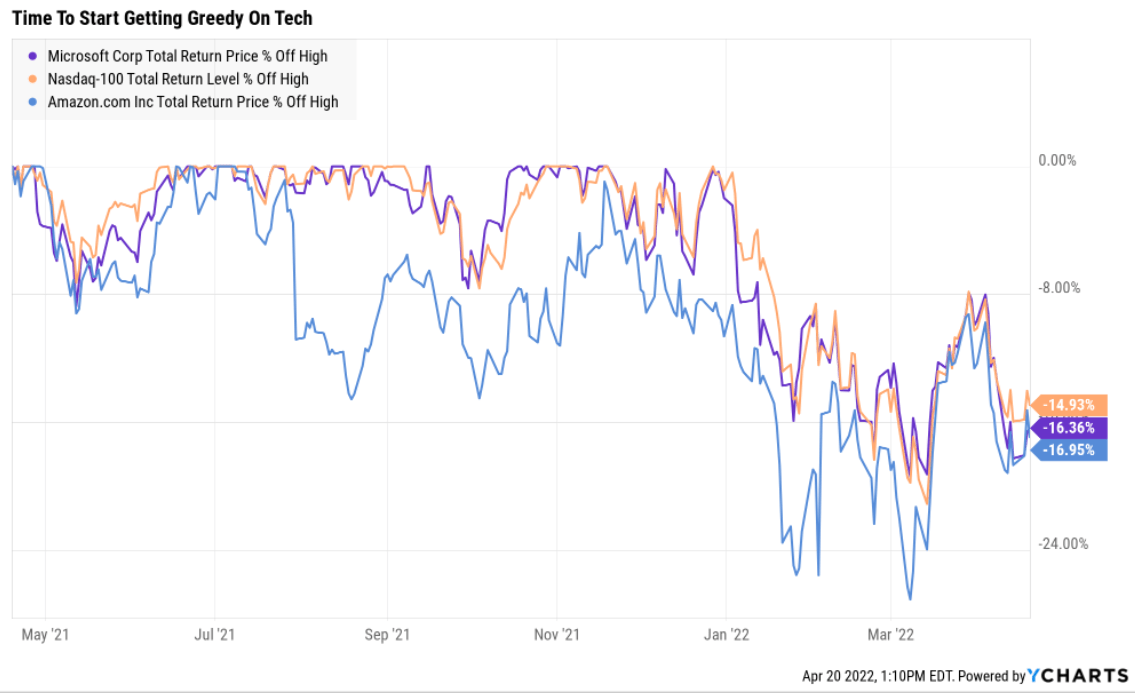
Today, Amazon (NASDAQ:AMZN), Microsoft (NASDAQ:MSFT) and the Nasdaq (QQQ) are all down about 15% off recent highs.
These three all represent great ways to own the highest quality tech names, and compound your wealth over time.
Historical Rolling Returns Since 1999
(Source: Portfolio Visualizer Premium)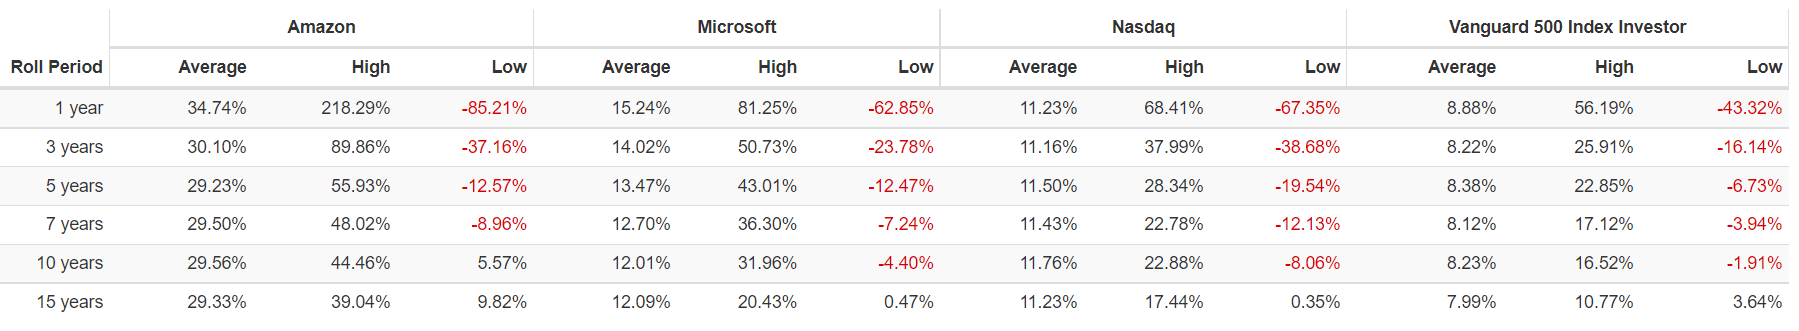
But while such impressive historical returns are nice, you can’t buy past returns.
So let me compare and contrast Amazon and Microsoft, two of the world’s premier tech giants, to show you
- why nearly every investor should own these legendary growth blue-chips
- which is the highest quality company
- which is the better and safer buy for your hard-earned money today
Quality And Safety: Winner Microsoft (But Not By Much)
There are many ways to define and measure quality. So how do I do it?
The Dividend King’s overall quality scores are based on a 248-point model that includes:
-
dividend safety
-
balance sheet strength
-
credit ratings
-
credit default swap medium-term bankruptcy risk data
-
short and long-term bankruptcy risk
-
accounting and corporate fraud risk
-
profitability and business model
-
growth consensus estimates
-
management growth guidance
-
historical earnings growth rates
-
historical cash flow growth rates
-
historical dividend growth rates
-
historical sales growth rates
-
cost of capital
-
GF Scores
-
long-term risk-management scores from MSCI, Morningstar, FactSet, S&P, Reuters’/Refinitiv, and Just Capital
-
management quality
-
dividend friendly corporate culture/income dependability
-
long-term total returns (a Ben Graham sign of quality)
-
analyst consensus long-term return potential
In fact, it includes over 1,000 fundamental metrics including the 12 rating agencies we use to assess fundamental risk.
- credit and risk management ratings make up 41% of the DK safety and quality model
- dividend/balance sheet/risk ratings make up 82% of the DK safety and quality model
How do we know that our safety and quality model works well?
During the two worst recessions in 75 years, our safety model 87% of blue-chip dividend cuts, the ultimate baptism by fire for any dividend safety model.
And then there’s the confirmation that our quality ratings are accurate.
DK Zen Phoenix: Superior Fundamentals Lead To Superior Long-Term Results
| Metric | US Stocks | 191 Real Money DK Phoenix Recs |
| Great Recession Dividend Growth | -25% | 0% |
| Pandemic Dividend Growth | -1% | 6% |
| Positive Total Returns Over The Last 10 Years | 42% | 99.5% (Greatest Investors In History 60% to 80% Over Time) |
| Lost Money/Went Bankrupt Over The Last 10 Years | 47% | 0.5% |
| Outperformed Market Over The Last Decade (290%) | 36% | 46% |
| Bankruptcies Over The Last 10 Years | 11% | 0% |
| Permanent 70+% Catastrophic Decline Since 1980 | 44% | 0.5% |
| 100+% Total Return Over The Past 10 Years | NA | 87% |
| 200+% Total Return Over The Past 10 Years | NA | 66% |
| 300+% Total Return Over The Past 10 Years | NA | 44% |
| 400+% Total Return Over The Past 10 Years | NA | 35% |
| 500+% Total Return Over The Past 10 Years | NA | 27% |
| 600+% Total Return Over The Past 10 Years | NA | 23% |
| 700+% Total Return Over The Past 10 Years | NA | 20% |
| 800+% Total Return Over The Past 10 Years | NA | 18% |
| 900+% Total Return Over The Past 10 Years | NA | 18% |
| 1000+% Total Return Over The Past 10 Years | NA | 16% |
| Sources: Morningstar, JPMorgan, Seeking Alpha |
Basically, historical market data confirms that the DK safety and quality model is comprehensive and accurate.
This is why I and my family entrust almost 100% of my life savings to this model and the DK Phoenix blue-chip strategy.
How do Microsoft and Amazon score on our safety and quality model?
Microsoft Dividend Safety
| Rating | Dividend Kings Safety Score (161 Point Safety Model) | Approximate Dividend Cut Risk (Average Recession) |
Approximate Dividend Cut Risk In Pandemic Level Recession |
| 1 – unsafe | 0% to 20% | over 4% | 16+% |
| 2- below average | 21% to 40% | over 2% | 8% to 16% |
| 3 – average | 41% to 60% | 2% | 4% to 8% |
| 4 – safe | 61% to 80% | 1% | 2% to 4% |
| 5- very safe | 81% to 100% | 0.5% | 1% to 2% |
| MSFT | 100% | 0.50% | 1.0% |
| Risk Rating | Low-Risk (92nd industry percentile consensus) | AAA stable credit rating 0.07% 30-year bankruptcy risk | 20% OR LESS Max Risk Cap Recommendation |
Long-Term Dependability
| Company | DK Long-Term Dependability Score | Interpretation | Points |
| Non-Dependable Companies | 21% or below | Poor Dependability | 1 |
| Low Dependability Companies | 22% to 60% | Below-Average Dependability | 2 |
| S&P 500/Industry Average | 61% (58% to 70% range) | Average Dependability | 3 |
| Above-Average | 71% to 80% | Very Dependable | 4 |
| Very Good | 81% or higher | Exceptional Dependability | 5 |
| MSFT | 99% | Exceptional Dependability | 5 |
Overall Quality
| MSFT | Final Score | Rating |
| Safety | 100% | 5/5 very safe |
| Business Model | 100% | 3/3 wide moat |
| Dependability | 99% | 5/5 exceptional |
| Total | 99% | 13/13 Ultra SWAN |
| Risk Rating | 3/3 Low Risk | |
| 20% OR LESS Max Risk Cap Rec |
5% Margin of Safety For A Potentially Good Buy |
Microsoft is as close to a perfect growth blue-chips as exists on Wall Street.
And so is Amazon.
AMZN Balance Sheet Safety
| Rating | Dividend Kings Safety Score (161 Point Safety Model) | Approximate Dividend Cut Risk (Average Recession) |
Approximate Dividend Cut Risk In Pandemic Level Recession |
| 1 – unsafe | 0% to 20% | over 4% | 16+% |
| 2- below average | 21% to 40% | over 2% | 8% to 16% |
| 3 – average | 41% to 60% | 2% | 4% to 8% |
| 4 – safe | 61% to 80% | 1% | 2% to 4% |
| 5- very safe | 81% to 100% | 0.5% | 1% to 2% |
| AMZN | 100% | NA | NA |
| Risk Rating | Medium-Risk (53rd industry percentile risk-management consensus) | AA Stable outlook credit rating 0.51% 30-year bankruptcy risk | 20% OR LESS Max Risk Cap Recommendation |
Long-Term Dependability
| Company | DK Long-Term Dependability Score | Interpretation | Points |
| Non-Dependable Companies | 21% or below | Poor Dependability | 1 |
| Low Dependability Companies | 22% to 60% | Below-Average Dependability | 2 |
| S&P 500/Industry Average | 61% (61% to 70% range) | Average Dependability | 3 |
| Above-Average | 71% to 80% | Very Dependable | 4 |
| Very Good | 81% or higher | Exceptional Dependability | 5 |
| AMZN | 84% | Exceptional Dependability | 5 |
Overall Quality
| AMZN | Final Score | Rating |
| Safety | 100% | 5/5 Very Safe |
| Business Model | 90% | 3/3 Wide Moat – Stable |
| Dependability | 84% | 5/5 Exceptional |
| Total | 93% | 13/13 Ultra SWAN |
| Risk Rating |
2/3 medium Risk |
|
| 20% OR LESS Max Risk Cap Rec – speculative |
5% Margin of Safety For A Potentially Good Buy |
However, in this head-to-head comparison, Microsoft edges out Amazon slightly.
MSFT: 3rd Highest Quality Master List Company (Out of 506) = 99th Percentile
AMZN: 31st Highest Quality Master List Company (Out of 506) = 94th Percentile
Why is Microsoft a higher quality company than Amazon?
Let’s start with the balance sheet.
AMZN Credit Ratings
| Rating Agency | Credit Rating | 30-Year Default/Bankruptcy Risk | Chance of Losing 100% Of Your Investment 1 In |
| S&P | AA Stable | 0.51% | 196.1 |
| Fitch | AA- Stable | 0.55% | 181.8 |
| Moody’s | A1 (A+ equivalent) Stable | 0.60% | 166.7 |
| Consensus | AA- Stable | 0.55% | 180.7 |
(Source: S&P, Moody’s, Fitch)
Rating agencies estimate a 0.55% fundamental risk in buying Amazon today.
- 1 in 181 chance of losing all your money over the next 30 years
Amazon’s balance sheet is a fortress.
AMZN Leverage Consensus Forecast
| Year | Debt/EBITDA | Net Debt/EBITDA (3.0 Or Less Safe According To Credit Rating Agencies) |
Interest Coverage (8+ Safe) |
| 2020 | 0.56 | -0.09 | 13.90 |
| 2021 | 0.68 | -0.28 | 13.75 |
| 2022 | 0.60 | -0.28 | 14.96 |
| 2023 | 0.45 | -0.47 | 21.44 |
| 2024 | 0.32 | -0.64 | 34.48 |
| 2025 | 0.29 | -0.99 | 48.37 |
| 2026 | 0.24 | -1.66 | 61.11 |
| 2027 | 0.20 | -1.83 | 74.33 |
| Annualized Change | -13.62% | 54.14% | 27.06% |
(Source: FactSet Research Terminal)
Amazon has more cash than debt already and its balance sheet is expected to get rapidly stronger over time.
AMZN Balance Sheet Consensus Forecast
| Year | Total Debt (Millions) | Cash | Net Debt (Millions) | Interest Cost (Millions) | EBITDA (Millions) | Operating Income (Millions) |
| 2020 | $31,816 | $42,122 | -$5,079 | $1,647 | $57,284 | $22,899 |
| 2021 | $48,744 | $36,220 | -$20,346 | $1,809 | $71,994 | $24,879 |
| 2022 | $48,663 | $74,694 | -$22,258 | $2,063 | $80,760 | $30,865 |
| 2023 | $47,163 | $113,701 | -$49,136 | $2,188 | $104,819 | $46,921 |
| 2024 | $42,366 | $167,534 | -$85,508 | $2,041 | $133,792 | $70,372 |
| 2025 | $47,900 | $321,148 | -$164,569 | $1,936 | $165,979 | $93,647 |
| 2026 | $47,900 | $465,285 | -$335,981 | $1,982 | $202,841 | $121,127 |
| 2027 | $47,483 | $566,899 | -$436,861 | $2,032 | $238,295 | $151,031 |
| Annualized Growth | 5.89% | 44.97% | 88.96% | 3.05% | 22.59% | 30.93% |
(Source: FactSet Research Terminal)
- cash position growing at 45% CAGR
- net cash growing at 89% CAGR
- cash flows growing at 23% to 31% CAGR
- by 2027 an estimated $436 billion in net cash
- $567 billion in total cash
- Apple began the largest capital return in history at $250 billion in cash
But Microsoft’s balance sheet is even more impressive.
Microsoft: Possibly The Safest Company In America
| Rating Agency | Credit Rating | 30-Year Default/Bankruptcy Risk | Chance of Losing 100% Of Your Investment 1 In |
| S&P | AAA Stable | 0.07% | 1428.6 |
| Fitch | AAA Stable | 0.07% | 1428.6 |
| Moody’s | Aaa (AAA equivalent) Stable | 0.07% | 1428.6 |
| Consensus | AAA Stable | 0.07% | 1428.6 |
(Source: S&P, Moody’s, Fitch)
MSFT is the only company in America with AAA credit ratings from all three rating agencies (JNJ has AAA ratings from two).
This means that S&P and Fitch consider MSFT at lower risk of defaulting on its debt than the US Treasury.
- S&P rates the US AA+ stable
- Fitch rates the US AAA with a negative outlook (33% chance of a downgrade)
Why do the rating agencies consider MSFT to be essentially “risk-free”?
MSFT Leverage Consensus Forecast
| Year | Debt/EBITDA | Net Debt/EBITDA (3.0 Or Less Safe According To Credit Rating Agencies) |
Interest Coverage (8+ Safe) |
| 2020 | 0.96 | -1.11 | 25.28 |
| 2021 | 0.71 | -0.88 | NA |
| 2022 | 0.53 | -0.70 | 79.74 |
| 2023 | 0.45 | -0.69 | 90.96 |
| 2024 | 0.37 | -1.23 | 108.96 |
| Annualized Change | -21.20% | 2.45% | 44.09% |
(Source: FactSet Research Terminal)
Microsoft has had more cash than debt for well over a decade, and its financial strength is expected to keep improving steadily.
MSFT Balance Sheet Consensus Forecast
| Year | Total Debt (Millions) | Cash | Net Debt (Millions) | Interest Cost (Millions) | EBITDA (Millions) | Operating Income (Millions) |
| 2020 | $63,327 | $13,576 | -$73,200 | $2,095 | $65,755 | $52,959 |
| 2021 | $58,146 | $14,224 | -$72,188 | NA | $81,602 | $69,916 |
| 2022 | $52,522 | $40,008 | -$69,237 | $1,053 | $99,454 | $83,961 |
| 2023 | $51,431 | $88,238 | -$78,980 | $1,055 | $114,791 | $95,965 |
| 2024 | $48,838 | $124,229 | -$161,300 | $1,027 | $131,511 | $111,903 |
| Annualized Growth | -6.29% | 73.93% | 21.84% | -16.32% | 18.92% | 20.57% |
(Source: FactSet Research Terminal)
MSFT is expected to have $124 billion in cash by 2024, and including its receivables (it’s a recurring monthly revenue business) a net cash position of $161 billion.
Impressively, its cash flows are expected to be growing at close to 20%, despite its massive size.
- 2024 EBITDA of $132 billion would be the 58th largest country on earth if it were its own economy
- larger than Kuwait’s GDP
What about other measures of quality?
Ben Graham considered a 20+ year dividend growth streak to be a sign of excellent quality.
Justin Law If a company has grown its dividends for 20+ years, there is very little risk that it will cut its dividend or even fail to keep raising it in all economic and industry conditions.
Microsoft began paying a quarterly dividend in 2003 and has been raising it without fail ever since.
- 18-year dividend growth streak (excluding special dividends)
That means MSFT will achieve the Graham standard of excellence in 2024 and become a dividend aristocrat in 2029.
Amazon doesn’t pay a dividend…yet, but is likely to in the future.
- $567 billion in cash by 2027
- after investing $700 billion in growth over the next five years and
- $180 billion in annual cash flow adding to the cash pile growing at 20% in 2027 according to analysts
If Amazon grows as analysts expect, a dividend is a mathematical certainty at some point.
- no dividend is expected until 2028 at the earliest
And what about Wall Street’s favorite quality metric, profitability?
Profitability: Wall Street’s Favorite Quality Proxy
Amazon’s Profitability Is Sensational
AMZN’s profitability is historically within the top 10% of peers.
AMZN Trailing 12-Month Profitability Vs. Peers
| Metric | Industry Percentile | Major Cyclical Retailers More Profitable Than AMZN (Out Of 1,099) |
| Operating Margin | 57.30 | 469 |
| Net Margin | 74.77 | 277 |
| Return On Equity | 87.52 | 137 |
| Return On Assets | 81.98 | 198 |
| Return On Capital | 65.17 | NA |
| Average | 73.35 | 293 |
(Source: Gurufocus Premium)
AMZN’s operating margins have taken a hit as it ramps up its growth spending, plus faces rising input costs on things like shipping.
- thus the 5% fuel and delivery surcharge it’s applying to 3rd party sellers
Over the last 20 years, AMZN’s industry-leading profitability has been stable or improving, confirming a wide and stable moat.
AMZN Margin Consensus Forecast
| Year | FCF Margin | EBITDA Margin | EBIT (Operating) Margin | Net Margin | Return On Capital Expansion |
Return On Capital Forecast |
| 2020 | 8.0% | 14.8% | 5.9% | 5.5% | 2.80 | |
| 2021 | -1.9% | 15.3% | 5.3% | 7.1% | TTM ROC | 22.10% |
| 2022 | 5.6% | 14.9% | 5.7% | 4.7% | Latest ROC | 29.67% |
| 2023 | 7.8% | 16.5% | 7.4% | 6.2% | 2027 ROC | 61.91% |
| 2024 | 9.5% | 18.3% | 9.6% | 8.0% | 2027 ROC | 83.12% |
| 2025 | 10.3% | 20.2% | 11.4% | 9.3% | Average | 72.52% |
| 2026 | 16.6% | 22.2% | 13.3% | 11.2% | Industry Median | 12.00% |
| 2027 | 18.1% | 23.4% | 14.8% | 12.5% | AMZN/Industry Median | 6.04 |
| Annualized Growth | 12.31% | 6.73% | 13.99% | 12.39% | Vs S&P | 4.97 |
| Annualized Growth (Ignoring Pandemic) | NA | 7.32% | 18.73% | 9.90% |
(Source: FactSet Research Terminal)
AMZN’s free cash flow margins are expected to triple over the next four years, to 18%. All of its margins are expected to grow at rates that many growth stocks would love to grow their sales at.
Return on capital is pre-tax profit/operating capital (the money it takes to run the business).
- Joel Greenblatt’s gold standard proxy for quality and moatiness
- Analysts are expecting a 73% ROC in 2027.
- the average investment pays for itself in 17 months vs 7 years for the S&P 500
- 6X the industry’s ROC
- 5X the S&P 500’s ROC
AMZN’s ROC Has Been Stable For A Decade
AMZN’s ability to sustain industry-leading profitability over the decades despite all its challenges and risks confirms a wide and stable moat.
But as amazing as AMZN’s profitability is, it pales in comparison to Microsoft’s.
Microsoft’s Profitability Is Even Better
Microsoft’s profitability is historically in the top 4% of its peers, earning it a 10/10 on Gurufocus’s profitability model.
MSFT Trailing 12-Month Profitability Vs. Peers
| Metric | Industry Percentile | Major Software Companies More Profitable Than MSFT (Out Of 2,615) |
| Operating Margin | 97.87 | 56 |
| Net Margin | 96.80 | 84 |
| Return On Equity | 97.09 | 76 |
| Return On Assets | 96.21 | 99 |
| Return On Capital | 79.89 | 100 |
| Average | 93.57 | 168 |
(Source: Gurufocus Premium)
MSFT’s profitability is so immense that it’s the 169th most profitable large software company in the world, out of 2,615.
MSFT’s profitability is the stuff of legend, remaining relatively stable over 20 years.
- A free cash flow margin of 33% is in the top 10% of all companies on earth.
MSFT Margin Consensus Forecast
| Year | FCF Margin | EBITDA Margin | EBIT (Operating) Margin | Net Margin | Return On Capital Expansion |
Return On Capital Forecast |
| 2020 | 31.6% | 46.0% | 37.0% | 31.0% | 1.05 | |
| 2021 | 33.4% | 48.5% | 41.6% | 36.1% | TTM ROC | 115.93% |
| 2022 | 32.6% | 50.1% | 42.3% | 35.7% | Latest ROC | 118.98% |
| 2023 | 33.4% | 50.7% | 42.4% | 35.3% | 2024 ROC | 121.26% |
| 2024 | 34.2% | 51.1% | 43.5% | 36.0% | 2024 ROC | 124.45% |
| 2025 | NA | NA | NA | NA | Average | 122.86% |
| 2026 | NA | NA | NA | NA | Industry Median | 14.50% |
| 2027 | NA | NA | NA | NA | MSFT/Industry Median | 8.47 |
| Annualized Growth | 1.95% | 2.69% | 4.11% | 3.85% | Vs S&P | 8.41 |
| Annualized Growth (Ignoring Pandemic) | 0.77% | 1.74% | 1.51% | -0.06% |
(Source: FactSet Research Terminal)
MSFT’s incredible margins are expected to remain stable or improve slightly in the next few years.
Analysts are expecting a 123% ROC in 2027.
- the average investment pays for itself in 10 months vs. 7 years for the S&P 500
- 8.5X the industry’s ROC
- 8X the S&P 500’s ROC
MSFT ROC Has Been Stable For Three Decades
MSFT’s ability to sustain industry-leading profitability over three decades despite all its challenges and risks confirms a wide and stable moat.
But of course, quality alone isn’t enough to generate great returns.
- growth without quality and safety leads to eventual catastrophic losses
- safety and quality without growth leads to bond like returns
Growth Prospects: Winner Amazon
Cloud computing is one of the largest secular mega-trends in the world.
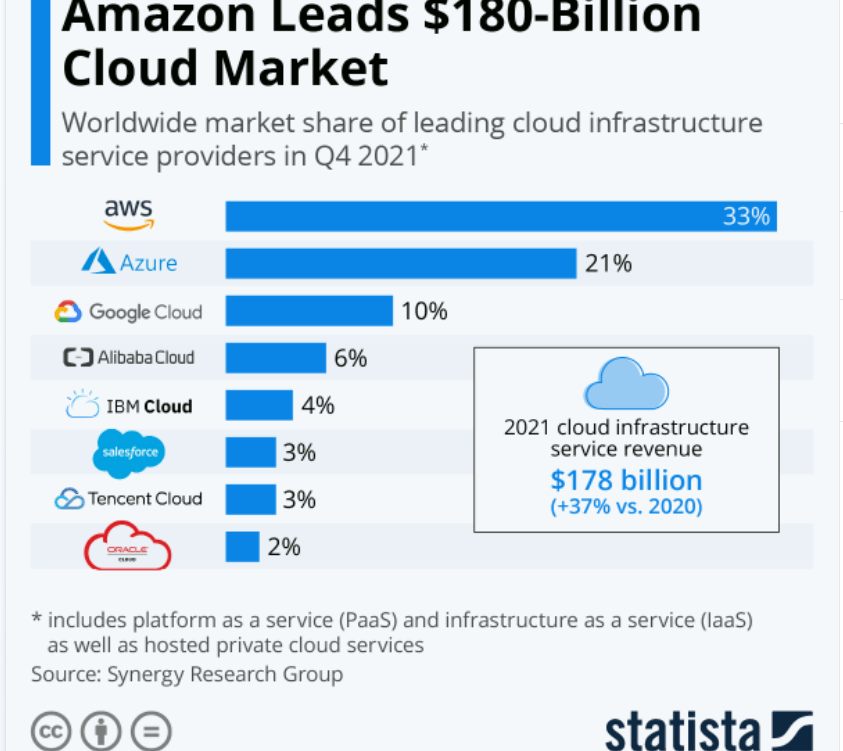
In 2021, cloud computing grew at 37% while AWS grew at 37%.
- Amazon is maintaining market share in cloud computing, despite the competition from MSFT, GOOG, CRM, IBM, and ORCL.
Cloud Computing Market Size Worth $1,554.94 Billion by 2030: Grand View Research, Inc.
Grandview Research expects the global cloud market to grow about 16% annually through 2030, meaning that AMZN is expected to maintain or even increase its market share.
IOT analytics thinks cloud computing will be worth $2 trillion per year within 10 to 20 years, and potentially as much as $10 trillion.
- IOT estimates that conservatively cloud computing will grow at least 4X in the next 10 to 20 years
- likely 13X growth
- potentially 64X growth
- cloud computing alone is a secular megatrend that Amazon could surf for decades to come
MSFT’s cloud computing business grew 50% in 2021, gaining market share. Not from Amazon but from struggling rivals like IBM (IBM).
And for the next few years, analysts expect that MSFT will keep gaining market share in the cloud.
- 44% growth in 2022
- 36% growth in 2023
- 34% growth in 2024
Is it any wonder that MSFT is expected to invest massively into growth?
MSFT Growth Spending Consensus Forecast
| Year | SG&A (Selling, General, Administrative) | R&D | Capex | Total Growth Spending | Sales | Growth Spending/Sales |
| 2020 | $24,709 | $19,269 | $45,234 | $89,212 | $143,015 | 62.38% |
| 2021 | $25,224 | $20,716 | $56,118 | $102,058 | $168,088 | 60.72% |
| 2022 | $28,218 | $23,755 | $64,738 | $116,711 | $198,655 | 58.75% |
| 2023 | $31,017 | $26,587 | $75,731 | $133,335 | $226,582 | 58.85% |
| 2024 | $32,224 | $29,592 | $87,878 | $149,694 | $257,200 | 58.20% |
| Annualized Growth | 6.86% | 11.32% | 18.06% | 13.81% | 15.80% | -1.72% |
| Total Spending 2021 To 2025 | $116,683 | $100,650 | $284,465 | $441,316 | $736,340 |
(Source: FactSet Research Terminal)
MSFT is growing growth spending by 14% per year, from $89 billion last year to an estimated $150 billion in 2024.
That includes a 50% increase in R&D spending from $19 billion to $30 billion.
What do analysts think that means for MSFT’s top and bottom lines over the next three years?
MSFT Medium-Term Growth Consensus Forecast
| Year | Sales | Free Cash Flow | EBITDA | EBIT (Operating Income) | Net Income |
| 2020 | $143,015 | $45,234 | $65,755 | $52,959 | $44,281 |
| 2021 | $168,088 | $56,118 | $81,602 | $69,916 | $60,651 |
| 2022 | $198,655 | $64,738 | $99,454 | $83,961 | $70,957 |
| 2023 | $226,582 | $75,731 | $114,791 | $95,965 | $79,951 |
| 2024 | $257,200 | $87,878 | $131,511 | $111,903 | $92,629 |
| Annualized Growth | 15.80% | 18.06% | 18.92% | 20.57% | 20.26% |
| Annualized Growth (Ignoring Pandemic) | 15.23% | 16.13% | 17.24% | 16.97% | 15.16% |
(Source: FactSet Research Terminal)
Incredible sales growth of almost 16% annually and bottom-line growth of 18% to 21%.
MSFT Dividend Growth Consensus Forecast
| Year | Dividend Consensus | FCF/Share Consensus | FCF Payout Ratio | Retained (Post-Dividend) Free Cash Flow | Buyback Potential | Debt Repayment Potential |
| 2022 | $2.43 | $8.38 | 29.0% | $44,625 | 2.08% | 76.7% |
| 2023 | $2.39 | $10.04 | 23.8% | $57,375 | 2.68% | 98.7% |
| 2024 | $2.57 | $11.82 | 21.7% | $69,375 | 3.23% | 132.1% |
| Total 2022 Through 2026 | $7.39 | $30.24 | 24.4% | $126,750.00 | 5.91% | 217.99% |
| Annualized Rate | 2.84% | 18.76% | -13.41% | 24.68% | 24.68% | 31.19% |
(Source: FactSet Research Terminal)
Credit rating agencies consider a 60% payout ratio safe for this industry and MSFT’s is under 30% and analysts think it could fall to 22%.
That could allow MSFT to retain $127 billion in post-dividend cash.
That’s enough to pay off its debt more than 2X over or buy back about 6% of shares over three years at current valuations.
MSFT Buyback Consensus Forecast
| Year | Consensus Buybacks ($ Millions) | % Of Shares (At Current Valuations) | Market Cap |
| 2022 | $26,899.0 | 1.3% | $2,146,877 |
| 2023 | $31,506.0 | 1.5% | $2,146,877 |
| 2024 | $34,279.0 | 1.6% | $2,146,877 |
| Total 2022-2024 | $92,684.00 | 4.3% | $2,146,877 |
| Annualized Rate | 1.45% | Average Annual Buybacks | $30,894.67 |
(Source: FactSet Research Terminal)
Analysts expect an average of $31 billion in annual buybacks from MSFT over the next three years, totaling $93 billion and repurchasing about 1.5% of its shares annually.
MSFT’s historical buyback rate is 2.3% CAGR.
| Time Frame (Years) | Net Buyback Rate | Shares Remaining | Net Shares Repurchased | Each Share You Own Is Worth X Times More (Not Including Future Growth And Dividends) |
| 5 | 1.5% | 92.72% | 7.28% | 1.08 |
| 10 | 1.5% | 85.97% | 14.03% | 1.16 |
| 15 | 1.5% | 79.72% | 20.28% | 1.25 |
| 20 | 1.5% | 73.91% | 26.09% | 1.35 |
| 25 | 1.5% | 68.53% | 31.47% | 1.46 |
| 30 | 1.5% | 63.55% | 36.45% | 1.57 |
(Source: DK Research Terminal, FactSet)
If MSFT buys back stock at 1.5%, as analysts expect, then over 30 years that could be a 36% reduction in share count.
- boosting EPS, FCF, and dividends per share by 57%
- not counting MSFT’s impressive future growth forecasts
And what about the long-term?
MSFT Long-Term Growth Outlook
(Source: FactSet Research Terminal)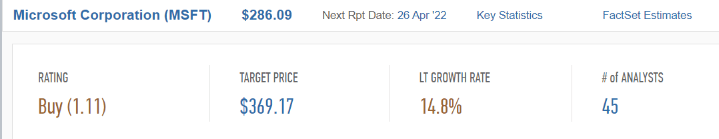
- 20-year growth rate: 13.6% CAGR
- individual analyst growth range: 12.3% to 18.0% CAGR
- median growth consensus from all analysts: 14.8% CAGR
If MSFT continues to grow at its historical rate of the last 20 years, which analysts expect will happen (powered largely by cloud computing), then it could deliver life-changing, and rich-retirement-making wealth over time.
| Investment Strategy | Yield | LT Consensus Growth | LT Consensus Total Return Potential | Long-Term Risk-Adjusted Expected Return | Long-Term Inflation And Risk-Adjusted Expected Returns | Years To Double Your Inflation & Risk-Adjusted Wealth |
10 Year Inflation And Risk-Adjusted Return |
| Amazon | 0.0% | 23% | 23.0% | 16.1% | 13.6% | 5.3 | 3.58 |
| Adam’s Planned Correction Buys | 3.9% | 18.9% | 22.8% | 16.0% | 13.5% | 5.3 | 3.54 |
| Microsoft | 0.9% | 14.8% | 15.7% | 11.0% | 8.5% | 8.5 | 2.26 |
| Nasdaq (Growth) | 0.8% | 14.3% | 15.1% | 10.6% | 8.1% | 8.9 | 2.17 |
| Dividend Aristocrats | 2.2% | 8.9% | 11.1% | 7.8% | 5.3% | 13.6 | 1.67 |
| S&P 500 | 1.4% | 8.5% | 9.9% | 7.0% | 4.5% | 16.1 | 1.55 |
(Source: Morningstar, FactSet, Ycharts)
Analysts think MSFT could deliver almost 16% annual returns over the long-term.
That’s literally on par with some of the greatest investors in history and is better than what analysts expect the Nasdaq to deliver.
Inflation-Adjusted Consensus Return Potential: $1,000 Initial Investment
| Time Frame (Years) | 7.4% CAGR Inflation-Adjusted S&P Consensus | 8.6% Inflation-Adjusted Aristocrat Consensus | 13.2% CAGR Inflation-Adjusted MSFT Consensus | Difference Between Inflation Adjusted MSFT Consensus And S&P Consensus |
| 5 | $1,429.63 | $1,511.29 | $1,859.62 | $348.32 |
| 10 | $2,043.84 | $2,284.01 | $3,458.18 | $1,174.17 |
| 15 | $2,921.94 | $3,451.81 | $6,430.90 | $2,979.09 |
| 20 | $4,177.29 | $5,216.70 | $11,959.03 | $6,742.32 |
| 25 | $5,971.97 | $7,883.98 | $22,239.23 | $14,355.25 |
| 30 | $8,537.71 | $11,915.01 | $41,356.49 | $29,441.48 |
(Source: DK Research Terminal, FactSet)
Even if MSFT only grows at the expected rate for a decade, that is still incredible wealth-building potential.
| Time Frame (Years) | Ratio Aristocrats/S&P | Ratio Inflation-Adjusted MURGY Consensus And S&P Consensus |
| 5 | 1.06 | 1.30 |
| 10 | 1.12 | 1.69 |
| 15 | 1.18 | 2.20 |
| 20 | 1.25 | 2.86 |
| 25 | 1.32 | 3.72 |
| 30 | 1.40 | 4.84 |
(Source: DK Research Terminal, FactSet)
Over the next 10 years, MSFT could outperform the S&P 500 by over 70%
- potentially much more if the S&P has a lost decade
And over a longer time frame could potentially deliver 5X the inflation-adjusted returns.
But as strong as MSFT’s growth outlook is, it pales in comparison to Amazon’s.
AMZN Long-Term Growth Outlook
(Source: FactSet Research Terminal)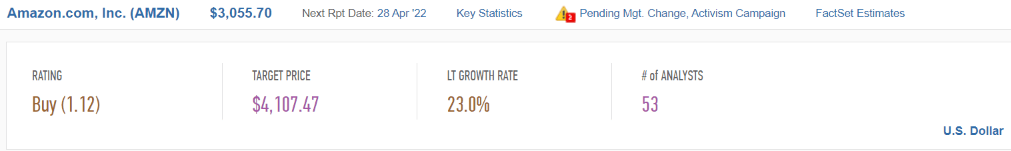
- 20-year growth rate: 32% CAGR
- consensus growth range (5 sources): 21.8% to 34.8% CAGR
- individual analyst growth range: 16.7% to 36.0% CAGR
- median growth consensus from all analysts: 23.0% CAGR
Amazon’s growth potential is incredible, driven by online retail, cloud computing, and advertising.
That’s why it’s spending more on growth than most governments.
AMZN Growth Spending Consensus Forecast
| Year | SG&A (Selling, General, Administrative) | R&D | Capex | Total Growth Spending | Sales | Growth Spending/Sales |
| 2021 | $40,848 | $49,407 | $55,396 | $145,651 | $469,822 | 31.00% |
| 2022 | $45,807 | $61,918 | $58,470 | $166,195 | $541,162 | 30.71% |
| 2023 | $52,678 | $71,870 | $60,543 | $185,091 | $634,773 | 29.16% |
| 2024 | $57,007 | $79,177 | $66,680 | $202,864 | $730,456 | 27.77% |
| 2025 | $63,919 | $80,644 | $74,058 | $218,621 | $822,071 | 26.59% |
| 2026 | $70,350 | $88,874 | $65,660 | $224,884 | $913,073 | 24.63% |
| 2027 | $76,590 | $96,909 | $67,952 | $241,451 | $1,018,050 | 23.72% |
| Annualized Growth | 11.05% | 13.03% | 7.53% | 10.69% | 15.01% | -3.76% |
| Total Spending 2022 To 2027 | $366,351 | $479,392 | $393,363 | $699,801 | 15.01% | 39.28% |
(Source: FactSet Research Terminal)
AMZN is increasing its growth spending by 11% per year, from $146 billion in 2021 to almost a quarter of a trillion in 2027.
- almost $100 billion in R&D alone in 2027
Over the next five years, analysts think Amazon will spend $700 billion on growth, a level of investment that is usually the realm of continent-spanning national governments, not public companies.
What kind of growth do analysts expect from $700 billion in growth spending?
AMZN Medium-Term Growth Consensus Forecast
| Year | Sales | Free Cash Flow | EBITDA | EBIT (Operating Income) | Net Income |
| 2020 | $386,064 | $31,018 | $57,284 | $22,899 | $21,331 |
| 2021 | $469,822 | -$9,069 | $71,994 | $24,879 | $33,364 |
| 2022 | $541,162 | $30,129 | $80,760 | $30,865 | $25,171 |
| 2023 | $634,773 | $49,249 | $104,819 | $46,921 | $39,303 |
| 2024 | $730,456 | $69,224 | $133,792 | $70,372 | $58,283 |
| 2025 | $822,071 | $85,015 | $165,979 | $93,647 | $76,155 |
| 2026 | $913,073 | $151,987 | $202,841 | $121,127 | $102,200 |
| 2027 | $1,018,050 | $184,302 | $238,295 | $151,031 | $127,408 |
| Annualized Growth | 14.86% | 28.99% | 22.59% | 30.93% | 29.09% |
| Annualized Growth (Ignoring Pandemic) | 13.76% | NA | 22.08% | 35.06% | 25.02% |
(Source: FactSet Research Terminal)
Amazon’s growth is astounding given its size.
- 14% sales growth outside of the pandemic on a base of nearly $500 billion in revenue
- free cash flow growing almost 30% per year
- bottom line growing at 23% to 31% per year
Amazon is expected to generate almost $200 billion in free cash flow in 2027.
- after spending over $241 billion on growth
- the most profitable company in human history, if it grows as expected
| Metric | 2022 Growth Consensus | 2023 Growth Consensus | 2024 Growth Consensus | 2025 Growth Consensus | 2026 Growth Consensus |
2027 Growth Consensus |
| Sales | 15% | 18% | 15% | 13% | 11% | 11% |
| EPS | -25% | 52% | 43% | 33% | 33% | 23% |
| Operating Cash Flow | 88% | 22% | 30% | 24% | 39% | 15% |
| Free Cash Flow | 460% | 52% | 52% | 33% | 24% | 20% |
| EBITDA | 67% | 32% | 25% | NA | NA | NA |
| EBIT (operating income) | 23% | 50% | 49% | NA | NA | NA |
(Source: FAST Graphs, FactSet Research)
Amazon’s sales growth is expected to be double-digits for the foreseeable future.
Its free cash flow of nearly $200 billion per year in 2027 is expected to be growing at 20%.
- there has never been a growth stock like Amazon
- this level of growth is unprecedented in human history
And here’s something that should really get Amazon investors excited.
AMZN Buyback Potential Consensus Forecast
| Year | FCF/Share Consensus | Retained (Post-Dividend) Free Cash Flow | Buyback Potential | Debt Repayment Potential |
| 2022 | $48.57 | $24,576 | 1.57% | 50.4% |
| 2023 | $85.81 | $43,420 | 2.77% | 89.1% |
| 2024 | $164.06 | $83,014 | 5.29% | 175.2% |
| 2025 | $219.16 | $110,895 | 7.07% | 233.4% |
| 2026 | $274.67 | $138,983 | 8.86% | 285.2% |
| 2027 | $331.90 | $167,941 | 10.70% | 350.6% |
| Total 2022 Through 2026 | $1,124.17 | $568,830.02 | 36.24% | 1166.97% |
| Annualized Rate | 37.75% | 37.75% | 37.75% | 38.16% |
(Source: FactSet Research Terminal)
Amazon, after spending an estimated $700 billion on growth, is expected to retain $569 billion in free cash flow!
That’s enough to repay its debt 12X over or buyback 36% of its shares at current valuations.
Amazon isn’t expected to pay a dividend for the foreseeable future.
However, $569 billion in consensus free cash flow, AFTER investing in growth, has to go somewhere.
- $10 billion buyback authorization is a drop in the bucket of what’s needed
Inflation-Adjusted Consensus Return Potential: $1,000 Initial Investment
| Time Frame (Years) | 7.4% CAGR Inflation-Adjusted S&P Consensus | 8.6% Inflation-Adjusted Aristocrat Consensus | 20.5% CAGR Inflation-Adjusted AMZN Consensus | Difference Between Inflation Adjusted AMZN Consensus And S&P Consensus |
| 5 | $1,429.63 | $1,511.29 | $2,541.65 | $1,030.35 |
| 10 | $2,043.84 | $2,284.01 | $6,459.98 | $4,175.96 |
| 15 | $2,921.94 | $3,451.81 | $16,418.98 | $12,967.17 |
| 20 | $4,177.29 | $5,216.70 | $41,731.28 | $36,514.58 |
| 25 | $5,971.97 | $7,883.98 | $106,066.24 | $98,182.26 |
| 30 | $8,537.71 | $11,915.01 | $269,583.06 | $257,668.05 |
(Source: DK Research Terminal, FactSet)
AMZN can’t grow at 23% for decades, but even 10 years of expected growth could result in 6.5X inflation-adjusted returns.
| Time Frame (Years) | Ratio Aristocrats/S&P | Ratio Inflation-Adjusted AMZN Consensus And S&P Consensus |
| 5 | 1.06 | 1.78 |
| 10 | 1.12 | 3.16 |
| 15 | 1.18 | 5.62 |
| 20 | 1.25 | 9.99 |
| 25 | 1.32 | 17.76 |
| 30 | 1.40 | 31.58 |
(Source: DK Research Terminal, FactSet)
Over the next 10 years, AMZN could potentially more than triple the S&P 500’s returns.
- potentially much more if the S&P has a lost decade
Valuation: Winner Amazon
For 20 years, outside of bear markets and bubbles, billions of investors have paid 25X to 27X cash flow for Amazon.
- a 91% statistical probability that about 26X cash flow is intrinsic value for AMZN
| Metric | Historical Fair Value Multiples (14-Years) | 2022 | 2023 | 2024 | 2025 |
12-Month Forward Fair Value |
| Operating Cash Flow | 25.98 | $4,403.09 | $5,358.89 | $6,943.93 | $8,089.39 | |
| Average | $4,403.09 | $5,358.89 | $6,943.93 | $8,089.39 | $4,697.18 | |
| Current Price | $3,085.95 | |||||
|
Discount To Fair Value |
29.91% | 42.41% | 55.56% | 61.85% | 34.30% | |
| Upside To Fair Value | 42.68% | 73.65% | 125.02% | 162.14% | 52.21% | |
| 2022 OCF | 2023 OCF | 2022 Weighted OCF | 12-Month Forward OCF | 12-Month Average Fair Value Forward P/OCF |
Current Forward P/OCF |
|
| $169.48 | $206.27 | $63.47 | $180.80 | 26.0 | 17.1 |
AMZN trading at 17X forward cash flow is a screaming bargain, especially given its 23% growth consensus.
What about Microsoft?
(Source: FactSet Research Terminal)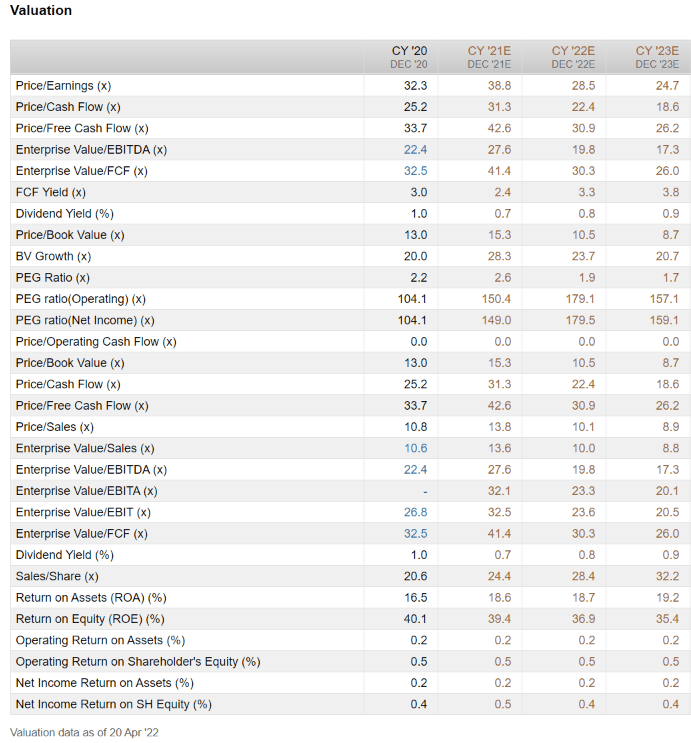
28.5X forward earnings is historically rich for MSFT which historically trades at 18.5 to 25.5X earnings in the Satya Nadella era.
However, when we back out cash, we get an EV/EBITDA (cash-adjusted PE) of 19.8X which is arguably reasonable for one of the world’s greatest and widest moat companies.
- MSFT fair value $267.19
- current price: $287.28
- discount: -7.52%
- DK rating: hold
And this brings us to the biggest reason I personally favor Amazon over Microsoft right now.
Long-Term Return Potential: Amazon
What kind of returns do analysts think are possible from AMZN and MSFT today?
MSFT 2024 Consensus Total Return Potential
(Source: FAST Graphs, FactSet)
If MSFT grows as analysts expect by 2024, it could deliver 13% total returns, or 6% annually.
MSFT 2027 Consensus Total Return Potential
(Source: FAST Graph, FactSet) (Source: FAST Graph, FactSet)
By 2027, if MSFT grows as expected and returns to historical fair value, it could deliver solid 75% total returns or 11% annually.
But while double the market’s potential returns is nice, just take a look at what Amazon is offering.
Amazon Is The Fattest Pitch On Wall Street
AMZN 2024 Consensus Total Return Potential
(Source: FAST Graphs, FactSet)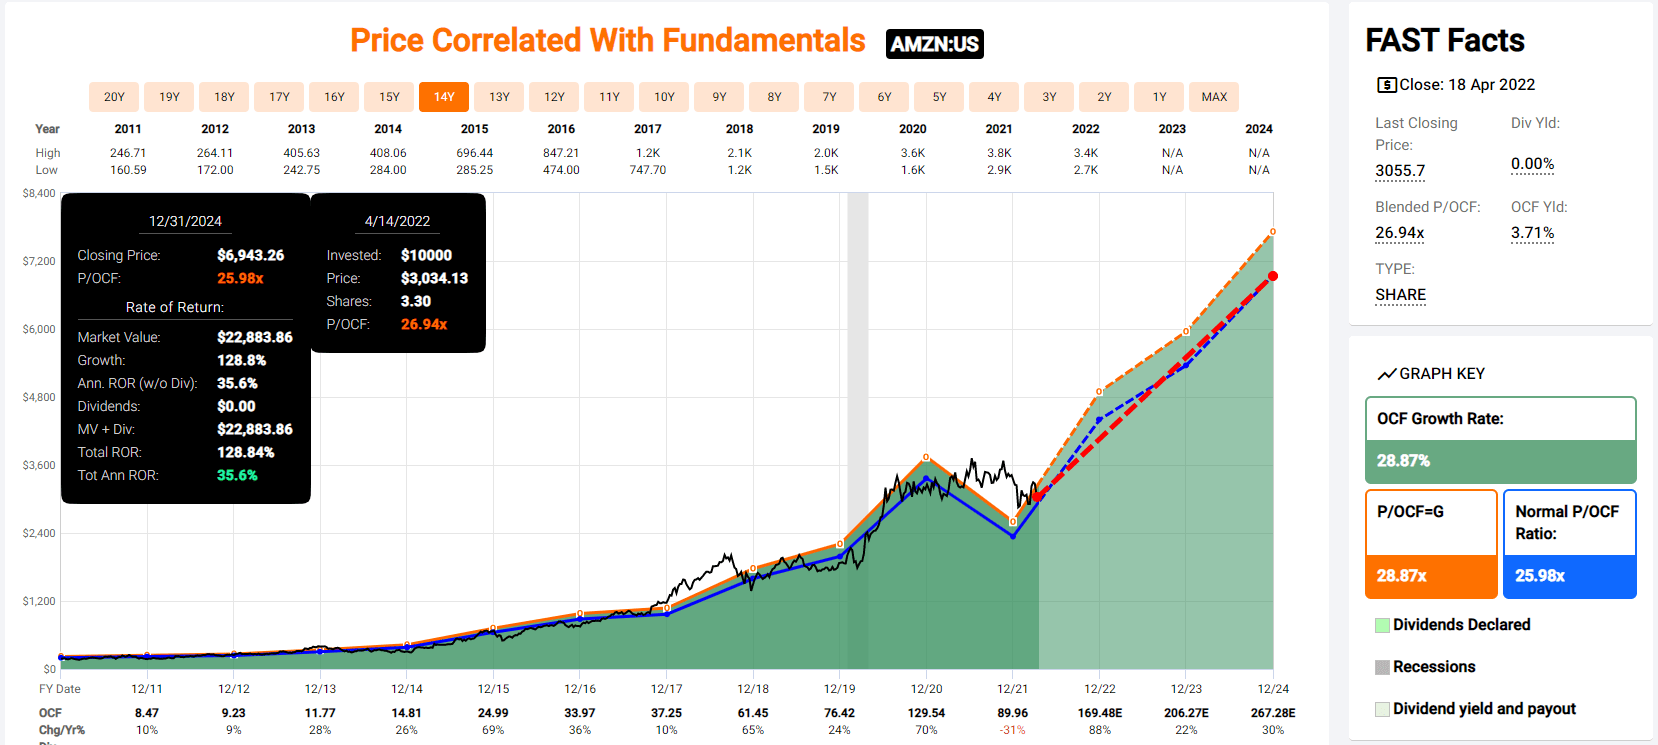
If AMZN grows as analysts expect by 2024, it could deliver 129% total returns, or 36% annually.
- Buffett-like returns from an anti-bubble blue-chip bargain hiding in plain sight
AMZN 2027 Consensus Total Return Potential
(Source: FAST Graph, FactSet) (Source: FAST Graph, FactSet)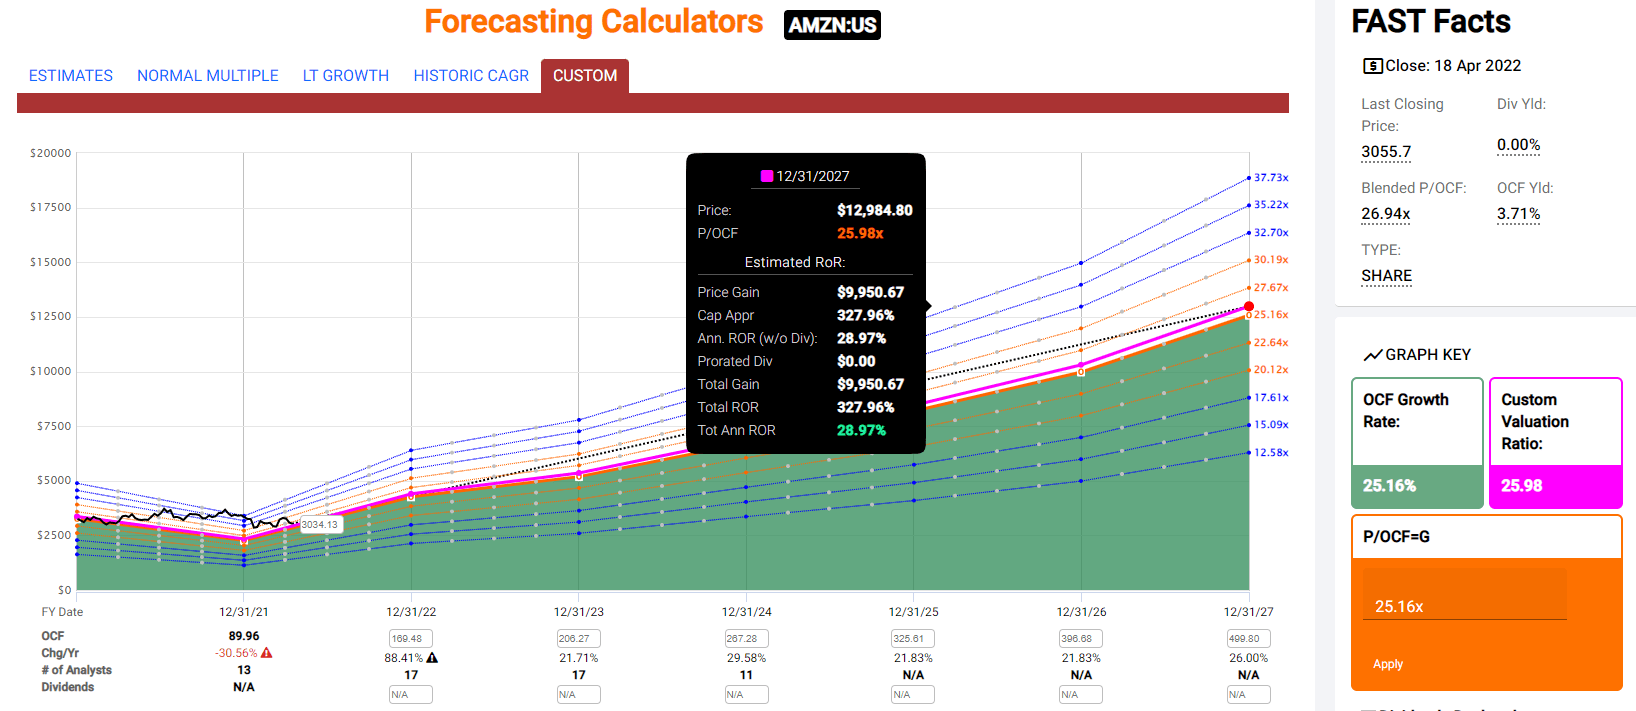
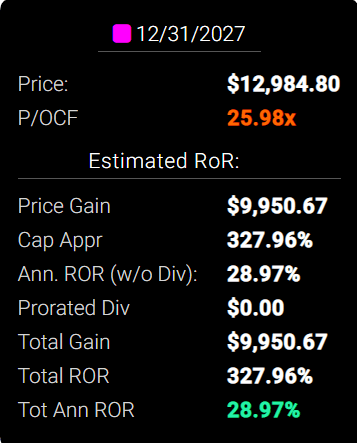
By 2027, if AMZN grows as expected and returns to historical fair value, it could more than quadruple and deliver 29% annual total returns.
- also Buffett-like returns
- 9X the S&P 500 consensus
Bottom Line: Both Amazon And Microsoft Are Ultra SWANs That Can Help You Retire In Safety And Splendor
Is it a mistake to buy MSFT at 19.8X cash-adjusted earnings today?
That depends on your goals, time horizon, and risk profile.
Microsoft Is The Clear Winner If Safety And Quality Are Your Top Priority
| Company | Microsoft | Amazon | MSFT Wins | AMZN Wins |
| Yield | 0.9% | 0.0% | 1 | |
| LT Growth Consensus | 14.8% | 23.0% | 1 | |
| Total Return Potential | 15.7% | 23.0% | 1 | |
| Risk-Adjusted Expected Return | 11.0% | 16.1% | 1 | |
| Discount To Fair Value | -7.0% | 34.0% | 1 | |
| DK Rating | Hold | Very Strong Buy | 1 | |
| Quality Score | 99% | 93% | 1 | |
| Safety Score | 100% | 100% | 1 | 1 |
| Dependability Score | 99% | 84% | 1 | |
| Long-Term Risk-Management Industry Percentile | 92% | 53% | 1 | |
| Credit Rating | AAA stable | AA stable | 1 | |
| 30-Year Bankruptcy Risk | 0.07% | 0.51% | 1 | |
| Dividend Growth Streak (Years) | 18 | NA | 1 | |
| Return On Capital (12-Months) | 119% | 30% | 1 | |
| Return On Capital Industry Percentile | 80% | 65% | 1 | |
| Return On Capital (13-Year Median) | 136% | 15% | 1 | |
| Return On Capital (5-Year trend) | -5.60% | 8% | 1 | |
| Sum | 11 | 7 |
But while MSFT is hard to beat in terms of quality, AMZN is also one of the safest companies on earth.
And one that offers superior growth, valuation, and total return potential.
AMZN Investment Decision Score
DK (Source: DK Automated Investment Decision Tool)
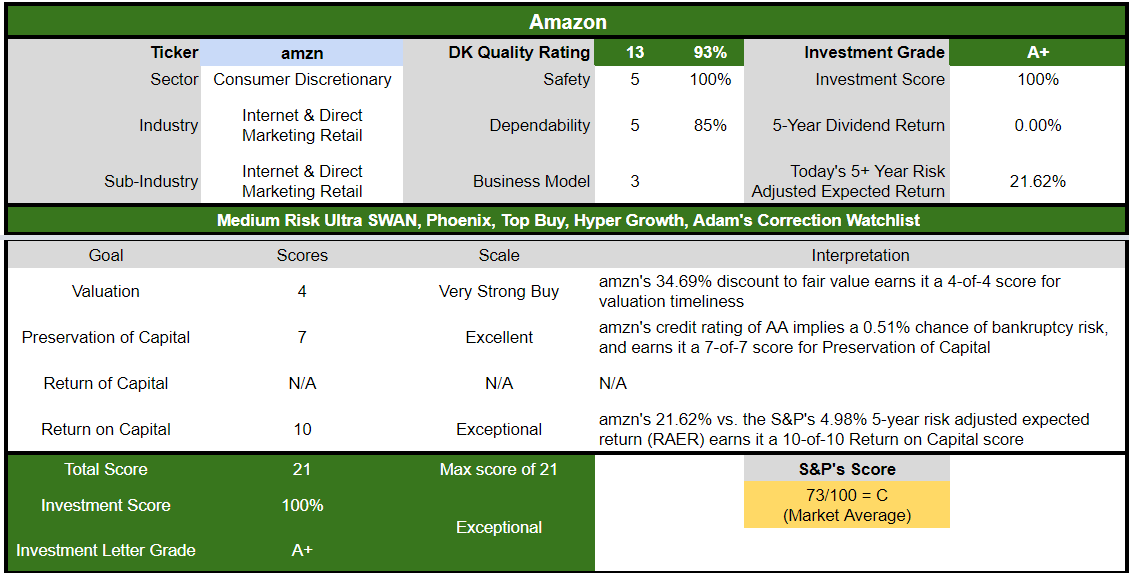
For anyone comfortable with its risk profile, AMZN is as close to a perfect hyper-growth blue-chip investment as exists on Wall Street today.
- 35% discount vs. 12% market premium = 47% better valuation
- far superior fundamental quality and safety
- 130% higher long-term return potential than S&P 500 overtime
- 4X the risk-adjusted expected return for the next five years
The biggest potential reason not to buy AMZN right now is the good but not great 2.2% yield.
- QCOM + MMP = 4.0% very safe yield and 17.3% CAGR long-term return potential (K1-tax form)
- AMZN + BTI = 3.5% very safe yield and 19.0% CAGR long-term return potential (no K1-tax form)
Does this mean that MSFT is a terrible investment right now?
MSFT Investment Decision Score
(Source: DK Automated Investment Decision Tool)
Compared to the historically 14% overvalued S&P 500, MSFT is actually a satisfactory investment opportunity.
But in a market awash in blue-chip bargains, I recommend taking the biggest swings at the fattest pitches.
“Wait for a fat pitch, and then swing for the fences.” – Warren Buffett
Ycharts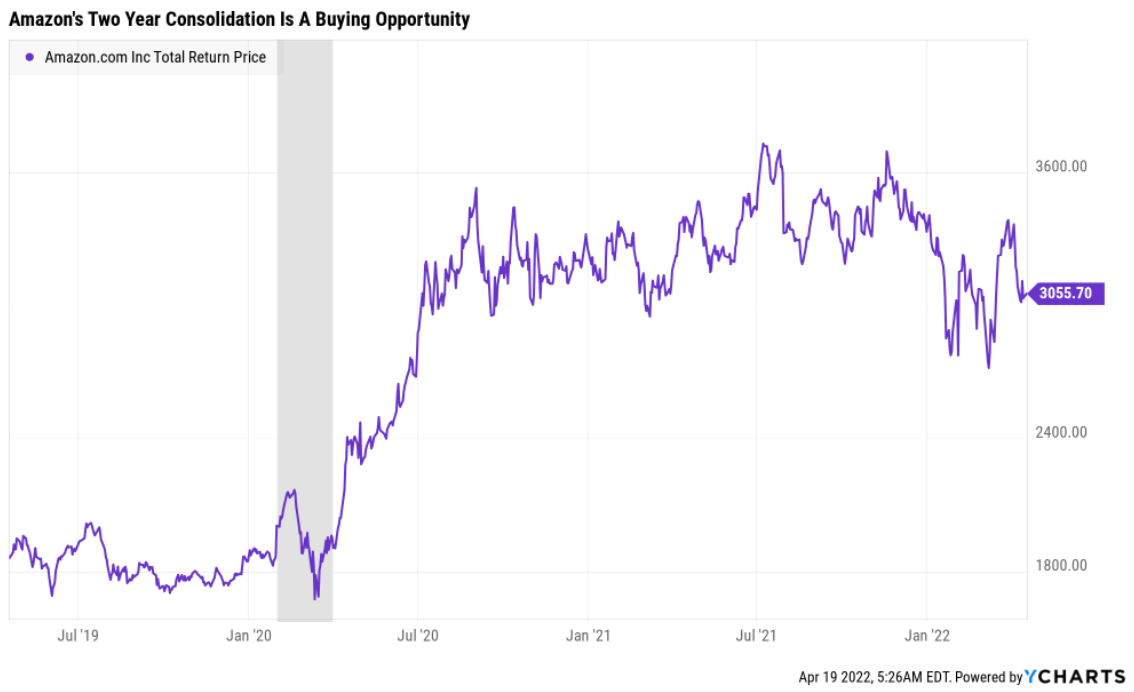
Amazon exploded higher during the pandemic because its fundamentals were booming.
- at its August peak, it was approximately fair value
- and now fundamentals have grown two years with a flat price
- AMZN has become steadily more undervalued for two years
Ycharts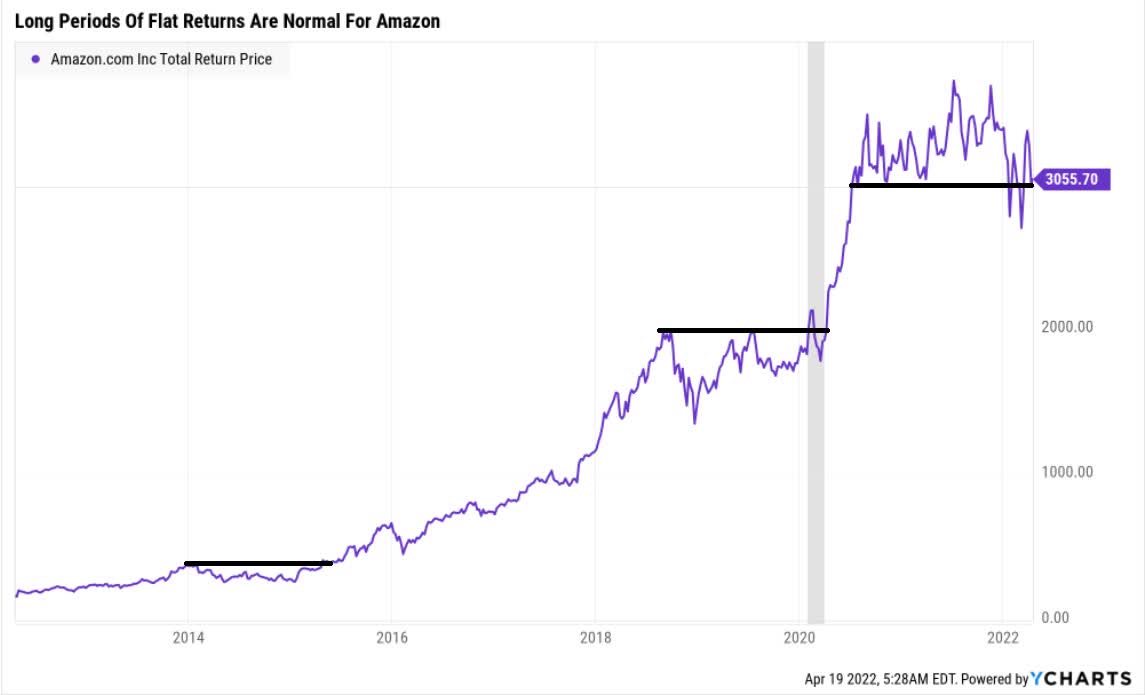
Amazon is a coiled spring hyper-growth Ultra SWAN and a potentially wonderful way to make your own luck on Wall Street.
And that’s why I and Dividend Kings have spent the last two years steadily building our positions in Amazon.
The John Templeton/Howard Marks 80% certainty limit on Wall Street means that you can never be more than 80% sure about any given company.
But I can say with 80% absolute certainty that Amazon today represents one of the fattest pitches on Wall Street.
- “I’ll die on this hill” confidence
- Buffett-like return potential from a blue-chip bargain hiding in plain sight
Anyone buying AMZN today is likely to feel like a stock market genius in 5+ years.
Be the first to comment