

Nature/iStock via Getty Images
This article was originally published on Dividend Kings on Wed, January 25th, 2023.
—————————————————————————————
2022 was a terrible year for growth stocks that suffered a one-two-punch of the fastest interest rate increases in 40 years and growth concerns.
That’s because the bond market is now estimating a 100% chance of a recession in 2023, thanks to the Fed’s war on inflation.
Do you know who agrees with the bond market that a recession is very likely this year?
- 85% of economists in the Wall Street Journal consensus
- 85% of CEOs in Bloomberg’s survey
- 85% of Americans
For companies like Alibaba (NYSE:BABA) and Amazon (NASDAQ:AMZN), growth concerns are especially important right now.
Like many big tech companies, Amazon hired a lot of people since the Pandemic. In fact, it hired almost 800,000 workers, doubling the size of its workforce.
In 2021 alone, it doubled its delivery capacity. Let me put that in perspective.
Over 25 years, Amazon built up one of the most impressive global delivery infrastructures in history. And in a single year, they doubled that capacity to keep up with the Pandemic driven demand.
Now with a recession looming, Amazon and many big tech giants are cutting workers for the first time in about a decade.
Meanwhile, Alibaba has been facing a two-year government crackdown on its tech industry, including billions in fines and stricter regulations. Add to that China’s lockdowns over COVID, and that’s why growth estimates for BABA fell from 25% long-term into the low single digits.
Now with tech earnings season upon us, several Dividend Kings members have asked me for an update on Alibaba and Amazon to make sure their investment theses are intact.
So let’s take a look at how these growth tech giants are faring today, ahead of earnings.
Because while both of them are attractively valued and could potentially make you a lot of money in the next few years, just one offers the potential for life-changing returns.
And just one is a name I’d recommend buying before earnings season, because of the potential for a double-digit pop, if they clear very low expectations.
Alibaba: Two Big Tailwinds Ahead
The first thing to know about BABA is that the tech crackdown might finally be ending.
The crackdown on fintech operations of more than a dozen internet companies is “basically” over, said Guo Shuqing, the Communist Party boss at the People’s Bank of China, in an interview with state-run Xinhua news agency on Saturday.” – CNN
That doesn’t mean that the government is going to suddenly reverse its regulations or stop fining BABA in particular, it just means that this headwind to growth probably won’t keep getting worse.
That’s why Ryan Cohen, billionaire hedge fund manager, is buying a large stake in BABA.
based on his belief that it can achieve double-digit sales and nearly 20% free-cash-flow growth over the next five years.” – Wall Street Journal
Mr. Cohen is pushing for more buybacks that he thinks could turn Alibaba into a Wall Street darling once more.
China’s ending of Covid-zero on January 8th, but which began in December of 2022, is expected to result in strong 5% to 6% GDP growth in 2023.
That’s certainly a relief for long-suffering BABA investors.
BABA Peak Declines Since 2014 IPO
Portfolio Visualizer Premium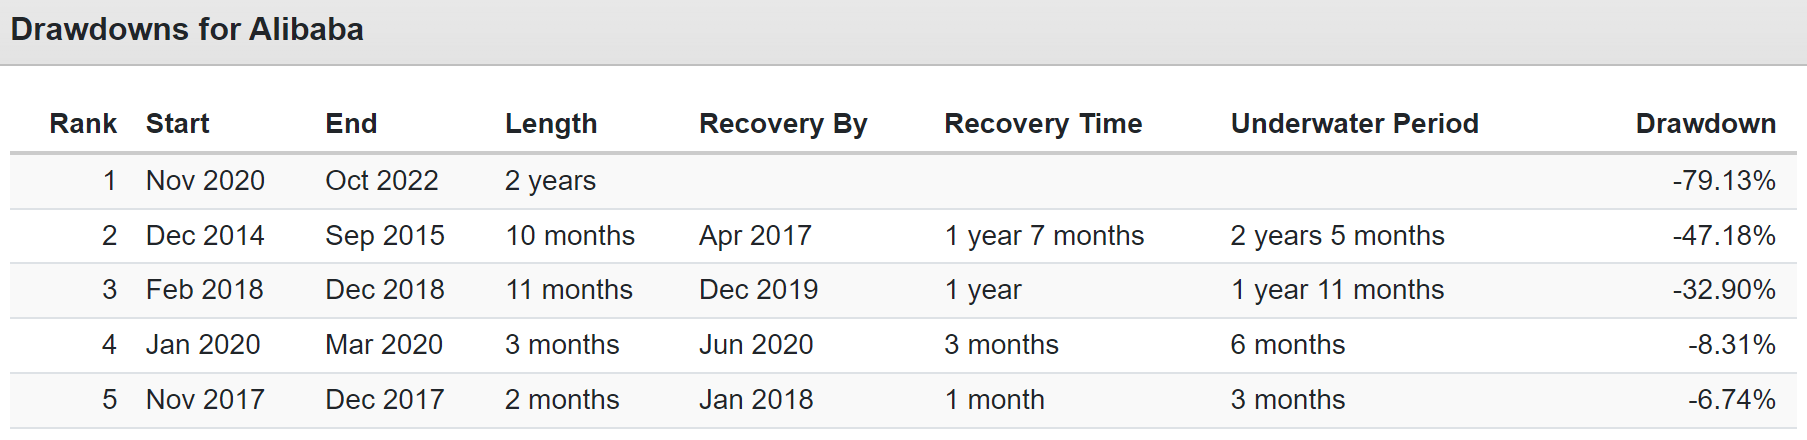
BABA fell into a nearly 80% bear market, by far the worst in its history, thanks to years of the government’s war on tech, plus the Pandemic.
Ycharts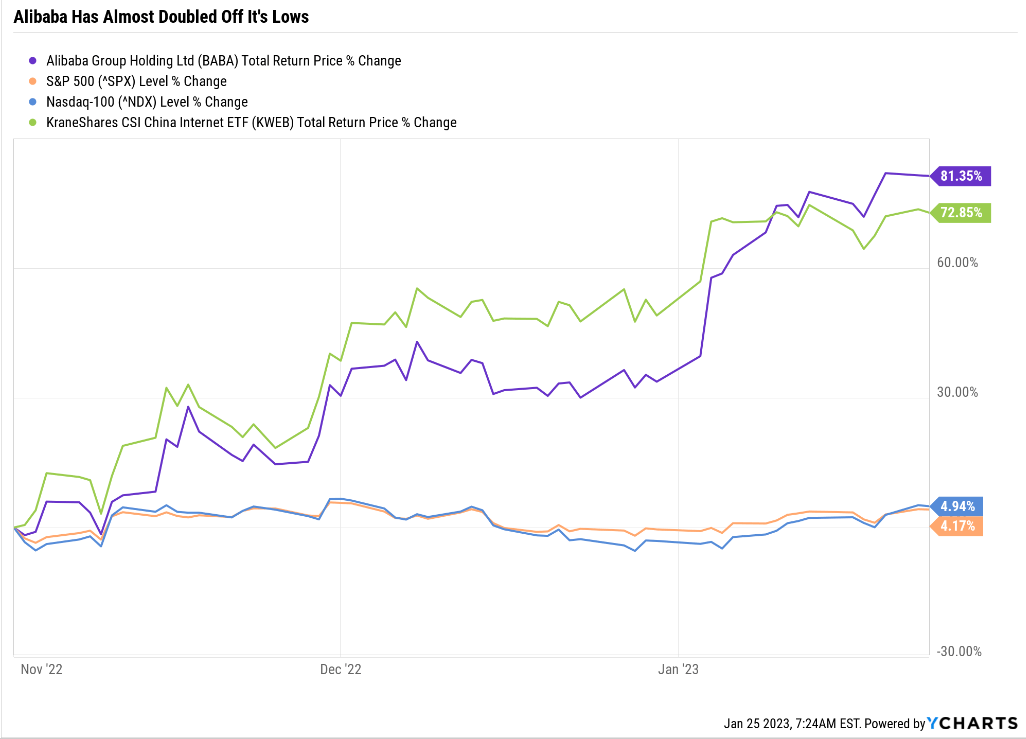
But off its November lows, BABA has nearly doubled in about two months. In fact, Chinese tech stocks have been one of the best-performing assets. Is that rally based on actual facts? Or mere hopium?
Why Wall Street Suddenly Loves Alibaba
Alibaba Medium-Term Growth Consensus
| Year | Sales | Free Cash Flow | EBITDA | EBIT (Operating Income) | Net Income |
| 2022 | $126,591 | $16,438 | $23,477 | $10,334 | $9,194 |
| 2023 | $129,739 | $11,153 | $25,392 | $14,281 | $8,917 |
| 2024 | $144,747 | $20,783 | $28,929 | $17,994 | $16,340 |
| 2025 | $159,815 | $26,006 | $32,534 | $22,800 | $19,097 |
| 2026 | $176,300 | $28,544 | $37,888 | $27,343 | $22,918 |
| 2027 | $181,484 | NA | $50,403 | $36,151 | $28,131 |
| 2028 | $194,549 | NA | $57,620 | $42,387 | $33,150 |
| Annualized Growth 2022-2028 | 7.42% | 14.79% | 16.14% | 26.52% | 23.83% |
| Cumulative 2023-2028 | $986,634 | $86,486 | $232,766 | $160,956 | $128,553 |
(Source: FactSet Research Terminal)
Alibaba’s absolute growth in sales is expected to remain muted going forward, just 7% to 8%. However, cash flow and profits are expected to grow 2X to 4X faster, thanks to rising margins.
Free cash flow is expected to rise by 150% by 2026, which is the big reason Ryan Cohen is such a fan of the stock. Over the next four years, analysts expect BABA to generate $87 billion in free cash flow.
Why is BABA’s growth outlook improved relative to a few months ago?
Alibaba Profit Margin Consensus
| Year | FCF Margin | EBITDA Margin | EBIT (Operating) Margin | Net Margin |
| 2022 | 13.0% | 18.5% | 8.2% | 7.3% |
| 2023 | 8.6% | 19.6% | 11.0% | 6.9% |
| 2024 | 14.4% | 20.0% | 12.4% | 11.3% |
| 2025 | 16.3% | 20.4% | 14.3% | 11.9% |
| 2026 | 16.2% | 21.5% | 15.5% | 13.0% |
| 2027 | NA | 27.8% | 19.9% | 15.5% |
| 2028 | NA | 29.6% | 21.8% | 17.0% |
| Annualized Growth 2022-2028 | 5.67% | 8.11% | 17.78% | 15.27% |
(Source: FactSet Research Terminal)
Alibaba has 1 billion customers out of 1.2 billion Chinese internet users and a population of 1.4 billion.
- 71% of Chinese people use Alibaba vs. 63% of Americans who use Amazon
(Source: FactSet Research Terminal)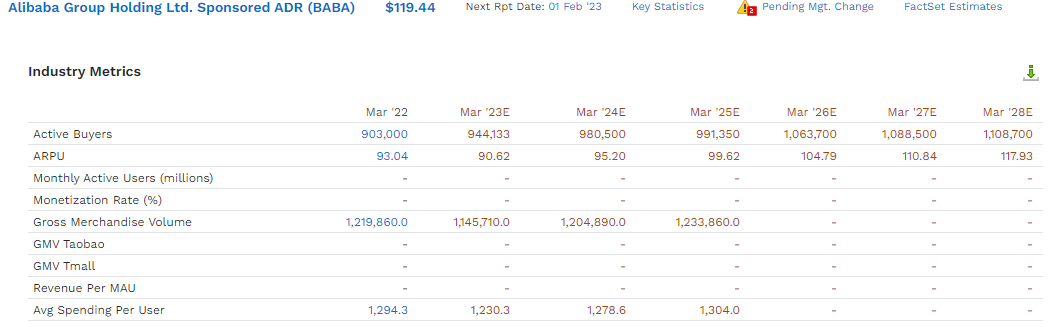
By 2028 BABA is expected to have 1.1 billion users spending over $1300 per year.
- Average Amazon Prime members spend $1400 per year, and non-prime members $600
Given China’s GDP per capita is $12,600 and America’s is $71,000, that’s very impressive.
Ok, so BABA’s growth outlook APPEARS to have improved, and after an 80% crash, it might have been cheap. But what about now, after an 80% rally?
Alibaba Is Still Highly Undervalued
During periods of growth similar to what BABA is expected to deliver in the future, billions of investors have paid around 21X operating cash flow for BABA.
| Metric | Historical Fair Value Multiples (9-Years) | 2022 | 2023 | 2024 | 2025 |
12-Month Forward Fair Value |
| Operating Cash Flow | 21.08 | $176.65 | $169.69 | $235.67 | $182.97 | |
| Average | $176.65 | $169.69 | $235.67 | $182.97 | $174.77 | |
| Current Price | $119.44 | |||||
|
Discount To Fair Value |
32.39% | 29.61% | 49.32% | 34.72% | 31.66% | |
| Upside To Fair Value | 47.90% | 42.07% | 97.32% | 53.19% | 46.32% | |
| 2023 OCF | 2024 OCF | 2023 Weighted OCF | 2024 Weighted EPS | 12-Month Forward OCF | 12-Month Average Fair Value Forward P/OCF |
Current Forward P/OCF |
| $8.05 | $11.18 | $7.43 | $0.86 | $8.29 | 21.1 | 14.4 |
BABA trades at 14.4X cash flow and 11X cash-adjusted earnings. And that’s after an 80% rally.
- At its lows, BABA traded at 8X cash flow and 6X cash-adjusted earnings
It’s 32% historically undervalued and offers a 46% upside to fair value.
|
Analyst Median 12-Month Price Target |
Morningstar Fair Value Estimate |
| $146.01 (17.6X cash flow) | $177.00 (21.4X cash flow) |
|
Discount To Price Target (Not A Fair Value Estimate) |
Discount To Fair Value |
| 18.20% | 32.52% |
|
Upside To Price Target |
Upside To Fair Value |
| 22.25% | 48.19% |
(Source: FactSet, Morningstar)
Morningstar’s discounted cash flow model agrees with our fair value model that BABA is worth about 21X cash flow and $177 today, which implies a nearly 50% upside to fair value. Analysts expect a 22% rally from BABA over the next year to a cash flow multiple of 17.6X.
Alibaba 2025 Consensus Total Return Potential
FAST Graphs, FactSet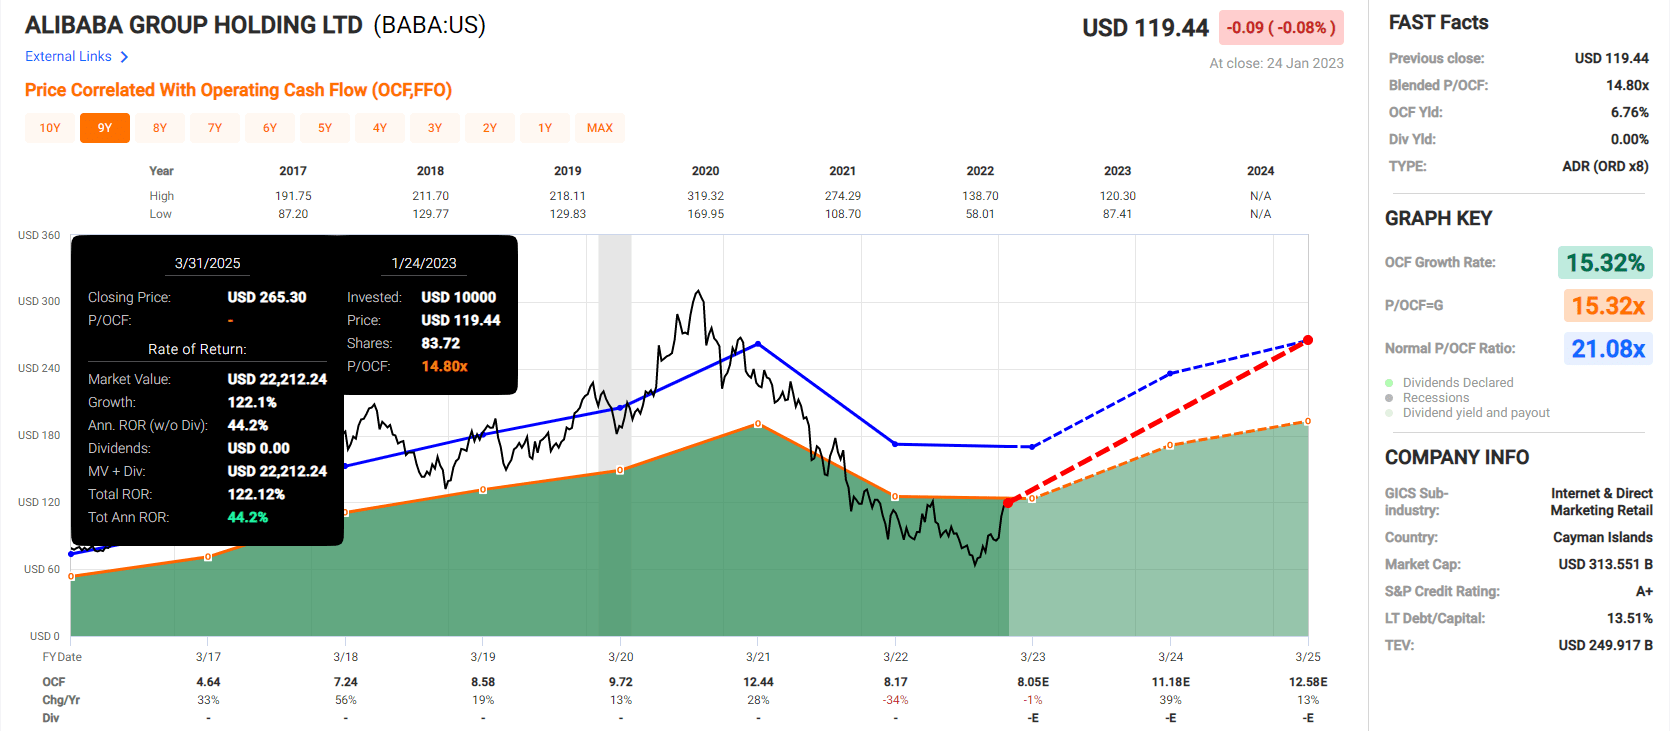
Over the next two years, if BABA grows as expected and returns to historical market-determined fair value, it could deliver 122% returns or 44% annually.
Alibaba 2028 Consensus Total Return Potential
FAST Graphs, FactSet
Over the next two five, if BABA grows as expected and returns to historical market-determined fair value, it could deliver 221% returns or 21% annually.
Let me get this straight. BABA’s crackdown is over, it’s no longer a falling knife, and it’s still so cheap that it could triple our money in 5 years. Sounds like a great time to back up the truck on BABA, right? Not so fast.
4 Reasons Why I Don’t Recommend Buying Alibaba
Here are four reasons why I don’t own BABA and don’t plan to.
One of BABA’s big growth catalysts used to be cloud computing. After all, Amazon Web Services is the core profit driver for Amazon and sports much higher margins than retail can ever achieve.
But guess what the government crackdown killed? Any chance that BABA will become a dominant player in cloud computing.
Statista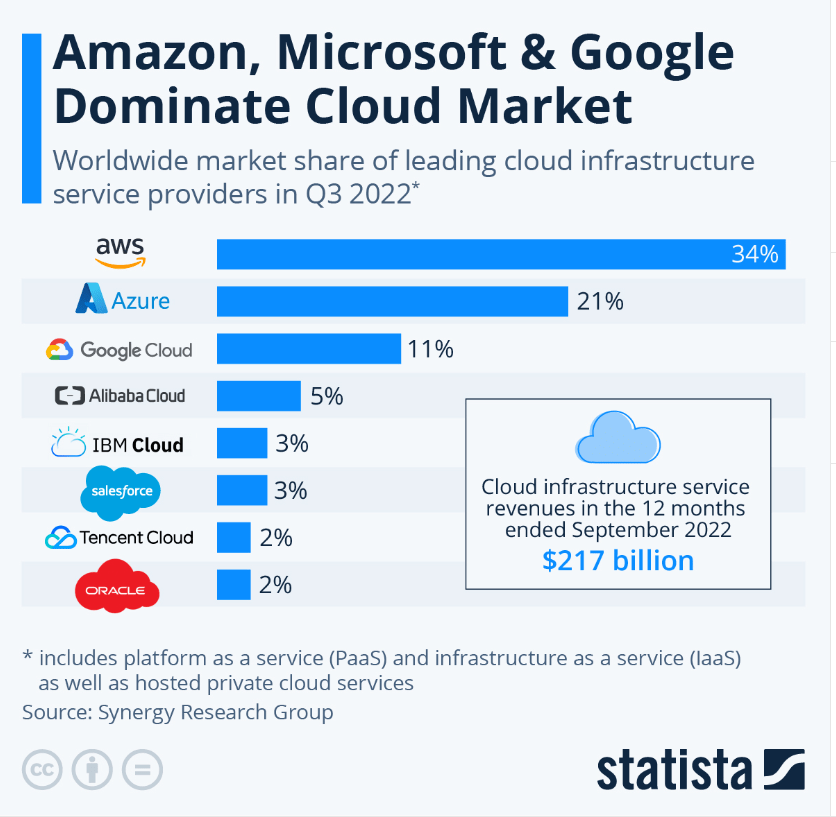
At the end of Q3 2022, BABA had 5% market share in cloud. That’s the 4th best but far behind Google, Microsoft (MSFT), and Amazon.
(Source: FactSet Research Terminal)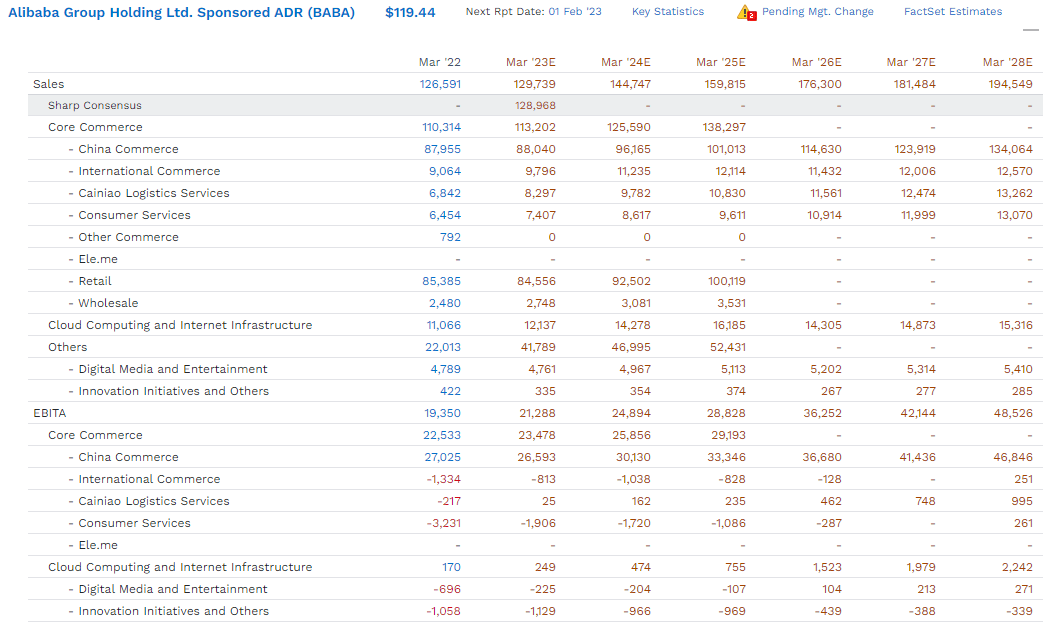
Analysts expect that BABA’s cloud computing sales will grow just 5% annually through 2028.
Grandview Research Estimates the cloud computing industry will grow 16% annually through 2030. So BABA is expected to grow 3X slower than the industry.
Consensus Cloud Computing Growth
| Company | Cloud Computing Sales Growth Through 2028 | Cloud Computing Market Share |
| Amazon | 16.4% | 40.2% |
| Microsoft | 13.4% | 32.0% |
| Alphabet | 18.7% | 14.7% |
| Alibaba | 5.6% | 2.6% |
(Source: FactSet Research Terminal)
By 2027 analysts think Amazon, Microsoft, and Alphabet will control 87% of the global cloud computing market, with BABA a mere rounding error.
How on earth is that possible? Why have BABA’s cloud business growth prospects imploded?
Because 40% of China’s GDP is controlled by state-owned enterprises or SOE.
And guess who has canceled cloud contracts with BABA? Chinese SOEs.
If China’s government is effectively boycotting BABA’s cloud business, who do you think will pick up the slack? Foreign private companies? Do you think JPMorgan will choose BABA cloud over AWS, Google Cloud, or Azure?
If you were a JPMorgan banking customer, would you still bank with them if you knew your financial data was stored overseas by a Chinese company at the mercy of a President Xi?
Do you think non-Chinese healthcare companies will choose BABA over trusted American cloud providers? Will any foreign company risk their corporate and customer data being seized or spied on by the Chinese communist party?
I think not, and neither do analysts. And that’s why BABA’s chance at becoming a global world-beater in cloud is dead. And with it the opportunity to generate superior margins above what retail can provide.
This brings me to the second reason why I won’t buy BABA or recommend it.
Alibaba’s Risk Profile Is Terrible
Anyone considering investing in BABA has to be comfortable with a very complex risk profile.
BABA’s Risk Profile Includes
- VIE regulatory risk
- domestic regulatory/political risk
- highly competitive industries (large and well-capitalized rivals)
- M&A execution risk (VC arm is frequently making investments)
- talent retention risk
- currency risk (as it expands overseas)
- data security risk (hacking threat)
- governance risk
- China debt bubble risk (Chinese Recession could significantly impact BABA’s business)
President Xi has proven he doesn’t respect property rights, and guess what? BABA investors don’t actually have any. BABA operates under the VIE or Variable Interest Entity structure. That means the ADRs don’t own a piece of the company, just an agreement by a Cayman Islands holding company to a piece of BABA’s cash flows.
If the Chinese government were to change its mind about VIEs, then your ADRs trading on the NYSE would instantly be worth nothing.
And if the deal to avoid the US delisting of Chinese ADRs falls apart? Then there will be a mad run for the exits, and US investors in BABA will face ruin.
Don’t Invest In Countries With Dictatorial Governments
Charlie Bilello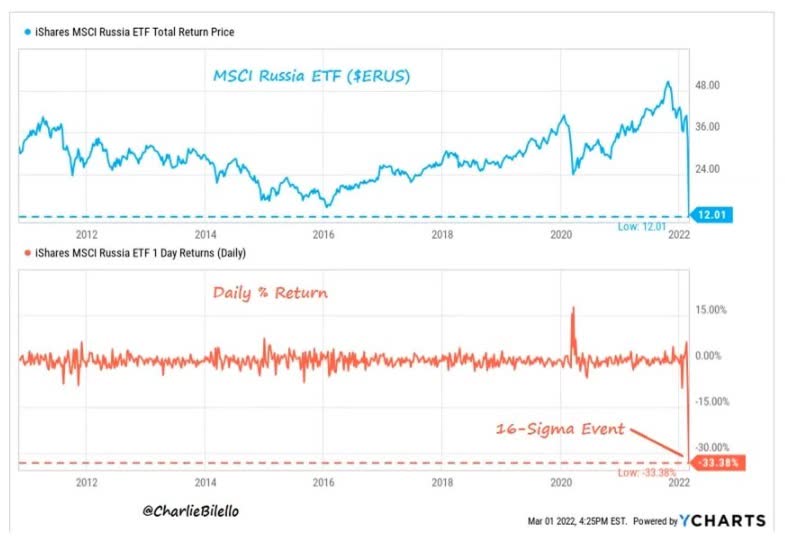
Before the Russian invasion of Ukraine, Russian stocks traded at 4X earnings. Cheaper than BABA at its November lows.
And guess what difference that made when Russia’s “President” Putin decided to do something stupid and crazy? None at all.
Xi has proven that he’s nothing like his predecessors and cares more about ideology than strong economic growth. He’s not interested in Chinese tech giants becoming world-beaters, in fact, he’s actively working to ensure they never become competitive outside of China.
So is BABA’s 14X cash flow or 11X cash-adjusted earnings really a good price given the political risks that BABA will always face? The real risk of losing 100% of your money? I would say not, and here’s why.
Alibaba’s Risk Management Isn’t Very Good
DK uses S&P Global’s global long-term risk-management ratings for our risk rating.
- S&P has spent over 20 years perfecting their risk model
- which is based on over 30 major risk categories, over 130 subcategories, and 1,000 individual metrics
- 50% of metrics are industry specific
- this risk rating has been included in every credit rating for decades
The DK risk rating is based on the global percentile of how a company’s risk management compares to 8,000 S&P-rated companies covering 90% of the world’s market cap.
Alibaba scores 41st Percentile On Global Long-Term Risk Management
S&P’s risk management scores factor in things like:
- supply chain management
- crisis management
- cyber-security
- privacy protection
- efficiency
- R&D efficiency
- innovation management
- labor relations
- talent retention
- worker training/skills improvement
- occupational health & safety
- customer relationship management
- business ethics
- climate strategy adaptation
- sustainable agricultural practices
- corporate governance
- brand management
BABA’s Long-Term Risk Management Is The 379th Best In The Master List 24th Percentile In The Master List)
| Classification | S&P LT Risk-Management Global Percentile |
Risk-Management Interpretation |
Risk-Management Rating |
| BTI, ILMN, SIEGY, SPGI, WM, CI, CSCO, WMB, SAP, CL | 100 | Exceptional (Top 80 companies in the world) | Very Low Risk |
| Strong ESG Stocks | 86 |
Very Good |
Very Low Risk |
| Foreign Dividend Stocks | 77 |
Good, Bordering On Very Good |
Low Risk |
| Ultra SWANs | 74 | Good | Low Risk |
| Dividend Aristocrats | 67 | Above-Average (Bordering On Good) | Low Risk |
| Low Volatility Stocks | 65 | Above-Average | Low Risk |
| Master List average | 61 | Above-Average | Low Risk |
| Dividend Kings | 60 | Above-Average | Low Risk |
| Hyper-Growth stocks | 59 | Average, Bordering On Above-Average | Medium Risk |
| Dividend Champions | 55 | Average | Medium Risk |
| Monthly Dividend Stocks | 41 | Average | Medium Risk |
| Alibaba | 41 | Average, Bordering On Below-Average | Medium Risk |
(Source: DK Research Terminal)
BABA’s risk-management consensus is in the bottom 24% of the world’s best blue chips.
| Rating | Margin Of Safety For High-Risk 9/13 Above-Average Speculative Companies | 2023 Fair Value Price | 2024 Fair Value Price | 12-Month Forward Fair Value |
| Potentially Reasonable Speculative Buy | 0% | $169.69 | $235.67 | $174.77 |
| Potentially Good Buy | 35% | $110.30 | $153.19 | $113.60 |
| Potentially Strong Buy | 45% | $93.33 | $129.62 | $96.12 |
| Potentially Very Strong Buy | 55% | $49.64 | $106.05 | $78.65 |
| Potentially Ultra-Value Buy | 65% | $59.39 | $82.49 | $61.17 |
| Currently | $119.44 | 29.61% | 49.32% | 31.66% |
| Upside To Fair Value (Including Dividends) | 42.07% | 97.32% | 46.32% |
BABA’s large discount isn’t enough to fully compensate for its risk profile, and I wouldn’t buy BABA at any price, and here’s why.
Alibaba’s Long-Term Per Share Growth Is Poor
We just saw how BABA is expected to grow earnings and cash flows at 15% to 26% per year through 2028. So you’d imagine that this means BABA investors can expect similar growth rates on a per-share basis, right?
FactSet Research Terminal
Analysts expect just 8.7% EPS growth out of BABA through 2028.
Guess what you call a non-dividend growth stock growing at single digits? Not a growth stock.
Guess what you call a high-risk ADR with questionable property rights at the mercy of President Xi? A very speculative investment in which I have no interest.
Because of the 4th reason, I’m avoiding Alibaba.
Amazon Is A Safer, More Undervalued, And Better All-Around Alternative To Alibaba
Let me compare and contrast Amazon with Alibaba to show you why Amazon is a much better long-term investment for growth investors.
| Company | Cloud Computing Sales Growth Through 2028 | Cloud Computing Market Share |
| Amazon | 16.4% | 40.2% |
| Microsoft | 13.4% | 32.0% |
| Alphabet | 18.7% | 14.7% |
| Alibaba | 5.6% | 2.6% |
(Source: FactSet Research Terminal)
Unlike BABA, Amazon’s cloud business is growing strongly, and it’s expected to maintain its market share through 2028.
Why does that matter? Because it’s the 2nd most profitable part of Amazon’s business, with 29% operating margins.
- Piper Jaffrey estimates advertising operating margins are 75%
What about future margins? Isn’t the intense competition in cloud cutting into AWS’s profitability?
- 2025 AWS operating margin consensus forecast: 25.7%
It’s expected to reduce AWS profitability a bit, but AWS operating income in 2025 is still expected to be $37 billion, and it’s expected to generate $60 billion in EBITDA for Amazon that year.
So why does a thriving cloud business make such a difference for Amazon? Because AWS is closely linked to advertising. The more data Amazon has, the more its machine learning algorithms can optimize its advertising which some studies indicate is 3X more effective at converting to sales than GOOG’s or Meta’s.
So what does continue dominance in the cloud mean for Amazon?
Amazon Profit Margin Consensus Forecast
| Year | FCF Margin | EBITDA Margin | EBIT (Operating) Margin | Net Margin |
| 2022 | -2.8% | 13.8% | 2.4% | -0.2% |
| 2023 | 3.5% | 14.6% | 3.9% | 3.2% |
| 2024 | 6.8% | 16.1% | 6.1% | 4.9% |
| 2025 | 8.6% | 17.2% | 7.7% | 5.8% |
| 2026 | 11.3% | 19.7% | 9.5% | 7.6% |
| 2027 | 13.6% | 20.9% | 10.9% | 8.9% |
| Annualized Growth 2022-2027 | 40.70% | 8.64% | 35.47% | 29.54% |
(Source: FactSet Research Terminal)
Amazon’s profitability is expected to soar in the coming years. The growth rate of its margins would be something most companies could only dream of.
OK, so what does that mean for its top and bottom line?
Amazon Medium-Term Growth Consensus Forecast
| Year | Sales | Free Cash Flow | EBITDA | EBIT (Operating Income) | Net Income |
| 2022 | $510,594 | -$14,398 | $70,664 | $12,223 | -$1,027 |
| 2023 | $559,852 | $19,367 | $81,579 | $21,863 | $17,772 |
| 2024 | $638,492 | $43,691 | $103,096 | $38,775 | $31,594 |
| 2025 | $719,939 | $62,202 | $124,120 | $55,515 | $41,931 |
| 2026 | $807,828 | $91,029 | $158,845 | $76,500 | $61,676 |
| 2027 | $906,995 | $122,955 | $189,977 | $99,061 | $81,083 |
| Annualized Growth 2022-2027 | 12.18% | 58.73% | 21.87% | 51.97% | 46.15% |
| Cumulative 2022-2027 | $3,633,106 | $339,244 | $657,617 | $291,714 | $234,056 |
(Source: FactSet Research Terminal)
Amazon is expected to grow sales around 2X faster than BABA. How on earth is that possible for a company with over $500 billion in sales?
Because AMZN is a thriving global company and BABA is struggling to grow outside of China. Chinese consumers already spend $1300 per year on average on its site. And Chinese consumers are 5X poorer than American consumers.
There is only so much revenue per user that BABA can squeeze out of its 1 billion users.
But Amazon? Its sales per user have grown steadily over time, except 2022 is lower than 2021’s Pandemic driven record.
- If Amazon’s US customers spent at the same rate as Chinese consumers, its sales per customer would be $3,000 to $7,000 per year
Or, to put it another way, Amazon has a lot more room to sell its users more while BABA doesn’t.
But more important than sales growth is that AMZN’s bottom line is expected to grow at 22% to 50% annually over the coming years. Free cash flow is expected to grow at almost 60% annually to $123 billion.
(Source: FactSet Research Terminal)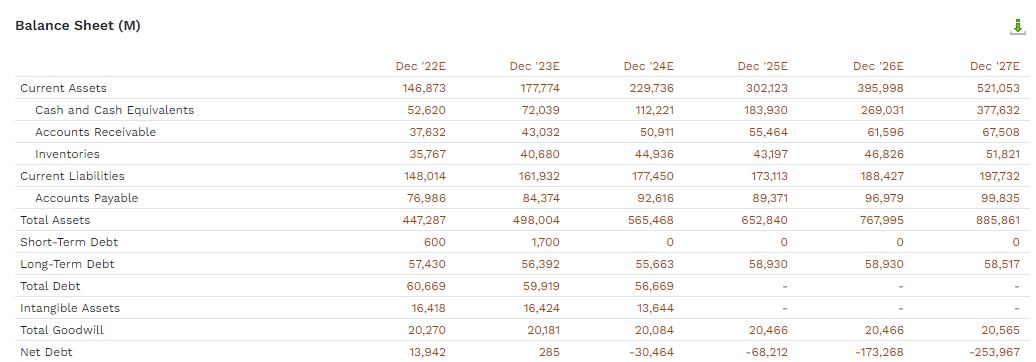
Amazon’s mountain of cash is expected to grow to $378 billion by 2027 and to have $254 billion in net cash.
- What Apple (AAPL) when it began the largest cash return program in history
And even more impressive than $907 billion in 2027 consensus sales and $123 billion in free cash flow? More impressive than $378 billion in cash on the balance sheet? How about the fact that Amazon is expected to achieve all this while spending a fortune on growth.
Yes, even after cost-cutting measures were put in place in 2022 and more are coming in 2023, Amazon is expected to spend X on growth between now and 2027.
Amazon Medium-Term Growth Consensus Forecast
| Year | SG&A (Selling, General, Administrative) | R&D | Capex | Total Growth Spending | Sales | Growth Spending/Sales |
| 2022 | $50,840 | $67,752 | $60,755 | $179,347 | $510,594 | 35.13% |
| 2023 | $54,451 | $74,110 | $59,704 | $188,265 | $559,852 | 33.63% |
| 2024 | $61,102 | $83,372 | $60,801 | $205,275 | $638,492 | 32.15% |
| 2025 | $65,963 | $86,842 | $61,956 | $214,761 | $719,939 | 29.83% |
| 2026 | $71,104 | $95,455 | $62,312 | $228,871 | $807,828 | 28.33% |
| 2027 | $75,844 | $103,275 | $63,118 | $242,237 | $906,995 | 26.71% |
| Annualized Growth | 8.33% | 8.80% | 0.77% | 6.20% | 12.18% | -5.33% |
| Total Spending 2022-2027 | $328,464 | $443,054 | $307,891 | $1,079,409 | $3,633,106 |
(Source: FactSet Research Terminal)
The US government spends $173 billion per year on R&D; by 2027 Amazon is expected to be spending $103 billion.
The government’s infrastructure spending is expected to be $1.25 trillion over the next decade.
Amazon’s capex spending is expected to be $308 billion through 2027 alone.
Analysts expect Amazon to spend $1.1 trillion on growth over the next five years, or an average of over $200 billion.
Yet its growth spending as a share of sales is expected to drop 5% annually, from 35% in 2022 to 27% in 2027.
As long as Amazon can keep growing sales faster than its growth spending, its margins should continue rising steadily.
OK, so that’s very impressive, but didn’t you show with BABA how strong growth doesn’t necessarily lead to strong per-share growth?
(Source: FactSet Research Terminal)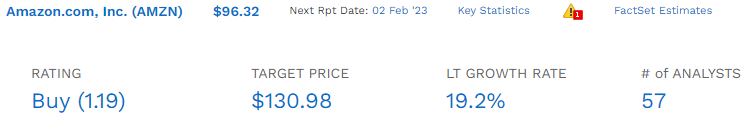
Analysts expect Amazon’s per share growth rate to be 19.2% long-term. That’s the median from all 57 analysts who cover Amazon for a living and combined with rating agencies and bond investors, know this company better than anyone other than Jeff Bezos.
Amazon’s Per Share Medium-Term Growth Consensus Forecast
| Metric | 2022 | 2027 | Annualized Growth Rate |
| EPS | $1.77 (2023) | $7.61 | 44.0% |
| Operating Cash Flow Per Share | $4.60 | $16.49 | 29.1% |
| Free Cash Flow Per Share | $0.88 | $11.68 | 59.8% |
(Source: FactSet Research Terminal)
In the medium-term, Amazon is expected to be one of the fastest-growing companies on earth, and that’s with effectively no buybacks to speak of.
Ok, so here’s the bottom line for long-term growth investors.
Amazon Is A Much Better Growth Stock Than Alibaba
| Investment Strategy | Yield | LT Consensus Growth | LT Consensus Total Return Potential |
| Amazon | 0.0% | 19.2% | 19.2% |
| ZEUS Income Growth (My family hedge fund) | 4.1% | 8.5% | 12.6% |
| Schwab US Dividend Equity ETF | 3.4% | 8.6% | 12.0% |
| Vanguard Dividend Appreciation ETF | 1.9% | 10.0% | 11.9% |
| Nasdaq | 0.8% | 10.9% | 11.7% |
| Dividend Aristocrats | 1.9% | 8.5% | 10.4% |
| S&P 500 | 1.7% | 8.5% | 10.2% |
| REITs | 3.9% | 6.1% | 10.0% |
| Alibaba | 0.0% | 8.7% | 8.7% |
| 60/40 Retirement Portfolio | 2.1% | 5.1% | 7.2% |
(Source: DK Research Terminal, FactSet, Morningstar)
Over the long-term, do you know what analysts think is a better investment than Alibaba? Just about everything.
Buy the S&P, and you’ll likely beat BABA if it grows as expected. The aristocrats and dividend growth blue-chips and high-yield blue-chips should beat it as well.
What do analysts think is a better investment than Amazon? Almost nothing with rare exceptions like Lowe’s (LOW), and Mastercard (MA).
But do you know how many AA-rated companies are expected to beat Amazon? None.
- MA is rated A+
- LOW BBB+
- BABA A+
Ok, so Amazon has far superior growth prospects, a much faster growth rate, and a stronger and safer balance sheet than BABA.
What about its risk profile?
Amazon Has A Safer Risk Profile And Better Risk Management Than Alibaba
No company is risk-free, and that includes Amazon.
AMZN’s Risk Profile Includes
- inherent cyclicality of retail with the economy
- disruption risk (nearly 1,000 major competitors globally), including MSFT Meta, and GOOG in its most important businesses
- political/regulatory risk – anti-trust risk domestically and globally
- global expansion risk (not as easy to disrupt foreign markets with entrenched giants)
- new market penetration risk: healthcare, especially, is a very highly regulated and challenging industry to disrupt
- M&A execution risk
- labor retention risk (tightest job market in over 50 years, and tech is a high-paying industry)
- Labor relations risk: the introduction of unions could increase labor expenses by approximately $150 million per 1% of the workforce (up to $15 billion per year)
- cybersecurity risk: hackers and ransomware
- currency risk: almost 40% of sales are from outside the US
How good is Amazon at managing these and all its other risks?
Amazon is the 224th Best Company At Managing Risk On The Master List (55th Percentile)
| Classification | S&P LT Risk-Management Global Percentile |
Risk-Management Interpretation |
Risk-Management Rating |
| BTI, ILMN, SIEGY, SPGI, WM, CI, CSCO, WMB, SAP, CL | 100 | Exceptional (Top 80 companies in the world) | Very Low Risk |
| Strong ESG Stocks | 86 |
Very Good |
Very Low Risk |
| Foreign Dividend Stocks | 77 |
Good, Bordering On Very Good |
Low Risk |
| Ultra SWANs | 74 | Good | Low Risk |
| Amazon | 68 | Good | Low Risk |
| Dividend Aristocrats | 67 | Above-Average (Bordering On Good) | Low Risk |
| Low Volatility Stocks | 65 | Above-Average | Low Risk |
| Master List average | 61 | Above-Average | Low Risk |
| Dividend Kings | 60 | Above-Average | Low Risk |
| Hyper-Growth stocks | 59 | Average, Bordering On Above-Average | Medium Risk |
| Dividend Champions | 55 | Average | Medium Risk |
| Monthly Dividend Stocks | 41 | Average | Medium Risk |
| Alibaba | 41 | Average, Bordering On Below-Average | Medium Risk |
(Source: DK Research Terminal)
Amazon’s risk management is far superior to Alibaba’s, according to S&P.
So with Amazon, we have:
- faster growth
- stronger balance sheet
- better risk management
Now what if I told you, you could get all this amazing Ultra SWAN hyper-growth goodness at an even better discount than Alibaba?
Amazon Is The Best Coiled Spring On Wall Street
| Metric | Historical Fair Value Multiples (14-Years) | 2022 | 2023 | 2024 | 2025 | 2025 |
12-Month Forward Fair Value |
| Operating Cash Flow | 25.98 | $123.66 | $204.46 | $273.57 | $293.31 | $368.66 | |
| Average | $123.66 | $204.46 | $273.57 | $293.31 | $368.66 | $209.78 | |
| Current Price | $92.51 | ||||||
|
Discount To Fair Value |
25.19% | 54.75% | 66.18% | 68.46% | 74.91% | 55.90% | |
| Upside To Fair Value | 33.68% | 121.02% | 195.72% | 217.06% | 298.50% | 126.76% | |
| 2023 OCF | 2024 OCF | 2023 Weighted OCF | 2024 Weighted OCF | 12-Month Forward OCF | 12-Month Average Fair Value Forward P/OCF | Current Forward P/OCF |
Current Forward Cash-Adjusted PE |
| $7.87 | $10.53 | $7.26 | $0.81 | $8.07 | 26.0 | 11.5 | 13.0 |
Amazon is trading at 11.5X cash flow and 13X cash-adjusted earnings.
That’s a 56% historical discount with a 127% upside to fair value.
In other words, AMZN is such a coiled spring deep value Buffett-style “fat pitch” that it could double and still be a good buy.
Amazon 2025 Consensus Total Return Potential
(Source: FAST Graphs, FactSet)
BABA could deliver 220% returns over five years, while AMZN could deliver 230% returns in just two.
That’s 50% annualized consensus return potential for AMZN. Thinks I’m joking? Just look at the chart!
- If AMZN grows as expected and returns to historical fair value, it WILL deliver a 230% return by 2025
- not opinion, mathematical fact
Amazon 2028 Consensus Total Return Potential
(Source: FAST Graphs, FactSet)
If AMZN grows as expected and returns to historical fair value, it WILL deliver a 424% return by 2028, a 5.25X return.
- almost 2X the return POTENTIAL of Alibaba
- 8X more return POTENTIAL than the S&P
Lower risk, better valuation, faster growth, and almost double the return potential for Alibaba.
Bottom Line: Both Alibaba And Amazon Could Make You Money, But Only One Can Change Your Life
Let me be clear: I’m NOT calling the bottom in AMZN or BABA (I’m not a market-timer).
Ultra SWAN quality for AMZN does NOT mean “can’t fall hard and fast in a bear market.”
- quality has no connection to volatility
- neither does safety
Fundamentals are all that determine safety and quality, and my recommendations.
- over 30+ years, 97% of stock returns are a function of pure fundamentals, not luck
- in the short term; luck is 25X as powerful as fundamentals
- in the long term, fundamentals are 33X as powerful as luck
While I can’t predict the market in the short term, here’s what I can tell you about AMZN and BABA.
Alibaba’s growth outlook has improved in the medium-term thanks to the government saying the crackdown is essentially over. And COVID-zero ending is expected to boost China’s economy this year.
But long-term the new tighter government regulations on BABA and its fellow Chinese tech titans appear to have permanently impaired their growth outlooks.
While Chinese stocks were trading at dirt-cheap valuations in November, and are still undervalued today, their risk profile is far worse than any big tech giant in the US.
A 32% discount on BABA makes it a potentially reasonable speculative buy that could double in two years and triple in five.
So yes, if you buy BABA today, you can potentially make a lot of money.
But Amazon is a higher quality company, confirmed by its stronger AA-credit rating and superior risk management rating from S&P.
It’s growing sales 2X as fast as BABA and growing cash flows 3X to 4X faster.
And it’s trading at 11.5X cash flow and 13X cash-adjusted earnings, a 56% historical discount.
That’s the best valuation Amazon has ever had. Let me repeat that. Amazon wasn’t this undervalued in the Pandemic crash, or the Great Recession, or even the tech crash of 2000!
There has literally never been a better time to buy Amazon, which is expected to grow free cash flow at 60% per year through 2027.
Amazon’s consensus total return potential through 2025 is 230%, a more than triple.
If it grows as expected and returns to historical fair value in the next five years, it’s a potential 5.3X return.
Why pay a higher cash flow multiple for a riskier company with worse growth prospects? The only reason I can think of is if you’re a short-term trader who likes BABA’s superior short-term charts.
But if you’re a long-term investor, not a momentum-chasing trader, the decision is clear. Amazon is the far better-coiled spring growth stock and the best Ultra SWAN deal on Wall Street.
That’s why I’ve been buying it steadily in recent weeks, including with limits that got me shares as cheap as $82 (a 60% discount).
What if Amazon falls more? It very well could. It’s historically 60% more volatile than the S&P and the market could drop 10% to 20% before this bear market bottoms.
But do you know what I’ll be doing if that happens? Loading up on even more Amazon.
Because while stock prices are a crap shoot in the short-term, in the long-term they are fundamentals-driven destiny.
And Amazon’s fundamentals, according to 57 analysts, 3 rating agencies, and the bond market, aren’t just intact; they are downright spectacular.
Be the first to comment