

Justin Sullivan/Getty Images News
Overview
More than any of the other big-tech MAAMAs (Microsoft, Alphabet, Amazon, Meta, and Apple), Amazon.com, Inc. (NASDAQ:AMZN) has applied its competency in data analytics to bridge the digital world of electrons and physical world of molecules, and it has built a dominant lead in both the global retail and cloud infrastructure sectors.
As it has been almost a year since I last wrote about Amazon, I decided it is time to review the key elements of my investment thesis:
|
My thesis and thinking |
Comments and elaboration |
|
1. Amazon has leveraged the growth of the internet and its competency in data analytic to become a global leader in both the retail and cloud computing sectors |
Amazon has greatly benefited from network effects and the law of increasing (rather than diminishing) returns. Despite its size today, it is (to use CEO Andy Jassey’s words) “early days” for Amazon |
|
2. Amazon’s retail business has continued to grow due to the consumer shift from offline to online purchases, growth in its 3rd party sales platform, and an enlarged addressable market created from the build-out of its next day delivery capabilities |
Amazon has continued to outgrow mainstream retailers. Its gross merchandise value has caught up with Walmart’s Amazon’s retail profitability is depressed as the company spent aggressively on long-term growth initiatives, headcount, and expanding its logistics supply chain of warehouses, distribution centers, and delivery capabilities. However, its competitive moat has widened significantly as a result of these investments |
|
3. International retail has reached a point of inflection to profitability, but the company continues to invest heavily for the future. |
International profitability also declined as the company spent aggressively on growth, which once again, shows that the company is willing to sacrifice current earnings for long-term returns |
|
4. Amazon’s advertising business leverages its massive data set on customers to increase the effectiveness of ads |
Amazon’s advertising business has grown rapidly in the US and it is well-positioned to expand into international markets and enter new markets |
|
5. Amazon Web Service has continued to stay ahead of Microsoft (MSFT) and Alphabet’s (GOOG, GOOGL) cloud businesses |
Amazon’s aggressive R&D spending will enable it to maintain or grow its industry leadership |
Amazon’s short term operating income has pulled back as it stepped up spending on R&D, capital expenditures in data centers and logistics, and employee headcount. While some may argue that the company has gotten ahead of itself, I believe these investments will further widen Amazon’s competitive moats and lead to powerful cash flow generation over the long term.
Leader in retail and cloud computing
In my August 22, 2022 article that compared the business models of Costco vs Walmart, I wrote:
“Costco (COST) attracts customers by selling high-quality products at extremely low mark-ups [compared to mainstream retailers such as Walmart (WMT) and Target (TGT)] but makes up for the razor-thin margins by selling products in larger quantities (e.g., coffee in 4-pound bags, pencils by the two-dozen, and flour in 25-pound sacks), in effect offering customers a volume discount to buy in bulk. In doing so, it attracts more affluent customers who have sufficient “working capital” for the additional “inventory” while they work their way through their purchases and reduces the number of visits a customer makes.
I also noted that Costco’s strategy of maintaining a narrower selection of merchandise and brands enables it to hold less inventory in its warehouse stores compared to other general retailers, while its requirement that customers purchase annual memberships drives customer return visits.
Unlike Costco, Amazon is able to offer limitless product choices in its web-based stores where costs are very low and open 24 hours a day/365 days a year to anyone with an internet connection, and it keeps costs down by storing its (and third-party sellers’) inventory in warehouses located in lower-cost areas. It is able to deliver products both in smaller quantities (unlike Costco) AND at lower markups than Walmart or Target through its highly efficient logistics supply chain and dense last-mile delivery routes.
Amazon has taken a page from Costco’s membership model–it too drives customer return visits by offering customers who sign up for its Prime membership with free shipping, video, music, and other incentives. The number of Amazon Prime members has increased eight-fold since 2014, and now stands at 200 million worldwide (figure 1), 60% more than the 119 million Costco cardholders (figure 2). About 160 million Prime members are based in the U.S, which Statista estimates represents 76.6 million households, or about 60% of the 128 million households in the U.S.
Figure 1: Amazon prime members
Created by author using publicly disclosed financial data
Figure 2: Costco paid members and cardholders
Costco SEC 10K filing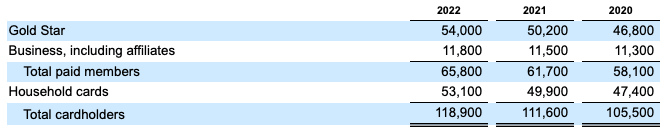
(Note: Costco’s fiscal year ends in August)
Compared to other leading traditional and online retailers
Amazon (figure 3 orange line) has significantly higher revenues than two of the other large retailers–Target, and Cost. While the company reports lower revenue than Walmart, its gross merchandise value is much higher and comparable to Walmart’s because it only books the fees it charges third party sellers that sell on its platform (I will discuss this below). Amazon also has significantly higher revenue than Alibaba (BABA) and JD.com (JD)– the two leading Chinese online retail platforms.
Figure 3: Revenues: Amazon vs retail peers
Seeking Alpha
Over the last five years, Amazon (figure 4, orange line) has grown faster than all its retail peers apart from Alibaba (blue line). However, I have not focused on Alibaba as I do not fully understand the country’s governance or the legal structures of Chinese ADRs (American Depository Receipts).
Figure 4: Revenue growth (indexed): Amazon vs retail peers
Seeking Alpha
Compared to the big tech “MAAMAs”
Over the last five years, Amazon has grown faster than all the big tech MAAMAs other than Meta (figure 5, orange vs blue line).
Figure 5: Revenue growth (5-years, indexed): Amazon vs the MAAMAs
Seeking Alpha
Despite a higher historical growth rate and lower valuation, Meta’s growth rate is slowing down (figure 6, blue line) and the company is complicated to analyze as it re-invents as a metaverse company. As a believer in Peter Lynch’s approach of investing only in what I understand, I have decided to put Meta in the “too hard” pile for now.
Figure 6: Revenue growth (2-1/2 years, indexed): Amazon vs the MAAMAs
Seeking Alpha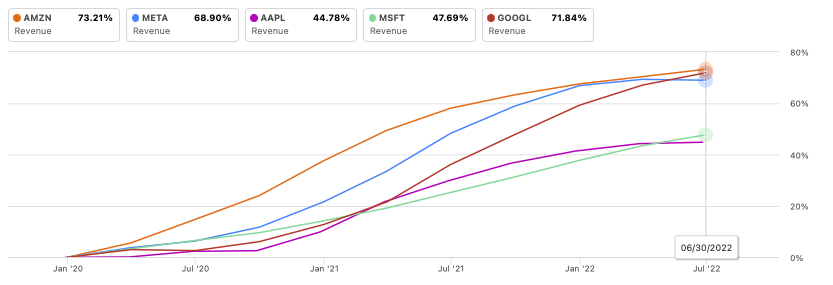
As Amazon grows in size, it is well-positioned to benefit from the network effect and economies of increasing scale that large tech companies enjoy. I will not rehash these points that I have already made in my previous article, but will simply re-emphasize that the value of the customer data it owns grows exponential with size but the incremental cost to apply this massive dataset into additional applications (e.g., advertising) is very low.
Segment and country analysis
Even though the above comparison of Amazon’s revenue and growth to other leading retailers and big tech companies gives us an intuitive sense of its scale, it is important to analyze each of its segments on a standalone basis to understand the company’s competitive positioning and longer term prospects.
Revenue by segment
Amazon’s revenue, which has almost quadrupled since 2016 (figure 7, grey dotted line), was driven by growth in all its segments. Revenues from online sales of Amazon’s own inventory is the largest segment, followed by revenues from third-party seller fees and Amazon Web Services (red, pink, and blue lines). (The “Other” segment (purple line) dropped in Q2 2022 when Amazon separated out Advertising (orange line)).
Figure 7: Amazon revenues, by segment
Created by author using publicly disclosed financial data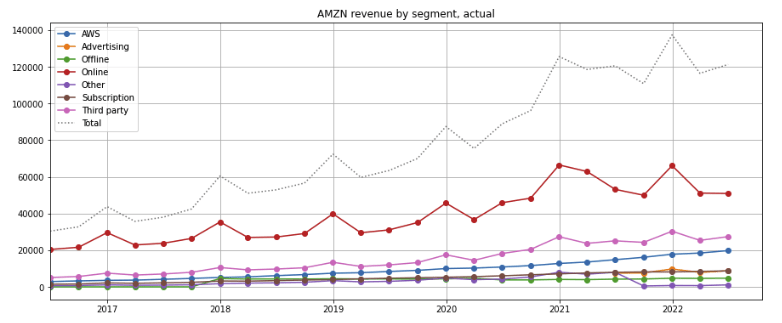
Over the last year, AWS has been the highest grower (figure 8, blue line), followed by advertising (orange line). Online and third party retail sales year-over-year growth has slowed following the strong growth in 2020-2021 that was driven by the accelerated online shift due to the COVID-19 outbreak (red and brown lines).
Figure 8: Amazon segment revenue growth (one-year, indexed)
Created by author using publicly disclosed financial data
The company’s online retail revenue (i.e., excluding revenues from third parties who sell their products on Amazon’s platform) as a percentage of total revenue has fallen below 50% (figure 9, red line) as Amazon Web Services (AWS), advertising, third party, and subscription revenues grew faster.
Figure 9: Amazon segment revenues, as percentage of total revenues
Created by author using publicly disclosed financial data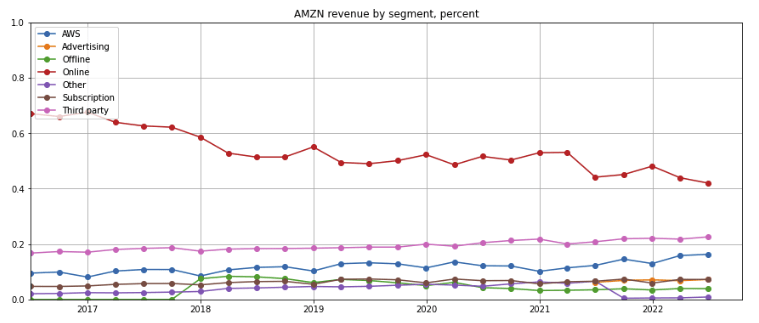
Revenues by country
The U.S. constitutes over 60% of revenues (figure 10, purple line). Other major countries–Germany, the United Kingdom, and Japan–each generate less than 8%, while the Rest of World, which includes India, accounts for about 12% of total revenues
Figure 10: Revenue % breakdown, by country
Created by author using publicly disclosed financial data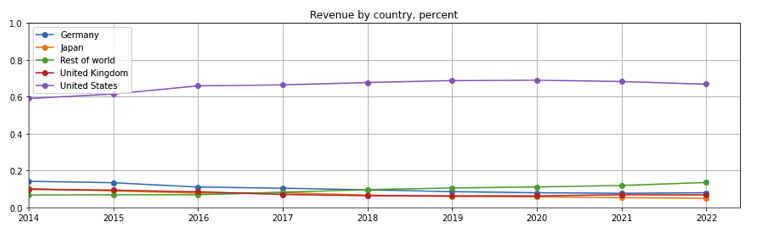
Widening moat from scale and aggressive investments
Even though Amazon’s consolidated revenue is less than Walmart’s (figure 3 above), my estimates of the company’s total gross merchandise volume (GMV), including the value of products sold by third party sellers on Amazon’s platform (figure 11, solid blue line) has grown faster than other big retailers and caught up with Walmart (dashed orange line).
Figure 11: Amazon GMV vs big retailers
Created by author using publicly disclosed financial data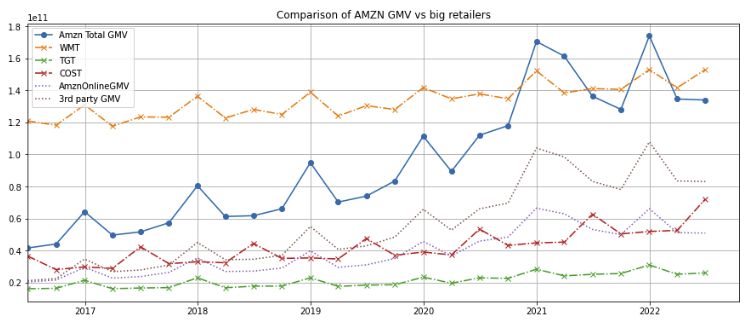
Note: I estimated Amazon’s total online sales GMV by dividing its online GMV by (1 – 3rd party sales as percentage of total retail sales). 3rd party sales as a percentage of total retail sales data is provided in the company’s disclosures.
Statista estimates worldwide retail e-commerce sales at $8.1 trillion, of which Amazon’s estimated global GMV of $570 billion accounts for 7% share of the global e-commerce market. The US Census Bureau reports US e-commerce retail sales data of ~$ 1 trillion for the 4 quarters ending Q2 2022, of which Insider Intelligence estimates Amazon’s US retail share at 39.5%. At about one-eighth the size of Amazon’s, Walmart’s global e-commerce revenue of ~$73 billion trails Amazon by a long shot.
Even though Amazon already has a very large share of the U.S. retail market, its U.S. revenues (figure 12, purple line, which includes AWS and other non-retail segments) continues to grow faster than its international markets.
Figure 12: Revenue growth by country, indexed to 2014
Created by author using publicly disclosed financial data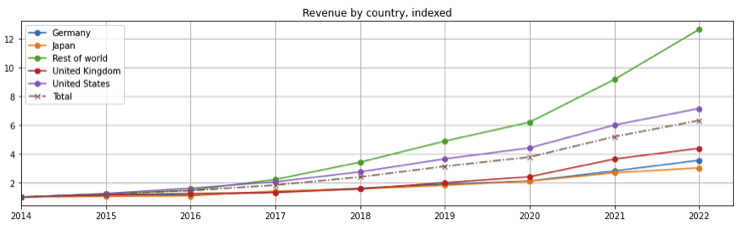
Revenues as a percent of GDP
In 2021, Amazon’s U.S. revenues represent about 1.3% of the country’s GDP (figure 13, red line), higher than the ~1.0%, ~0.9%, and 0.47% in the United Kingdom, Germany, and Japan (green, blue, and orange lines), suggesting that, certis paribus, there is still more room for growth in its international markets.
Figure 13: Amazon sales to GDP by country
Created by author using publicly disclosed financial data
Capital expenditures and facilities vs logistics leaders
To reduce its reliance on third party shippers and expand its next-day delivery capabilities, Amazon has invested aggressively to build out its own in-house logistics and shipping capabilities. Over the last two years, it has out-spent the two leading logistics companies–United Parcel Service (UPS) and FedEx (FDX)–on capital expenditures by approximately four times (figure 14, blue solid line vs orange dashed and green dotted lines). As it builds out its own logistics and shipping capabilities, I expect that Amazon’s scale and higher route density will drive down delivery costs, widen its moat and lead against e-commerce challengers, and put third party sellers who do not utilize its platform at a disadvantage.
Figure 14: Amazon’s capital expenditures on fulfillment, distribution center, and transportation
Created by author using publicly disclosed financial data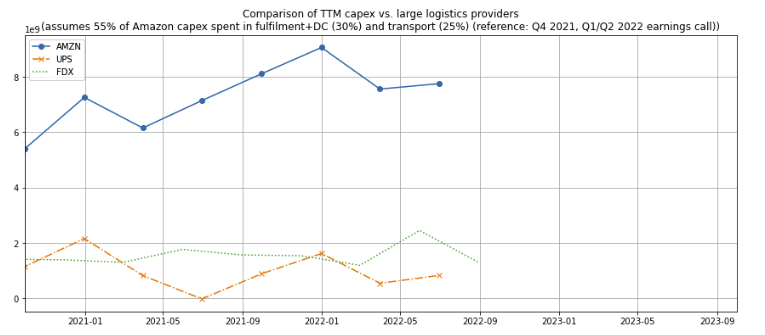
Amazon currently has over 500 million square feet of facility space (figure 15), more than three times that of UPS’s ca. 146 million square feet and Fedex’s ca. 150 million square feet (this excludes Fedex’s Office segment which provides print and graphic services). Even though Amazon does not break down the space between datacenters and logistics facilities, I think it is safe to assume that it has pulled far ahead of its two largest logistics competitors, both of which will struggle to play catchup.
Figure 15: Amazon total square feet of data center, warehouse, and distribution center space
Created by author using publicly disclosed financial data
New services to third party sellers
Amazon continues to expand its shopping offerings. In April 2022, Amazon announced Buy With Prime, a service that enables its third party sellers to manage the check-out and delivery of purchases made on their own websites using Amazon Pay and Amazon’s fulfillment network. More recently, it introduced the ability for sellers to create their own storefront on Amazon and direct Amazon shoppers to their own website. This benefits both third party merchants and their customers, but could take share from Shopify (SHOP) and other platforms that do not offer a fulfillment network that can compete with Amazon’s.
Leading Cloud Service Provider
Revenues of Amazon Web Service is similar in size to Microsoft’s Intelligent Cloud and significantly larger than Google Cloud (figure 16, blue, orange, and green lines). However, Microsoft’s Intelligent Cloud segment includes revenues from Windows Server, SQLserver, Visual Studio products, and other businesses in addition to Azure Cloud and is thus not directly comparable with AWS or Google Cloud revenues.
Figure 16: Cloud infrastructure revenues of big 3 providers
Created by author using publicly disclosed financial data
Gartner (IT) rates AWS the leader among the cloud infrastructure players on both vision and ability to execute (figure 17), and cites AWS as the innovation leader that “often sets the pace in the market for innovation, which guides the roadmaps of other CIPS [cloud infrastructure platform service] providers.” Gartner noted that Azure has the “broadest sets of capabilities” but expressed concern about the resiliency of the offering.
Figure 17: Gartner magic quadrant for cloud infrastructure and platform services
Gartner Group
According to Computer Reseller Network, the top five top cloud infrastructure players jointly own 75% of the overall market. As of Q2 2022, AWS has a 34% share of the cloud infrastructure market, followed by Microsoft Azure at 21% and Google Cloud at 10% (figure 18). Over the last two years, the market share of the top three players have ticked up, Alibaba Cloud held steady at 5%, while IBM spin-out Kyndryl ticked down to 4%.
Figure 18: Top 5 infrastructure cloud providers
|
Q2 2022 |
Q2 2021 |
Q2 2020 |
|
|
AWS |
34% |
33% |
33% |
|
Microsoft Azure |
21% |
19% |
17% |
|
Google Cloud |
10% |
9% |
8% |
|
Alibaba (mainly China) |
5% |
5% |
5% |
|
Kyndryl (formerly IBM) |
4% |
4% |
5% |
Source: publicly disclosed financial data
The top three players have gained share because of their ability to invest more in R&D and larger data centers that are closer to the end-users. In the last year, Amazon spent almost $60 billion on R&D, nearly twice that of Google and Microsoft (figure 19, purple, blue and red line). Not surprisingly, AWS has greater depth compared to Azure and Google Cloud. Given its continued heavy R&D spending, I expect Amazon to maintain or extend its lead.
Figure 19: Amazon R&D vs peers
Created by author using publicly disclosed financial data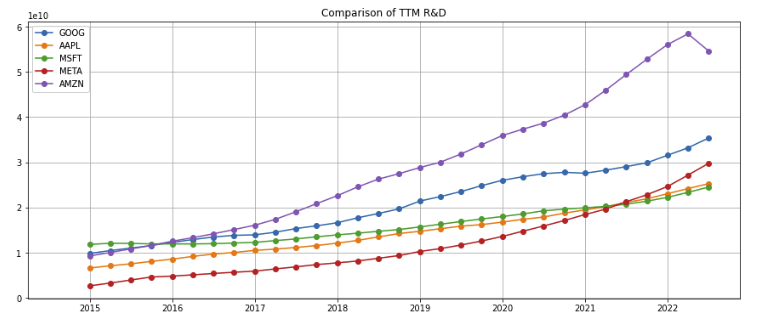
Amazon’s AWS capital expenditures (i.e., excluding the company’s retail logistics and transportation spending) is roughly in line with the overall capital expenditures of Google and Microsoft (figure 20, blue, orange, and purple lines)
Figure 20: Amazon Web Services capital expenditures vs peers
Created by author using publicly disclosed financial data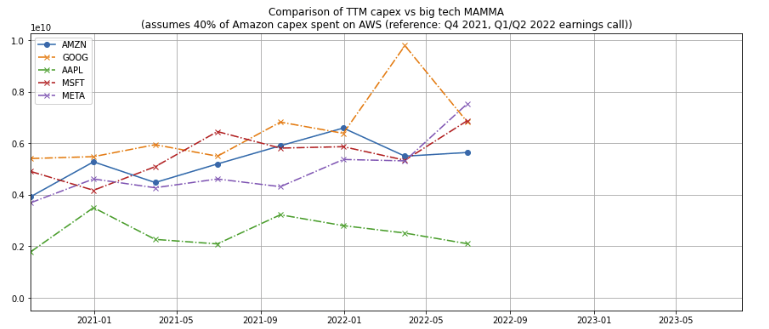
Advertising has a long runway
Since Amazon began breaking advertising as a separate reporting line item in Q2 2021, it has grown faster than all segments other than AWS (see figure 8 above). Management noted on its Q2 2022 earnings call that while the majority of advertising revenue is in North America, the company is making inroads into the international markets and expanding the array of advertising products from its consumer websites into video opportunities, e.g., its Prime Video, Thursday Night Football programing, FireTV, Freevee channels, Twitch, Amazon Music, among other areas.
Amazon is able draw upon and apply deep learning algorithms to its large treasure trove of consumer data, which includes both their completed transactions as well as purchase intentions based on customer searches, to optimize and measure the effectiveness of the ads it sells. I would be surprised and disappointed if Amazon does not find additional geographies, channels, and markets to drive strong growth in its advertising segment.
Margins declining due to aggressive investment spending
Amazon’s EBITDA has grown almost 2,000% over the last 20 years (figure 21, red line). However, its has declined by 11% over the last 2 quarters (figure 22, orange line)
Figure 21: Amazon 10-year EBITDA vs peers
Seeking Alpha
Figure 22: Amazon EBITDA growth over the last two quarters vs peers
Seeking Alpha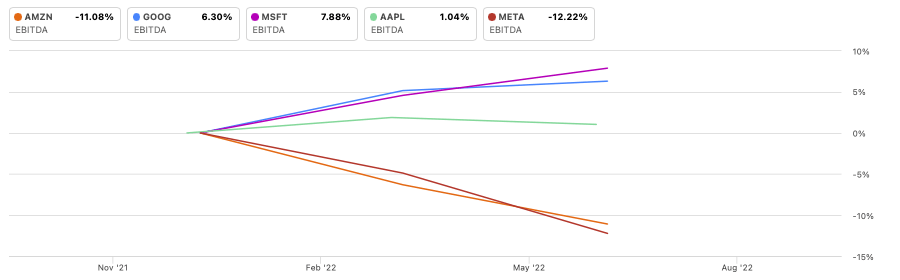
AWS’s operating margin has consistently remained high at around 30% (figure 23, blue line). In contrast, the operating margins for Amazon’s North America and International segments, which grew as customers shifted their purchases online following the COVID-19 outbreak, both started to decline beginning in the second half of 2021. Amazon’s North American operating margins were in line with Costco’s for the seven years prior to 2021 (green solid line vs red dashed line) but began to turn down in Q2 2021.
Figure 23: Amazon segment operating margins vs Costco
Created by author using publicly disclosed financial data
Amazon’s gross margin did not compress but expanded over the last 6 quarters (figure 24, orange line). This indicates that margin pressure took place at the SG&A level, in large part due to the company’s increased spending on long-term investments–a strategy that is consistent with founder Jeff Bezos’ stated philosophy of putting long term cash flow returns ahead of short-term profits.
Figure 24: Amazon and retailer peers gross margins
Seeking Alpha
Since the onset of the COVID-19 pandemic, Amazon has significantly stepped up its R&D spending, headcount, and capital expenditures, which has indeed cut into near term profitability.
R&D spending
As illustrated in figure 19 above, Amazon spent $60 billion in R&D for the twelve-months ended March 2022, $25 billion more than Alphabet and more than twice Meta, Apple, and Microsoft’s R&D spend. If Amazon’s spending were closer to its big tech peers, the company’s operating income would certainly be significantly higher.
Amazon does not disclose its R&D pipeline and projects for competitive reasons. Although not without risk, given Amazon’s track record (e.g., in Alexa), I expect its R&D spending to produce attractive returns over the long term.
Headcount growth
Amazon’s headcount doubled from 800,000 before the COVID-19 outbreak to 1.6 million just two years later (figure 25). The company does not disclose its total salary expense, but I note that the trailing twelve-month total share compensation for the period more than doubled, from which I posit that the hires are not limited to relatively lower-compensated, part-time warehouse and delivery workers.
Figure 25: Amazon employee count (part-time and full-time)
Created by author using publicly disclosed financial data
Revenue per employee has trended down by about 15% since Q4 2020 (figure 26), which corroborates recent news reports that the company has over-staffed itself. The company trimmed employee count by 100,000 in Q2 2022 (figure 25 above), and may have incurred higher expenses from severance pay.
Figure 26: Amazon revenue per part-time or full-time employee
Created by author using publicly disclosed financial data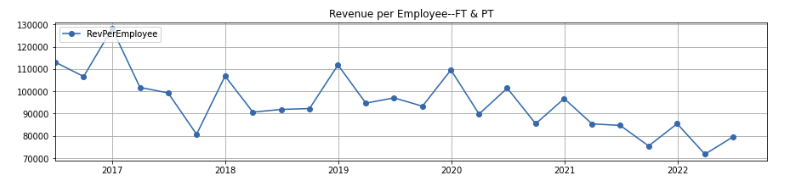
Capital spending
The revenue per square-foot of data center, warehouse, and distribution center space dipped by almost 20% (figure 27) as the company built facilities ahead of sales growth in both North American and International markets (figure 28).
Figure 27: Amazon revenue per square-foot of data center, warehouse, and distribution center space
Created by author using publicly disclosed financial data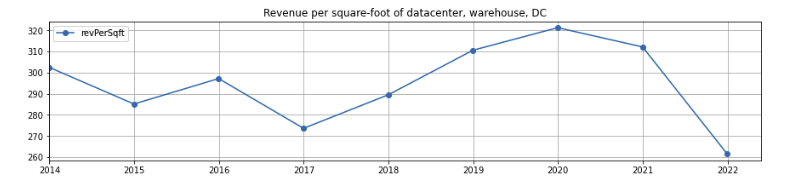
Figure 28: Growth in sales (solid lines) vs square footage of data center, warehouse, and distribution centers (dashed lines)
Created by author using publicly disclosed financial data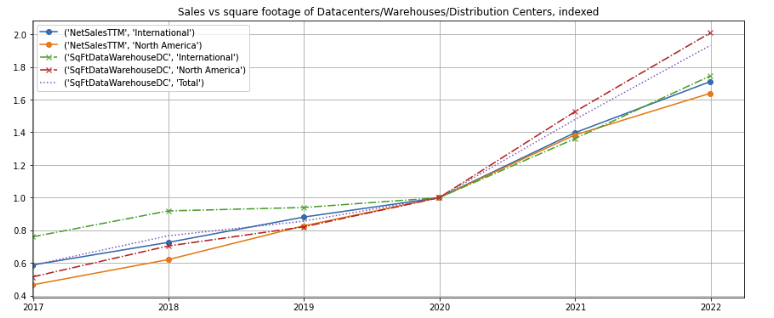
Amazon’s aggressive R&D spending, hiring, and facility expansion has cut into short term earnings. However, based on the company’s past history and track record, I believe the R&D spending will yield fruit over the long term. Even though Amazon’s growth spending may have gotten somewhat ahead of its skis at this time, it is a matter of time before it grows into the higher headcount and expanded facilities. If the company were to cut back its growth, R&D, and new investment spending over the next 1-2 years, earnings could rebound sharply.
Valuation
Amazon’s free cash flow yield has dropped sharply over the last 6 quarters because of its high costs on headcount, R&D, and capital expenditures (figure 29, blue line). As capital expenditures are amortized over time for the computation of net income, its earnings yield has not ticked down as sharply (orange dashed line).
Figure 29: Amazon valuations
Created by author using publicly disclosed financial and stock price data
Amazon’s free cash flow and earnings yields are the lowest amongst the big tech MAAMAs (figures 30 and 31). The stock is certainly not cheap at these valuations. However, after factoring in its elevated spending on R&D, capex, and headcount, the “normalized” valuation appears relatively attractive.
Figure 30: Amazon free cash flow yield compared to the big tech “MAAMA”s
Created by author using publicly disclosed financial and stock price data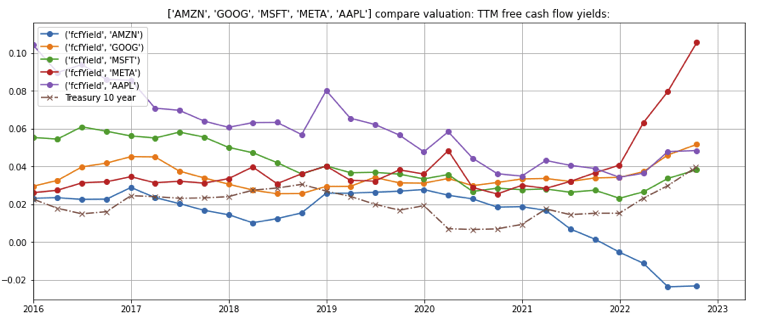
Figure 31: Amazon earnings yield compared to the big tech “MAAMA”s
Created by author using publicly disclosed financial and stock price data
Concerns
My main concerns are:
1. Will Amazon’s revenue growth slow down or even turn negative?
Near term year-over-year growth will likely slow in light of: (1) difficult 2020-2021 comparisons due to the accelerated shift towards online shopping following the COVID-19 outbreak, and (2) the economic slowdown resulting from the Federal Reserve’s rate hikes. However, I believe Amazon will continue to grow over the long term with secular cloud and e-commerce growth, as it increases penetration in international markets, expands into adjacent markets, and leverages its data and analytics to create more value for customers.
2. Will Amazon continue to invest overly aggressively?
It is almost a certainty that Amazon will invest aggressively in line with founder and Chairman Jeff Bezo’s articulated philosophy of investing for the long term and sacrificing near-term profits for long term returns. Even though Amazon has access to cheaper capital from its richly valued stock price, I believe management will trim back spending if ROIs come down, as it did with its headcount (see figure 25 above). If this happens, Amazon’s earnings and cash flow generation will most likely rebound.
Summary
-
Amazon has leveraged the internet’s growth and its expertise in data analytic to bridge the digital and physical worlds. It has built a dominant lead in both retail and cloud computing.
-
Each of Amazon’s segments has continued to grow revenue, but the company’s profitability is down as the company spends aggressively on R&D, data centers, logistics, and employee headcount.
-
Based on its track record, I expect Amazon’s aggressive spending to further widen its competitive moat, generate attractive ROIs, and drive up long term cash flow generation.
-
Amazon’s valuation is higher than its big-tech peers, but its intrinsic value based on “normalized” earnings appears to be relatively attractive.
-
While short term revenue and earnings will fluctuate due to exogenous factors and the company’s long-term oriented investment spending, it is “early days” and there is still a long growth runway for Amazon.
Be the first to comment