

fotografstockholm/E+ via Getty Images
It’s been a grisly start to the year for investors.
Charlie Bilello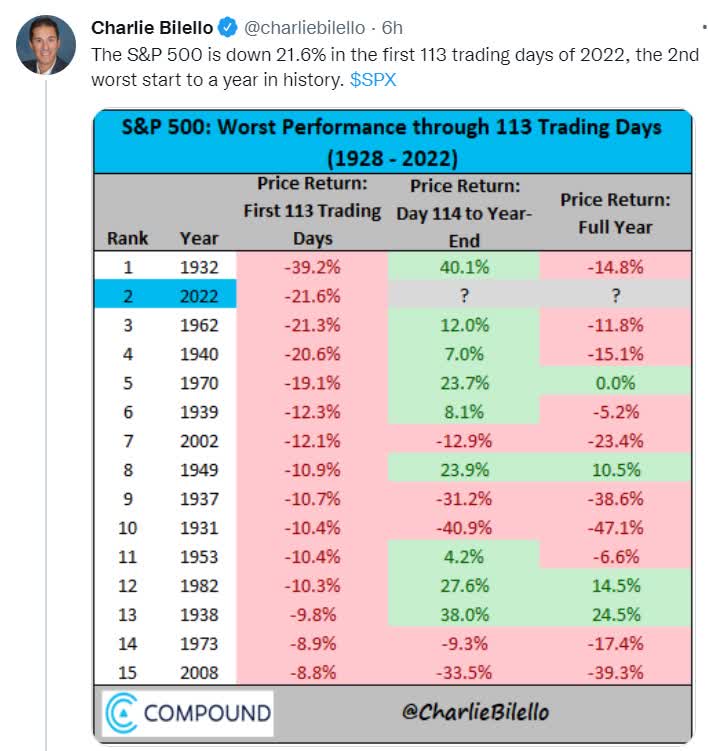
The market recently bottomed at -21.6% YTD, making it the 2nd worst start to the year in U.S. market history.
But smart long-term income investors know that bear markets like this are exactly the best opportunities for locking in mouth-watering rich retirement yields.
Ycharts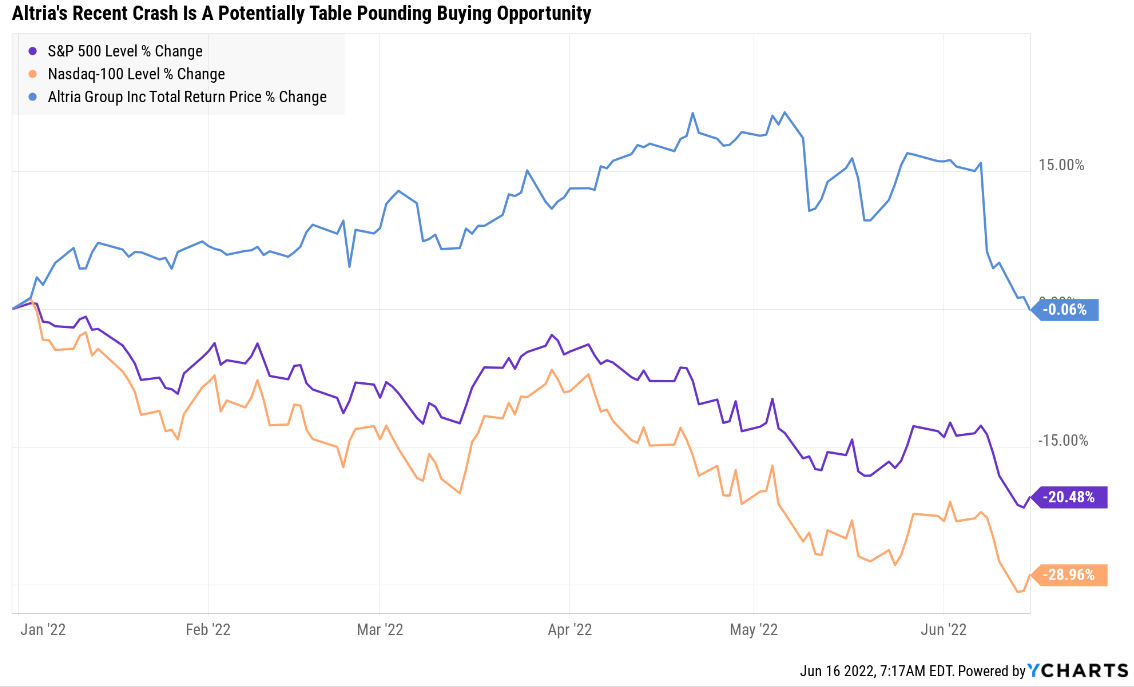
Today I want to share with you five reasons why Altria Group, Inc. (NYSE:MO), the best-performing stock in history, represents a potentially table-pounding great buy.
I can’t tell you when this bear market will stop, or guarantee you that MO is going to recover anytime soon.
But what I can say with very high confidence is that anyone buying MO today is likely to feel like a stock market genius in the next 5+ years.
In fact, as I’ll soon show you, Altria could potentially double in three years.
Reason One: The Stock Is Falling Due To Overblown Risks That We’ve Known About For Years
MO experienced an 8.4% decline on June 8th, its largest daily decline since March 23rd, 2020 (Pandemic low) when it fell 8.5%.
- Altria Group falls after Morgan Stanley turns bearish due to macro risks
The firm anticipates greater pressures from rising gas prices and weaker consumer sentiment will weigh on cigarette volumes and enhance trade-down risk.
“The market may continue to move toward a more defensive positioning, but we see risk-reward skewed to the downside given the combination of near-term fundamental pressures and our longer-term concerns about MO’s cigarette portfolio, limited RRP offering, and PM’s pending SWMA acquisition,” warned analyst Pamela Kaufman.
On valuation, Kaufman and team believe MO should trade at a lower multiple due to its limited RRP portfolio and concentrated geographic exposure to the U.S. MO’s relative valuation vs. the S&P 500 is seen as being constrained by rising interest rates, which have a strong historic correlation to MO’s share price.” – Seeking Alpha
Every time gas prices rise, some analysts worry that MO’s sales will take a hit.
While gas prices are at non-inflation-adjusted record highs, the fact is that these are addictive products and in times of stress people tend to use tobacco more, not less.
- the last time MO’s earnings fell was 2003 (-2%)
(Source: Earnings Presentation)
MO has strong pricing power due to its leading brands, and thus far this year has passed on higher costs with minimal impact on volumes.
(Source: Earnings Presentation)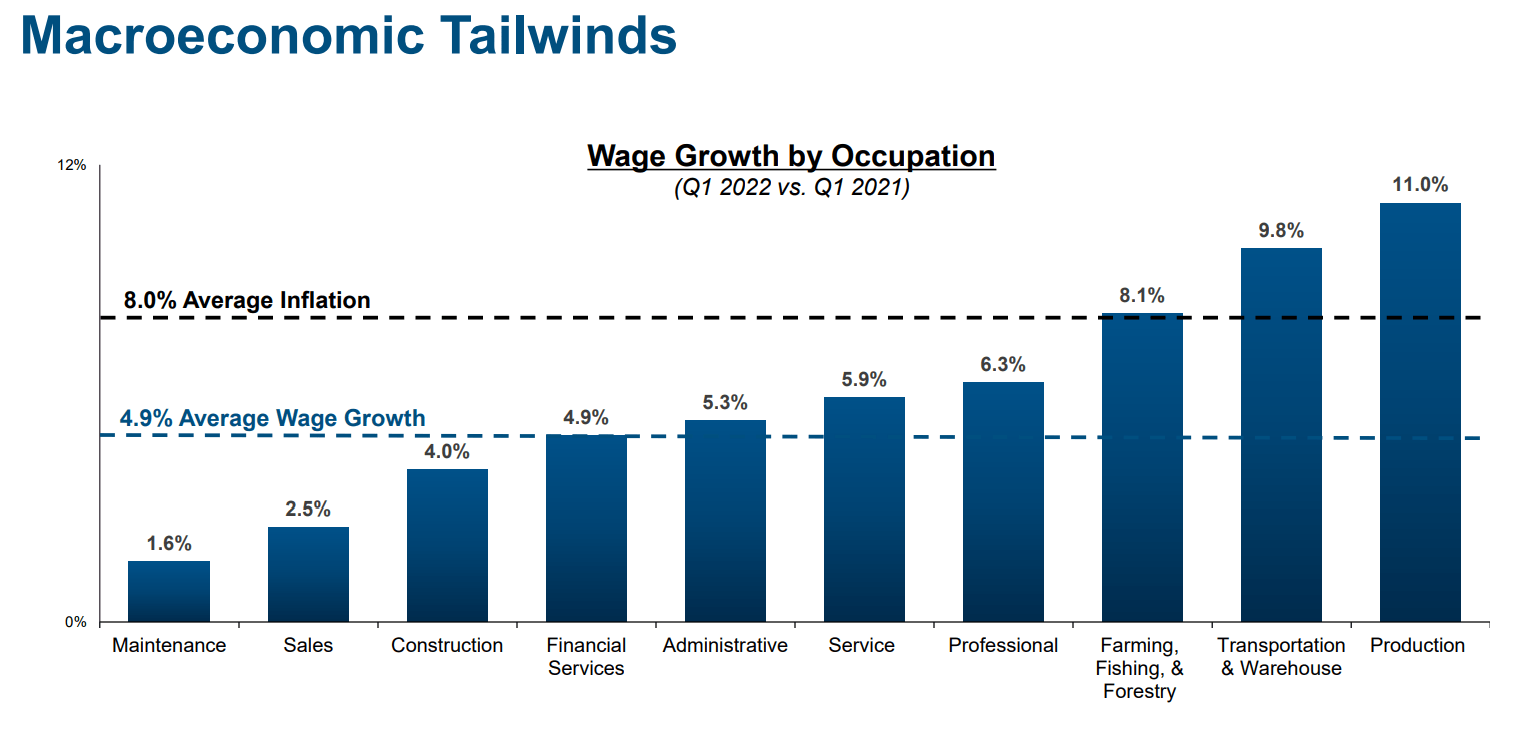
- In May 6.2% YOY wage growth for non-supervisory workers
- there is a reason this is called “consumer staples”
- workers tend to use higher wages to keep buying tobacco products even during recessions
- right now wage growth is strong and that’s why MOST analysts aren’t worried about MO’s pricing power in this high inflationary environment
- MO was founded in 1919, it’s seen inflation as high as 20% (OTCPK:WWII) and 15% (1981) and still managed to grow steadily
- Biden administration said to pursue policy to cut nicotine in cigarettes
The Biden administration is said to be pursuing a plan that would require tobacco makers to reduce the nicotine level in cigarettes sold in the U.S. to minimally or nonaddictive levels.
The new policy likely wouldn’t take place for several years and the Food and Drug Administration has to first publish a proposed rule, which would be followed by public comment, before a final rule could be published, according to a WSJ report, which cited people familiar.” – Seeking Alpha
This is something that analysts and the industry has expected for years.
(Source: Earnings Presentation)
MO has a three-phase plan for transiting to a smoke-free future.
- nicotine pouches
- vaping
- iQos (delayed by a year).
Do some analysts worry that PM buying Swedish Match might slow MO’s transition to a smoke-free future?
- some do
- the vast majority don’t
- thus this special report
MO’s Investment Thesis Remains Intact
| Metric | 2021 consensus growth | 2022 consensus growth | 2023 consensus growth | 2024 consensus growth |
2025 consensus growth |
| Sales | 2% | 1% | 1% | 0% | 3% |
| Dividend | 2% | 7% | 6% | 7% | 1% |
| EPS | 6% | 5% | 6% | 6% | 0% (likely artifact from 1 or 2 analysts) |
| Operating Cash Flow | 1% | 7% | -2% | 3% | 0% |
| Free Cash Flow | 2% | 4% | 1% | 5% | NA |
| EBITDA | 7% | 7% | 2% | 2% | NA |
| EBIT (operating income) | 7% | 6% | 2% | 2% | NA |
(Source: FAST Graphs, FactSet)
MO’s investment thesis remains intact.
- through 2024 (10 out of 19 analysts reporting estimates) 6% to 7% EPS growth and similar dividend growth expected
- margins and balance sheet are also expected to remain strong (see reason 3)
Reason Two: Altria Is The Complete Package
Here is the bottom line up front about Altria.
Reasons To Potentially Buy Altria:
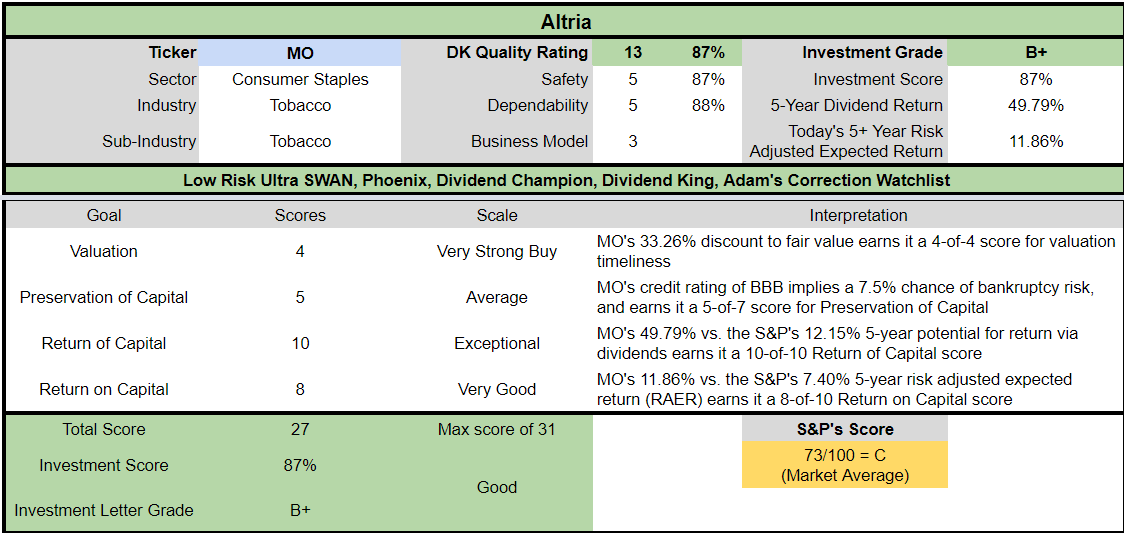
- 87% quality low-risk 13/13 Ultra SWAN dividend king
- 7.4% very safe yield (87% safety score)
- 8.1% consensus yield after August 7% dividend increase
- 52-year dividend growth streak
- 0.5% average recession dividend cut risk
- 1.7% severe recession dividend cut risk
- 33% conservatively undervalued (potential strong buy)
- Fair Value: $68.43 (13.7X earnings)
- 9.1X forward earnings vs. 14 to 16X historical
- 8.5X cash-adjusted earnings
- BBB stable outlook credit rating = 7.5% 30-year bankruptcy risk
- 61st industry percentile risk management consensus = above-average
- 5% to 6% CAGR margin-of-error growth consensus range
- 5.4% CAGR median growth consensus
- 5% to 7% pre-pandemic management growth guidance
- 5-year consensus total return potential: 15% to 18% CAGR
- base-case 5-year consensus return potential: 16% CAGR (2.5X S&P consensus)
- consensus 12-month total return forecast: 32% (11.4X, highly conservative)
- Fundamentally Justified 12-Month Returns: 57% CAGR
MO 2024 Consensus Total Return Potential
(Source: FAST Graphs, FactSet)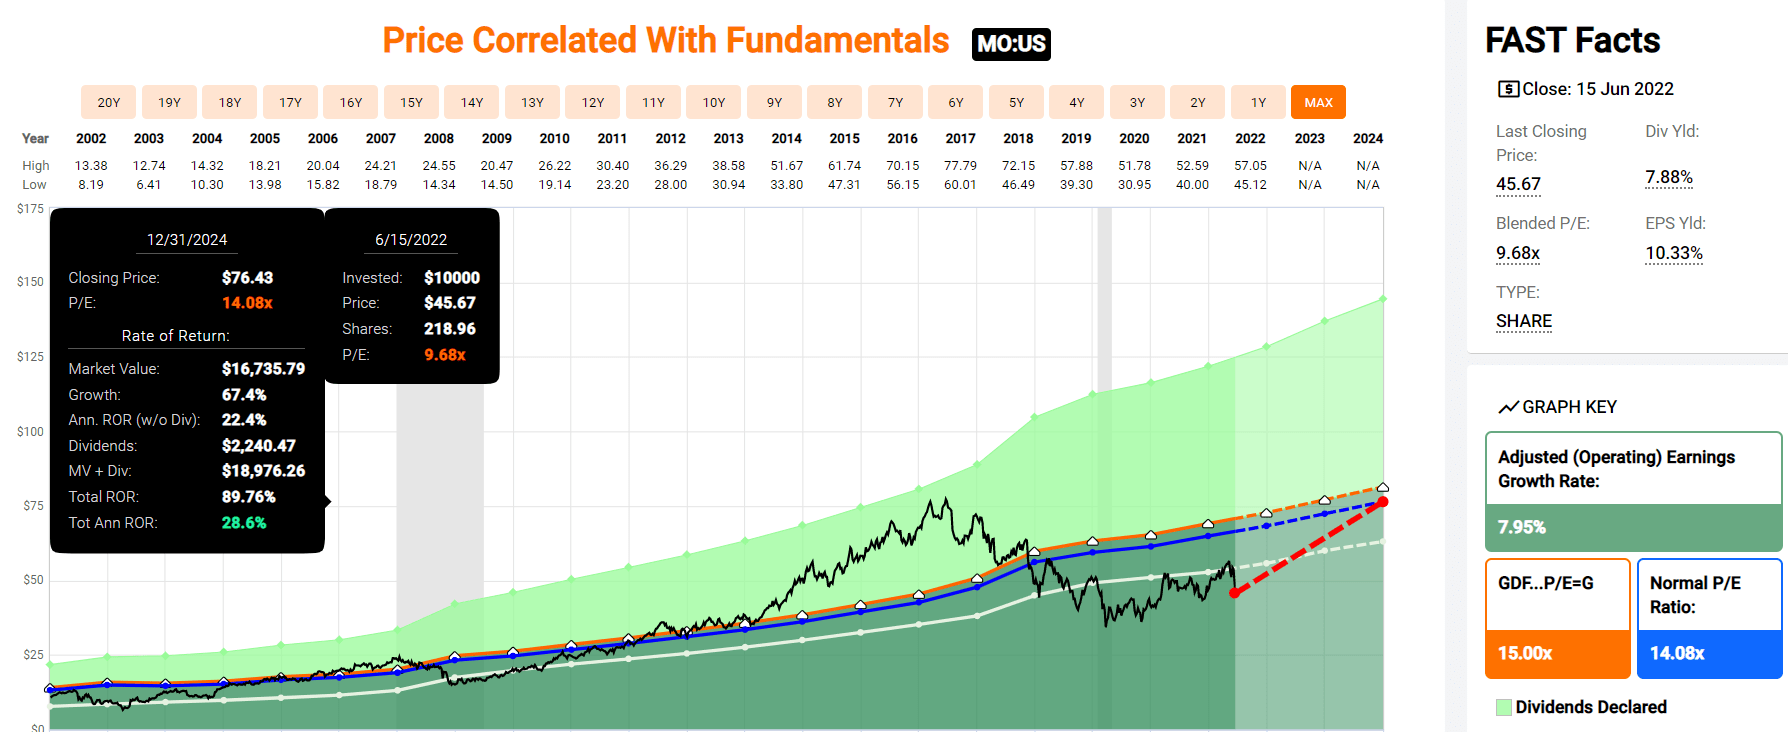
(Source: FAST Graphs, FactSet)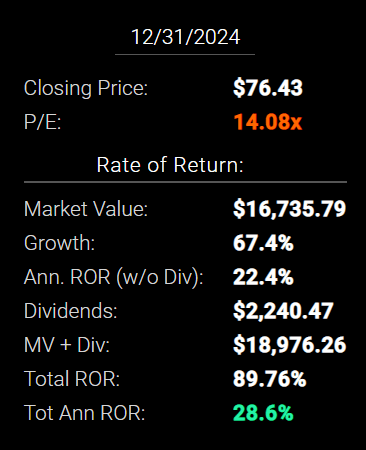
If MO grows as analysts expect by 2024, it could nearly double in 2.5 years, delivering 29% annual total returns.
- Buffett-like returns from a blue-chip bargain hiding in plain sight
MO 2027 Consensus Total Return Potential
(Source: FAST Graphs, FactSet)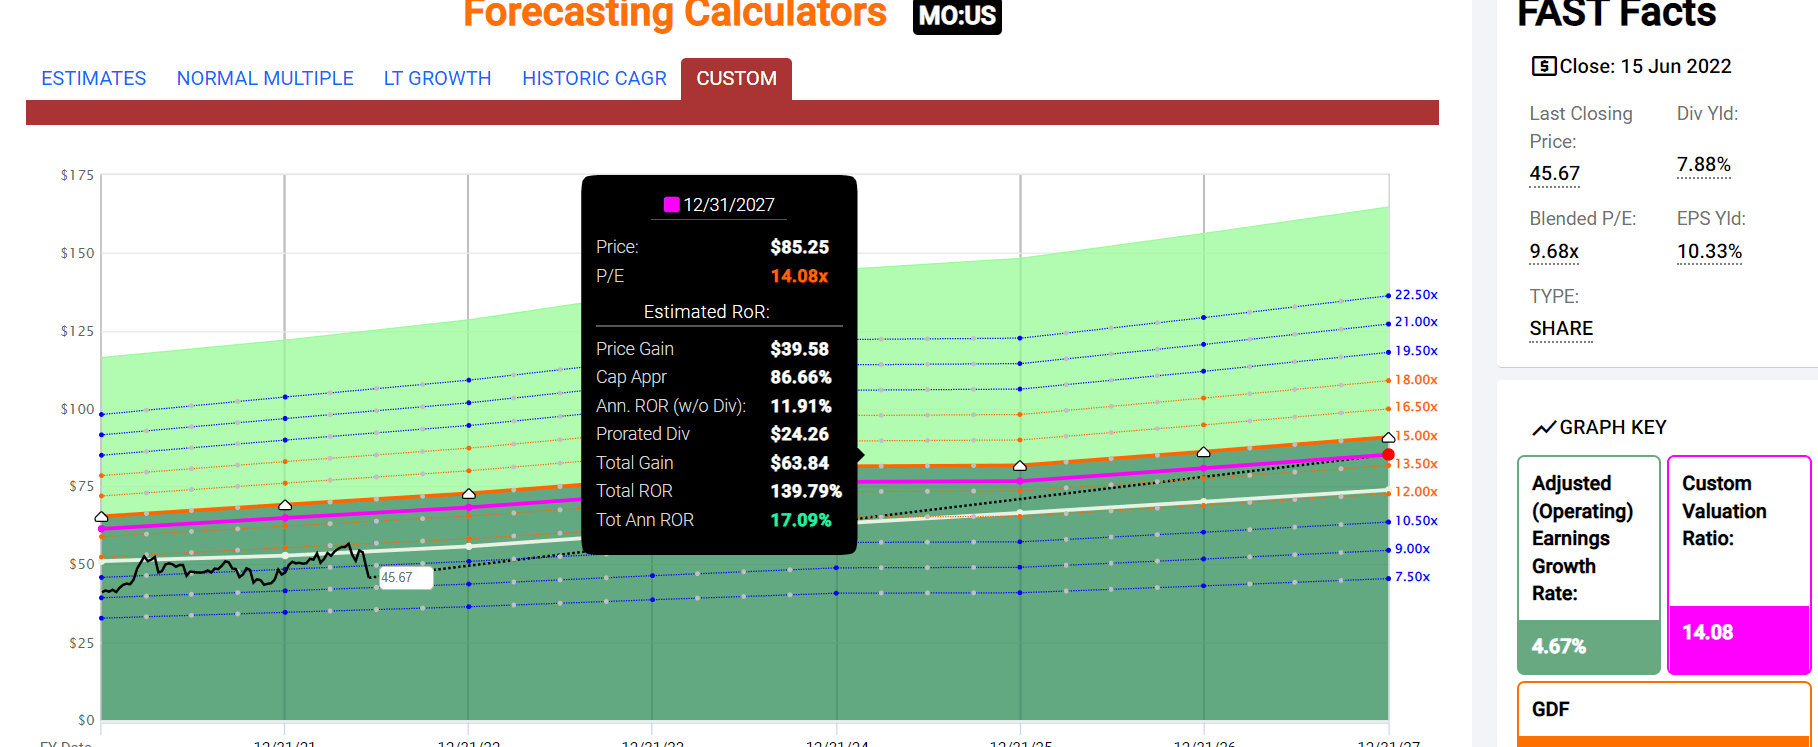
(Source: FAST Graphs, FactSet)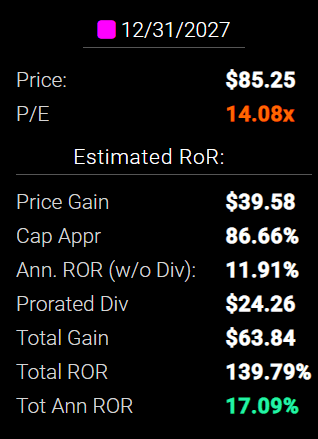
By 2027, if MO grows as expected and returns to historical fair value, it could deliver 140% total returns, or 17% annually.
- about 3X the S&P 500 consensus
MO Investment Decision Score
DK (Source: DK Automated Investment Decision Tool)
For anyone comfortable with its risk profile, MO is one of the most reasonable and prudent high-yield aristocrats you can buy today.
- 33% discount vs 5% market discount = 28% better valuation
- 4.5X higher yield (and a much safer yield at that)
- 40% higher long-term return potential than S&P 500 overtime
- 62% higher risk-adjusted expected return for the next five years
- 50% of your investment repaid in consensus dividends over five years
Reason Three: Altria Is One Of The World’s Greatest Companies
There are many ways to measure safety and quality and I factor in pretty much all of them.
The Dividend Kings’ overall quality scores are based on a 253-point model that includes:
-
Dividend safety
-
Balance sheet strength
-
Credit ratings
-
Credit default swap medium-term bankruptcy risk data
-
Short and long-term bankruptcy risk
-
Accounting and corporate fraud risk
-
Profitability and business model
-
Growth consensus estimates
-
Management growth guidance
-
Historical earnings growth rates
-
Historical cash flow growth rates
-
Historical dividend growth rates
-
Historical sales growth rates
-
Cost of capital
-
GF Scores
-
Long-term risk-management scores from MSCI, Morningstar, FactSet, S&P, Reuters’/Refinitiv, and Just Capital
-
Management quality
-
Dividend-friendly corporate culture/income dependability
-
Long-term total returns (a Ben Graham sign of quality)
-
Analyst consensus long-term return potential.
In fact, it includes over 1,000 fundamental metrics including the 12 rating agencies we use to assess fundamental risk.
-
credit and risk management ratings make up 41% of the DK safety and quality model
-
dividend/balance sheet/risk ratings make up 82% of the DK safety and quality model.
How do we know that our safety and quality model works well?
During the two worst recessions in 75 years, our safety model 87% of blue-chip dividend cuts, the ultimate baptism by fire for any dividend safety model.
How does MO score on our comprehensive safety and quality models?
MO Dividend Safety
| Rating | Dividend Kings Safety Score (162 Point Safety Model) | Approximate Dividend Cut Risk (Average Recession) |
Approximate Dividend Cut Risk In Pandemic Level Recession |
| 1 – unsafe | 0% to 20% | over 4% | 16+% |
| 2- below average | 21% to 40% | over 2% | 8% to 16% |
| 3 – average | 41% to 60% | 2% | 4% to 8% |
| 4 – safe | 61% to 80% | 1% | 2% to 4% |
| 5- very safe | 81% to 100% | 0.5% | 1% to 2% |
| MO | 87% | 0.5% | 1.70% |
| Risk Rating | Low-Risk (61st industry percentile risk-management consensus) | BBB stable outlook credit rating 7.5% 30-year bankruptcy risk | 20% OR LESS Max Risk Cap Recommendation |
Long-Term Dependability
| Company | DK Long-Term Dependability Score | Interpretation | Points |
| Non-Dependable Companies | 21% or below | Poor Dependability | 1 |
| Low Dependability Companies | 22% to 60% | Below-Average Dependability | 2 |
| S&P 500/Industry Average | 61% (61% to 70% range) | Average Dependability | 3 |
| Above-Average | 71% to 80% | Very Dependable | 4 |
| Very Good | 81% or higher | Exceptional Dependability | 5 |
| MO | 88% | Exceptional Dependability | 5 |
Overall Quality
| MO | Final Score | Rating |
| Safety | 87% | 5/5 Very Safe |
| Business Model | 80% | 3/3 Wide And Stable Moat |
| Dependability | 88% | 5/5 Exceptional |
| Total | 87% | 13/13 Ultra SWAN Dividend King |
| Risk Rating | 3/3 Low-Risk | |
| 20% OR LESS Max Risk Cap Rec |
5% Margin of Safety For A Potentially Good Buy |
Why I Trust Altria In My Retirement Portfolio And So Can You
- Daily Blue-Chip Deal Video: 7% Yielding Altria Is Likely To Soar If Interest Rates Rise
- see the investment thesis section of this video to see the in-depth plans MO has for achieving steady growth for decades to come
MO Credit Ratings
| Rating Agency | Credit Rating | 30-Year Default/Bankruptcy Risk | Chance of Losing 100% Of Your Investment 1 In |
| S&P | BBB stable | 7.50% | 13.3 |
| Fitch | BBB stable | 7.50% | 13.3 |
| Moody’s | A3 (A- equivalent) stable | 2.50% | 40.0 |
| Consensus | BBB+ stable | 5.83% | 17.1 |
(Sources: S&P, Fitch, Moody’s)
Rating agencies estimate a 1 in 17 chance of MO going bankrupt and investors losing all their money over the next 30 years.
MO Leverage Consensus Forecast
| Year | Debt/EBITDA | Net Debt/EBITDA (3.0 Or Less Safe According To Credit Rating Agencies) |
Interest Coverage (8+ Safe) |
| 2020 | 2.52 | 2.10 | 9.63 |
| 2021 | NA | 1.97 | 10.04 |
| 2022 | 2.31 | 1.94 | 11.49 |
| 2023 | 2.25 | 1.85 | 11.80 |
| 2024 | 2.20 | 1.77 | 14.81 |
| 2025 | 2.25 | 1.69 | NA |
| Annualized Change | -2.26% | -4.21% | 11.35% |
(Sources: FactSet Research Terminal)
MO’s leverage is already safe and expected to become modestly more so over time. Its interest coverage ratio is expected to approach 2X the industry safety guideline by 2024.
MO Balance Sheet Consensus Forecast
| Year | Total Debt (Millions) | Cash | Net Debt (Millions) | Interest Cost (Millions) | EBITDA (Millions) | Operating Income (Millions) |
| 2020 | $29,471 | $4,945 | $24,526 | $1,205 | $11,695 | $11,609 |
| 2021 | NA | NA | $23,783 | $1,176 | $12,044 | $11,807 |
| 2022 | $28,982 | $4,814 | $24,410 | $1,065 | $12,560 | $12,240 |
| 2023 | $28,951 | $4,814 | $23,912 | $1,069 | $12,892 | $12,609 |
| 2024 | $29,306 | $4,814 | $23,564 | $870 | $13,297 | $12,885 |
| 2025 | $29,488 | $5,353 | $22,185 | NA | $13,118 | $12,783 |
| Annualized Growth | 0.01% | 1.60% | -1.99% | -7.82% | 2.32% | 1.95% |
(Sources: FactSet Research Terminal)
- debt is drifting lower
- cash flows are slowly but steadily growing
- interest costs are 4.02% and are expected to approach 3% by 2024
- possibly due to credit rating upgrades
- MO’s inflation-adjusted average borrowing cost is 1.5%
- vs. 28.7% cash returns on invested capital
MO Bond Profile
(Sources: FactSet Research Terminal)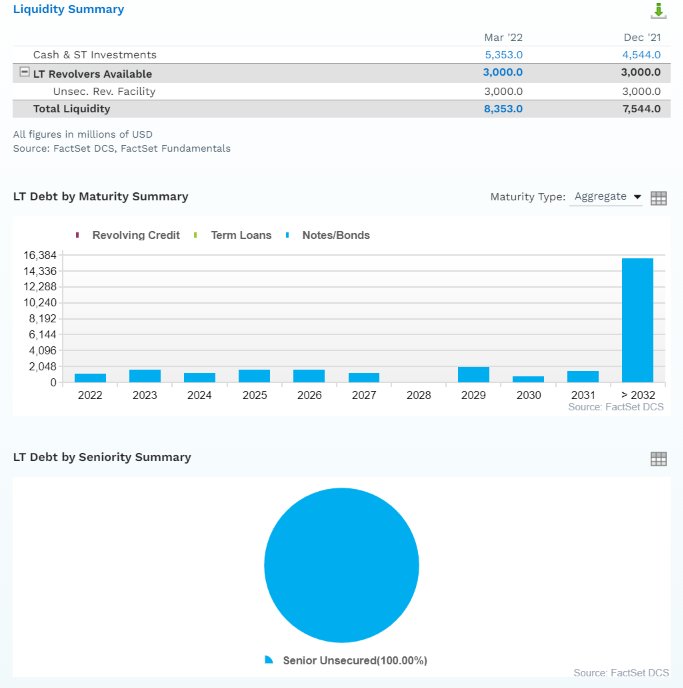
(Sources: FactSet Research Terminal)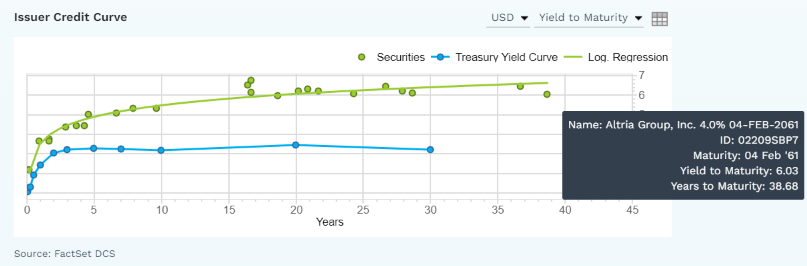
- $8.4 billion in liquidity
- well-staggered bond maturities (no issues refinancing maturing debt)
- 100% unsecured bonds (maximum financial flexibility)
- bond investors are so confident in MO’s smoke-free future that they are willing to lend to it for 39 years at 6.0%
MO Credit Default SWAPs: The Bond Market’s Real-Time Fundamental Risk Estimate
(Sources: FactSet Research Terminal)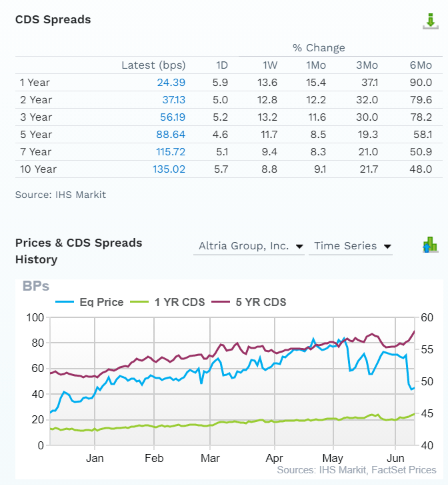
Credit default swaps are insurance policies taken out by bond investors in case a company defaults (goes bankrupt).
- they serve as a real-time fundamental risk assessment from “the smart money” on Wall Street
- including the latest news that can cause stock prices to be extremely volatile
- the modest increase in fundamental risk in the last six months
- MO’s 10-year CDS is still consistent with a BBB+ credit rating (4.05% 30-year bankruptcy risk)
- and its CDS are relatively stable over time, much more so than the stock price
The bond market agrees with analysts, management, and rating agencies that MO’s investment thesis is intact.
MO GF Score: The Newest Addition To The DK Safety And Quality Model
The GF Score is a ranking system that has been found to be closely correlated to the long-term performances of stocks by backtesting from 2006 to 2021.” – Gurufocus
GF Score takes five key aspects into consideration. They are:
- Financial Strength
- Profitability
- Growth
- Valuation
- Momentum
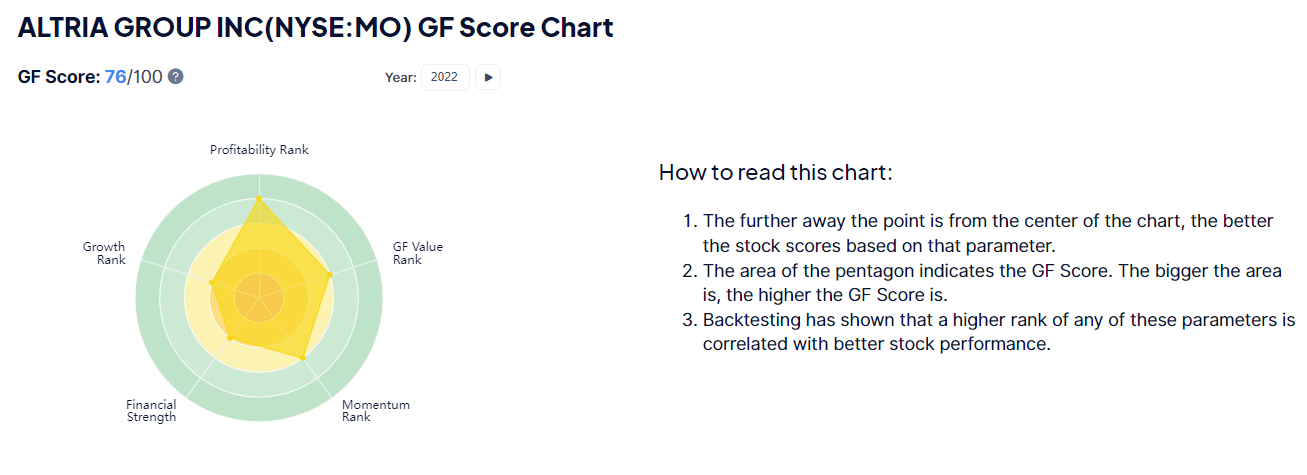
MO’s good 76/100 GF score confirms its strong fundamentals as well as attractive valuation.
Strong financial strength, profitability, growth, and valuation.
Profitability: Wall Street’s Favorite Quality Proxy
(Source: Gurufocus Premium)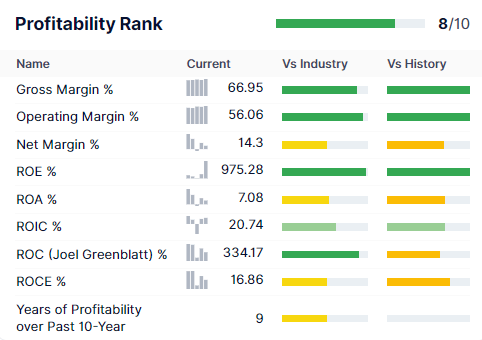
MO’s profitability is historically in the top 20% of its peers (a famously high-margin industry).
MO Trailing 12-Month Profitability Vs Peers
| Metric | Industry Percentile | Major Tobacco Companies More Profitable Than MO (Out Of 48) |
| Gross Margins | 86.67 | 6 |
| Operating Margin | 93.48 | 3 |
| Net Margin | 52.17 | 23 |
| Return On Equity | 97.50 | 1 |
| Return On Assets | 45.83 | 26 |
| Returns On Invested Capital | 62.50 | 18 |
| Return On Capital | 89.58 | 5 |
| Return On Capital Employed | 52.27 | 23 |
| Average | 70.48 | 14 |
(Source: GuruFocus Premium)
Some pandemic-related expenses temporarily reduced profitability to the 70th percentile.
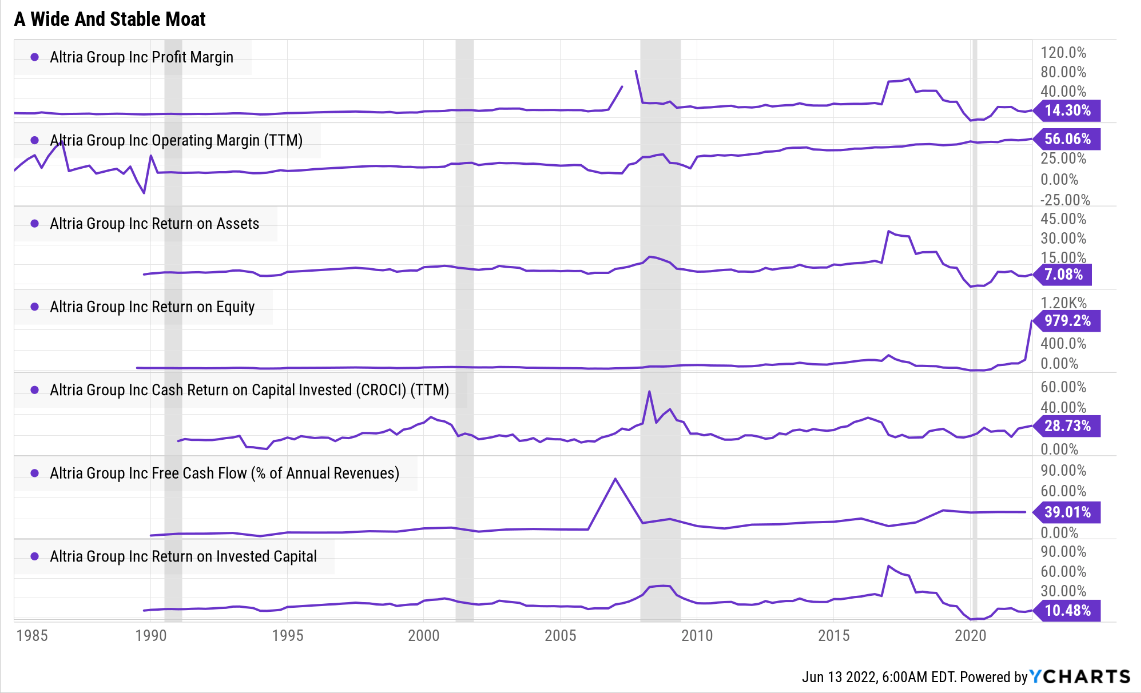
MO’s profitability has been stable for decades, and its free cash flow margins, which directly support the growing dividend, are in the top 5% of all global companies.
MO Profit Margin Consensus Forecast
| Year | FCF Margin | EBITDA Margin | EBIT (Operating) Margin | Net Margin | Return On Capital Expansion |
Return On Capital Forecast |
| 2020 | 39.1% | 56.1% | 55.7% | 38.9% | 1.04 | |
| 2021 | 39.0% | 57.1% | 55.9% | 40.4% | TTM ROC | 334.17% |
| 2022 | 40.4% | 59.8% | 58.3% | 41.6% | Latest ROC | 762.32% |
| 2023 | 40.3% | 60.6% | 59.2% | 43.0% | 2024 ROC | 346.36% |
| 2024 | 41.5% | 62.0% | 60.1% | 44.0% | 2024 ROC | 790.12% |
| 2025 | 40.6% | 59.5% | 58.0% | 42.4% | Average | 568.24% |
| 2026 | NA | NA | NA | NA | Industry Median | 64.74% |
| 2027 | NA | NA | NA | NA | MO/Industry Median | 8.78 |
| Annualized Growth | 0.73% | 1.17% | 0.80% | 1.69% | Vs S&P | 38.92 |
| Annualized Growth (Post Pandemic) | 0.99% | 1.05% | 0.90% | 1.22% |
(Sources: FactSet Research Terminal)
MO’s margins are expected to modestly increase in the coming years.
Including FCF margins of 41%, in the top 5% of all global companies.
Returns on capital = annual pre-tax profit/operating capital (the money it takes to run the business).
- Joel Greenblatt’s gold standard of profitability and moatiness
MO’s ROC is expected to be 9X that of its peers, and 39X that of the S&P 500.
- according to one of the greatest investors in history MO’s quality is 39X greater than the average S&P 500 company
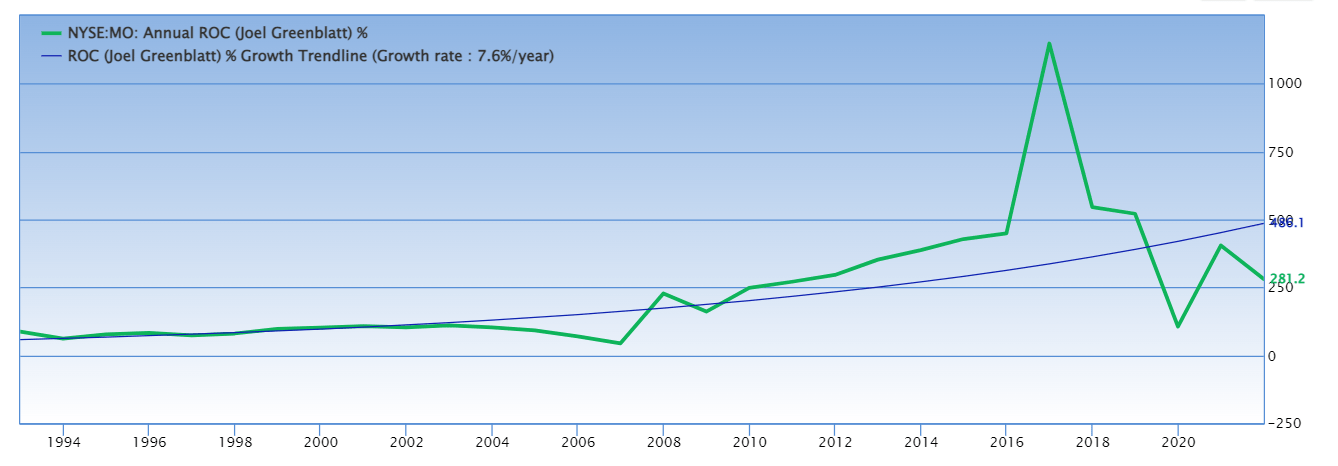
MO’s ROC has been doubling every decade for 30 years, confirming a wide and stable moat.
MO Medium-Term Consensus Forecast
| Year | Sales | Free Cash Flow | EBITDA | EBIT (Operating Income) | Net Income |
| 2020 | $20,841 | $8,154 | $11,695 | $11,609 | $8,117 |
| 2021 | $21,111 | $8,236 | $12,044 | $11,807 | $8,519 |
| 2022 | $21,007 | $8,484 | $12,560 | $12,240 | $8,747 |
| 2023 | $21,288 | $8,589 | $12,892 | $12,609 | $9,147 |
| 2024 | $21,438 | $8,903 | $13,297 | $12,885 | $9,443 |
| 2025 | $22,052 | $8,949 | $13,118 | $12,783 | $9,341 |
| Annualized Growth | 1.14% | 1.88% | 2.32% | 1.95% | 2.85% |
| Annualized Growth (Post Pandemic) | 1.10% | 2.10% | 2.16% | 2.01% | 2.33% |
| Cumulative Over The Next 4 Years | $85,785 | $34,925 | $51,867 | $50,517 | $36,678 |
(Sources: FactSet Research Terminal)
MO is a slow-growing company but it is growing.
The last time MO reported negative earnings growth was -2% in 2003.
This is a highly defensive, recession-resistant business model.
Reason Four: Altria Has Solid Long-Term Growth Prospects
Altria isn’t a fast-growing business but is a steadily growing one.
MO Medium-Term Consensus Forecast
| Year | Sales | Free Cash Flow | EBITDA | EBIT (Operating Income) | Net Income |
| 2020 | $20,841 | $8,154 | $11,695 | $11,609 | $8,117 |
| 2021 | $21,111 | $8,236 | $12,044 | $11,807 | $8,519 |
| 2022 | $21,007 | $8,484 | $12,560 | $12,240 | $8,747 |
| 2023 | $21,288 | $8,589 | $12,892 | $12,609 | $9,147 |
| 2024 | $21,438 | $8,903 | $13,297 | $12,885 | $9,443 |
| 2025 | $22,052 | $8,949 | $13,118 | $12,783 | $9,341 |
| Annualized Growth | 1.14% | 1.88% | 2.32% | 1.95% | 2.85% |
| Annualized Growth (Post Pandemic) | 1.10% | 2.10% | 2.16% | 2.01% | 2.33% |
| Cumulative Over The Next 4 Years | $85,785 | $34,925 | $51,867 | $50,517 | $36,678 |
(Sources: FactSet Research Terminal)
MO is a slow-growing company but it is growing.
The last time MO reported negative earnings growth was -2% in 2003.
MO Dividend Growth Consensus Forecast
| Year | Dividend Consensus | EPS Consensus | EPS Payout Ratio | Retained (Post-Dividend) Earnings | Buyback Potential | Debt Repayment Potential |
| 2022 | $3.75 | $4.86 | 77.2% | $2,011 | 2.27% | 6.9% |
| 2023 | $3.97 | $5.15 | 77.1% | $2,138 | 2.41% | 7.4% |
| 2024 | $4.23 | $5.43 | 77.9% | $2,174 | 2.45% | 7.5% |
| 2025 | $4.27 | $5.45 | 78.3% | $2,138 | 2.41% | 7.3% |
| Total 2022 Through 2025 | $16.22 | $20.89 | 77.6% | $8,462.04 | 9.55% | 29.23% |
| Annualized Rate | 4.42% | 3.89% | 0.51% | 2.06% | 2.06% | 1.68% |
(Sources: FactSet Research Terminal)
Rating agencies consider 85% to be a safe payout ratio for this industry.
- MO’s company policy 80% payout ratio
- PM’s policy 75%
- BTI’s policy 65%
MO’s $8.5 billion in post-dividend retained earnings is enough to pay down 29% of its current debt or buy back 10% of its stock at current valuations.
MO Buyback Consensus Forecast
| Year | Consensus Buybacks ($ Millions) | % Of Shares (At Current Valuations) | Market Cap |
| 2022 | $2,152.0 | 2.4% | $88,609 |
| 2023 | $1,660.0 | 1.9% | $88,609 |
| 2024 | $2,000.0 | 2.3% | $88,609 |
| 2025 | $3,000.0 | 3.4% | $88,609 |
| Total 2022-2025 | $8,812.00 | 9.9% | $88,609 |
| Annualized Rate | 2.57% | Average Annual Buybacks | $2,203.00 |
(Sources: FactSet Research Terminal)
Analysts expect MO to buy back $2.2 billion of its stock over the next four years, about 2.6% annually at current valuations.
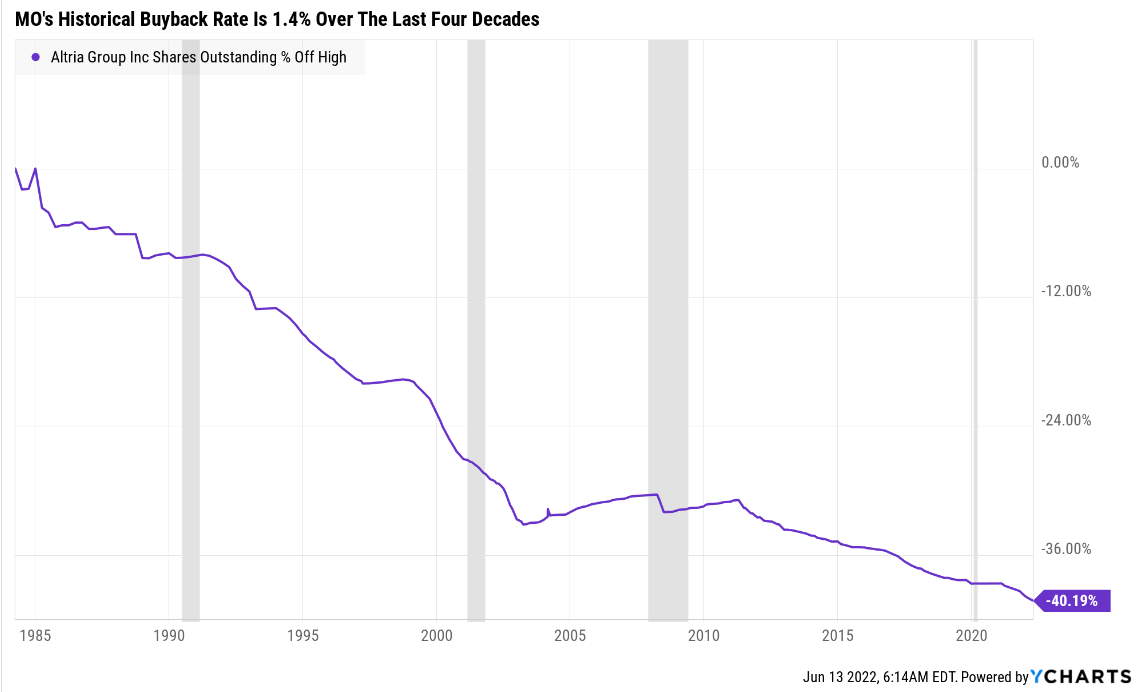
MO’s historical buyback rate since 1985 is 1.4% per year.
| Time Frame (Years) | Net Buyback Rate | Shares Remaining | Net Shares Repurchased | Each Share You Own Is Worth X Times More (Not Including Future Growth And Dividends) |
| 5 | 2.6% | 87.66% | 12.34% | 1.14 |
| 10 | 2.6% | 76.84% | 23.16% | 1.30 |
| 15 | 2.6% | 67.36% | 32.64% | 1.48 |
| 20 | 2.6% | 59.04% | 40.96% | 1.69 |
| 25 | 2.6% | 51.76% | 48.24% | 1.93 |
| 30 | 2.6% | 45.37% | 54.63% | 2.20 |
(Sources: FactSet Research Terminal)
If MO buys back stocks at the consensus rate, then it could repurchase 55% of its stock over the next three decades.
- increasing your shares’ intrinsic value by 120%
- not counting dividend and earnings growth
MO Long-Term Growth Outlook
(Sources: FactSet Research Terminal)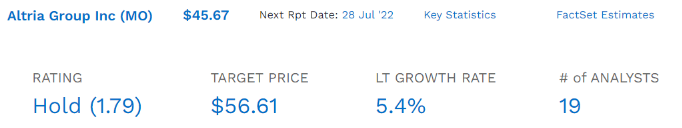
- 5.3-5.4% CAGR growth consensus (from five sources)
- 5.4% median consensus from all 19 analysts (up 0.1% since the last video)
How accurate is the management guidance that these forecasts are based on?
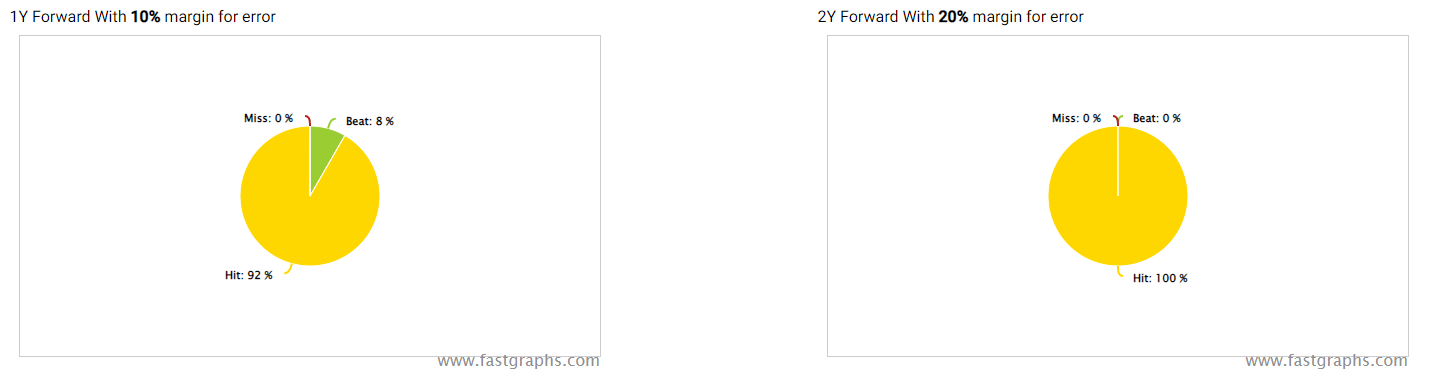
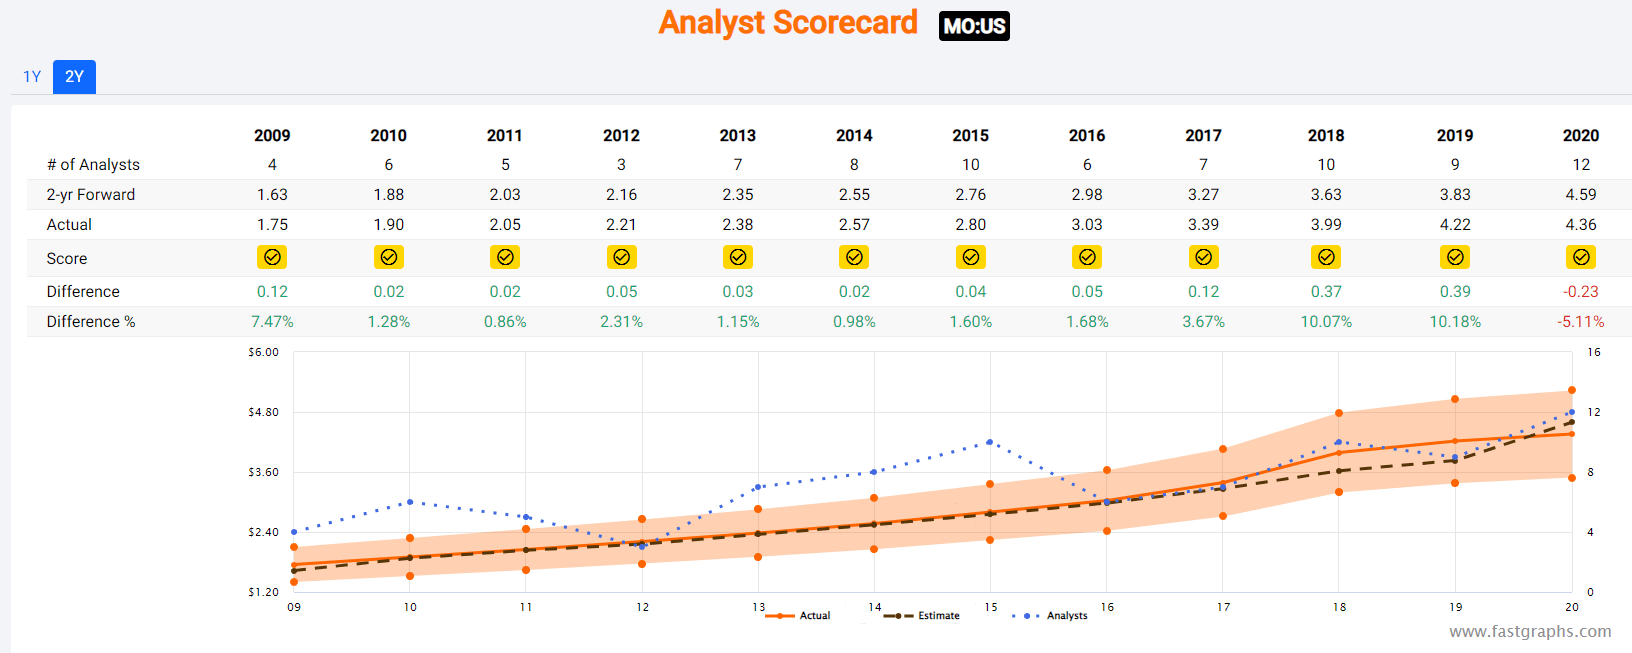
Other than the pandemic, MO hasn’t missed 2-year estimates in a decade.
Margins of error of 5% to the upside and downside.
- 5% to 6% CAGR margin-of-error adjusted growth consensus range
- 70% statistical probability that MO grows at 5% to 6% over time
(Sources: FAST Graphs, FactSet Research)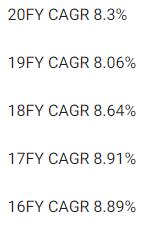
(Sources: FAST Graphs, FactSet Research)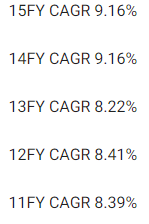
(Sources: FAST Graphs, FactSet Research)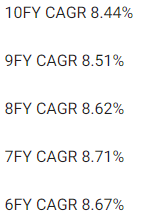
(Sources: FAST Graphs, FactSet Research)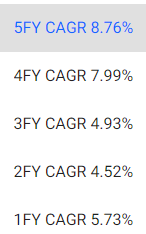
Faster volume declines in the US are expected to result in 3% slower growth than in the past.
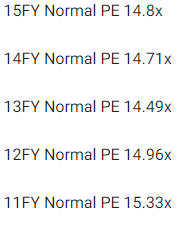
- which is why we use the low end of the historical 14 to 16 PE market-determined fair value range
- 14 PE requires 2.75% CAGR growth according to the Graham/Dodd fair value formula
Reason Five: A Wonderful Company At A Wonderful Price
(Source: FAST Graphs, FactSet) (Source: FAST Graphs, FactSet)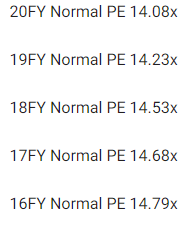
(Source: FAST Graphs, FactSet)
For 20 years, outside of bear markets and bubbles, hundreds of millions of income investors have paid between 14 and 16X earnings for MO.
- 91% statistical probability that this approximates intrinsic value
| Metric | Historical Fair Value Multiples (all-years) | 2021 | 2022 | 2023 | 2024 | 2025 |
12-Month Forward Fair Value |
| 25-year average yield | 5.40% | $65.19 | $66.67 | $66.67 | $78.33 | $79.07 | |
| Earnings | 14.08 | $64.91 | $68.43 | $72.51 | $76.74 | $77.16 | |
| Average | $65.05 | $67.54 | $69.47 | $77.53 | $68.43 | $68.43 | |
| Current Price | $45.67 | ||||||
|
Discount To Fair Value |
29.79% | 32.38% | 34.26% | 41.09% | 33.26% | 33.26% | |
|
Upside To Fair Value (NOT Including Dividends) |
42.43% | 47.88% | 52.11% | 69.75% | 49.83% | 49.83% (57% including dividend) | |
| 2022 EPS | 2023 EPS | 2021 Weighted EPS | 2022 Weighted EPS | 12-Month Forward EPS | 12-Month Average Fair Value Forward PE |
Current Forward PE |
|
| $4.86 | $5.15 | $2.62 | $2.38 | $4.99 | 13.7 | 9.1 |
I conservatively estimate MO is worth 13.7X earnings and today it trades at 9.1X.
- 8.5X cash-adjusted earnings
- anti-bubble valuation according to Ben Graham
|
Analyst Median 12-Month Price Target |
Morningstar Fair Value Estimate |
| $56.61 (11.3 PE) | $52.00 (10.4 PE) |
|
Discount To Price Target (Not A Fair Value Estimate) |
Discount To Fair Value |
| 19.33% | 12.17% |
|
Upside To Price Target (Not Including Dividend) |
Upside To Fair Value (Not Including Dividend) |
| 23.95% | 13.86% |
|
12-Month Median Total Return Price (Including Dividend) |
Fair Value + 12-Month Dividend |
| $60.21 | $55.60 |
|
Discount To Total Price Target (Not A Fair Value Estimate) |
Discount To Fair Value + 12-Month Dividend |
| 24.15% | 17.86% |
|
Upside To Price Target ( Including Dividend) |
Upside To Fair Value + Dividend |
| 31.84% | 21.74% |
Morningstar’s DCF model assumes slower growth than what analysts expect and is 91% statistically likely to be too conservative.
Analysts expect MO to trade at 11.4X earnings in 12 months and deliver 23% total returns.
My recommendations aren’t based on 12-month forecasts but on whether or not a company’s margin of safety sufficiently compensates you for the risk profile.
| Rating | Margin Of Safety For Low-Risk 13/13 Super SWAN quality companies | 2022 Price | 2023 Price |
12-Month Forward Fair Value |
| Potentially Reasonable Buy | 0% | $67.54 | $69.47 | $68.43 |
| Potentially Good Buy | 5% | $64.16 | $65.99 | $65.01 |
| Potentially Strong Buy | 15% | $57.41 | $59.05 | $58.16 |
| Potentially Very Strong Buy | 25% | $48.12 | $52.10 | $51.32 |
| Potentially Ultra-Value Buy | 35% | $43.90 | $45.15 | $44.48 |
| Currently | $45.67 | 32.38% | 34.26% | 33.26% |
| Upside To Fair Value (Not Including Dividends) | 47.88% | 52.11% | 49.83% |
For anyone comfortable with the risk profile, MO is a potentially very strong buy and not far from an Ultra Value buy.
Risk Profile: Why Altria Isn’t Right For Everyone
There are no risk-free companies and no company is right for everyone. You have to be comfortable with the fundamental risk profile.
What Could Cause MO’s Investment Thesis To Break
- safety falls to 40% or less
- balance sheet collapses (potentially due to very poorly thought out M&A deals)
- failure of the smoke-free future plans (such as PM pulling the iQos agreement)
- growth outlook falls to less than 0.6% for seven years
- MO’s role in my portfolio is to deliver long-term 10+% returns with minimal fundamental risk
- like all non-defensive sectors (anything that’s not REITs, utilities, midstream, healthcare, telecom, consumer staples), I target 10+% long-term return potential for all recommendations
How long it takes for a company’s investment thesis to break depends on the quality of the company.
| Quality |
Years For The Thesis To Break Entirely |
| Below-Average | 1 |
| Average | 2 |
| Above-Average | 3 |
| Blue-Chip | 4 |
| SWAN | 5 |
| Super SWAN | 6 |
| Ultra SWAN | 7 |
| 100% Quality Companies (LOW and MA) | 8 |
These are my personal rule of thumb for when to sell a stock if the investment thesis has broken.
MO is highly unlikely to suffer such catastrophic declines in fundamentals.
MO’s Risk Profile Includes
- regulatory risk (plain packaging laws, menthol ban, nicotine level regulation, reduced risk product taxation)
- smoke-free transition execution: 1-year setback in iQos rollout due to BTI patent lawsuit, if PM decides to end that agreement MO would have a harder time achieving its smoke-free future plans
- margin compression risk: RRPs could have lower margins than legacy products
- M&A execution risk (Juul and Cronos investments thus far have not gone well)
- labor retention risk (tightest job market in over 50 years and finance is a high-paying industry)
One of MO’s biggest risks is that it doesn’t scale up reduced-risk product sales as quickly as its peers.
- PM plans 50% of sales from RRPs by 2025
- analysts expect just 13% from MO
- MO’s smoke-free future plans are very dependent on the success of iQos in the US
- IQOS’s US launch has been pushed back by 1 year due to BTI’s lawsuit
- analysts still expect PM to honor its iQos licensing deal with MO but the risk of PM going it alone isn’t zero
How do we quantify, monitor, and track such a complex risk profile? By doing what big institutions do.
Long-Term Risk Analysis: How Large Institutions Measure Total Risk
- see the risk section of this video to get an in-depth view (and link to two reports) of how DK and big institutions measure long-term risk management by companies
MO Long-Term Risk Management Consensus
| Rating Agency | Industry Percentile |
Rating Agency Classification |
| MSCI 37 Metric Model | 58.0% |
BBB Average, Positive Trend |
| Morningstar/Sustainalytics 20 Metric Model | 89.3% |
24.6/100 Medium-Risk |
| Reuters’/Refinitiv 500+ Metric Model | 94.7% | Excellent |
| S&P 1,000+ Metric Model | 36.0% |
Below Average, Negative Trend |
| FactSet | 30.0% |
Below Average, Positive Trend |
| Morningstar Global Percentile (All 15,000 Rated Companies) | 58.6% | Average |
| Consensus | 61% |
Low-Risk, Above-Average Risk-Management, Stable Trend |
(Sources: MSCI, Morningstar, S&P, FactSet)
MO’s Long-Term Risk Management Is The 271st Best In The Master List (46th Percentile)
| Classification | Average Consensus LT Risk-Management Industry Percentile |
Risk-Management Rating |
| S&P Global (SPGI) #1 Risk Management In The Master List | 94 | Exceptional |
| Strong ESG Stocks | 78 |
Good – Bordering On Very Good |
| Foreign Dividend Stocks | 75 | Good |
| Ultra SWANs | 71 | Good |
| Low Volatility Stocks | 68 | Above-Average |
| Dividend Aristocrats | 67 | Above-Average |
| Dividend Kings | 63 | Above-Average |
| Master List average | 62 | Above-Average |
| Altria | 61 | Above-Average |
| Hyper-Growth stocks | 61 | Above-Average |
| Monthly Dividend Stocks | 60 | Above-Average |
| Dividend Champions | 57 | Average |
(Source: DK Research Terminal)
MO’s risk-management consensus is in the bottom 46% of the world’s highest quality companies and similar to that of such other companies as
- Sherwin-Williams (SHW) – dividend king
- Consolidated Edison (ED) – dividend aristocrat
- Brown-Foreman (BF.B) – dividend aristocrat
- Procter & Gamble (PG) – dividend king
- Exxon Mobil (XOM) – dividend aristocrat
- Expeditors International (EXPD) – dividend aristocrat
- Costco (COST)
The bottom line is that all companies have risks, and MO is above-average at managing theirs.
How We Monitor MO’s Risk Profile
- 19 analysts
- 3 credit rating agencies
- 5 total risk rating agencies
- 24 experts who collectively know this business better than anyone other than management
- and the bond market for real-time fundamental risk assessments when news breaks
When the facts change, I change my mind. What do you do sir?” – John Maynard Keynes
There are no sacred cows at iREIT or Dividend Kings. Wherever the fundamentals lead we always follow. That’s the essence of disciplined financial science, the math behind retiring rich and staying rich in retirement.
Bottom Line: 8% Yielding Altria Is A Table Pounding Great Buy
I know bear markets are scary.
Your gut is probably telling you to sell everything and hide in cash.
Daily Shot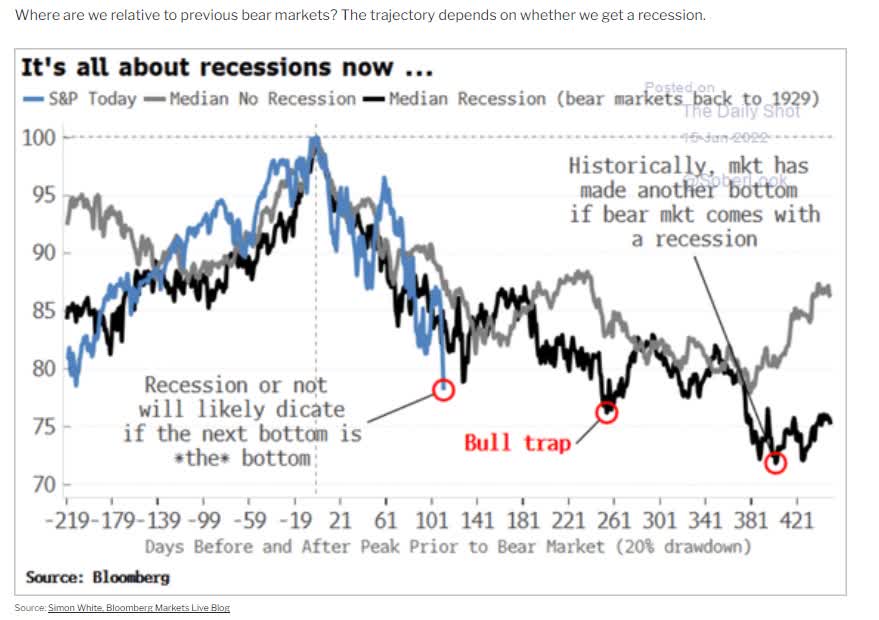
And historically speaking, if we don’t avoid a recession, which is looking more and more likely next year, the market still has likely further to drop.
| Time Frame |
Historically Average Bear Market Bottom |
| Non-Recessionary Bear Markets Since 1965 |
-21% (Achieved May 20th) |
| Median Recessionary Bear Market Since WWII |
-24% (Citigroup base case with a mild recession) |
| Non-Recessionary Bear Markets Since 1928 |
-26% (Goldman Sachs base case with a mild recession) |
| Bear Markets Since WWII |
-30% (Morgan Stanley base case) |
| Recessionary Bear Markets Since 1965 |
-36% (Bank of America recessionary base case) |
| All 140 Bear Markets Since 1792 | -37% |
| Average Recessionary Bear Market Since 1928 |
-40% (Deutsche Bank, Bridgewater, Soc Gen Severe Recessionary base case) |
|
(Sources: Ben Carlson, Bank of America, Oxford Economics, Goldman Sachs) |
But the good news is that even if the market isn’t done falling, we’re likely getting close to the bottom, which means that selling stocks now is likely the worst possible thing you can do.
Charlie Bilello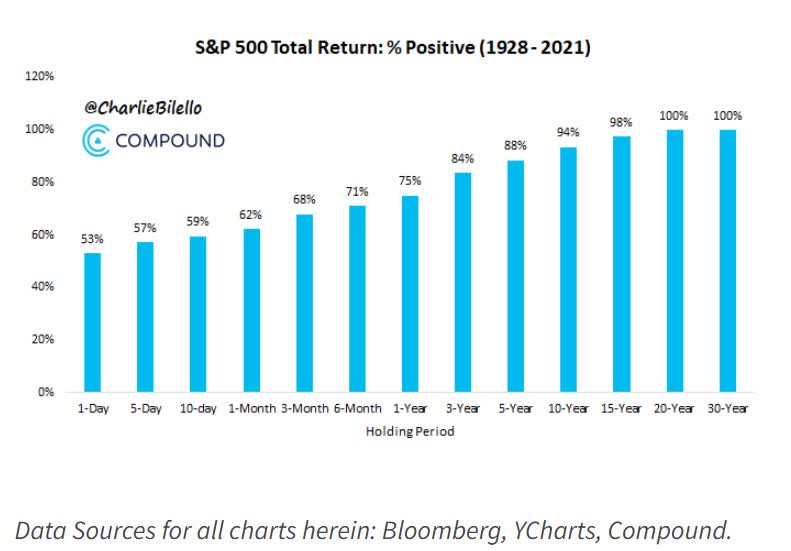
Over the long-term blue-chip stocks always go up.
Charlie Bilello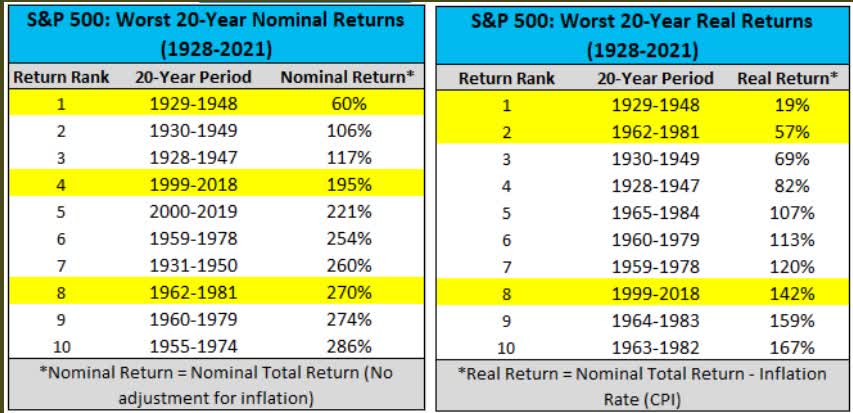
Not even during the Great Depression did investors lose money over 20 years, even adjusting for inflation.
Unless you think we’re headed for something worse than the Great Depression, over the long-term stocks are one of the only sure things on Wall Street.
- over the long-term
- in the short-term stock prices can go down…a lot
JPMorgan Asset Management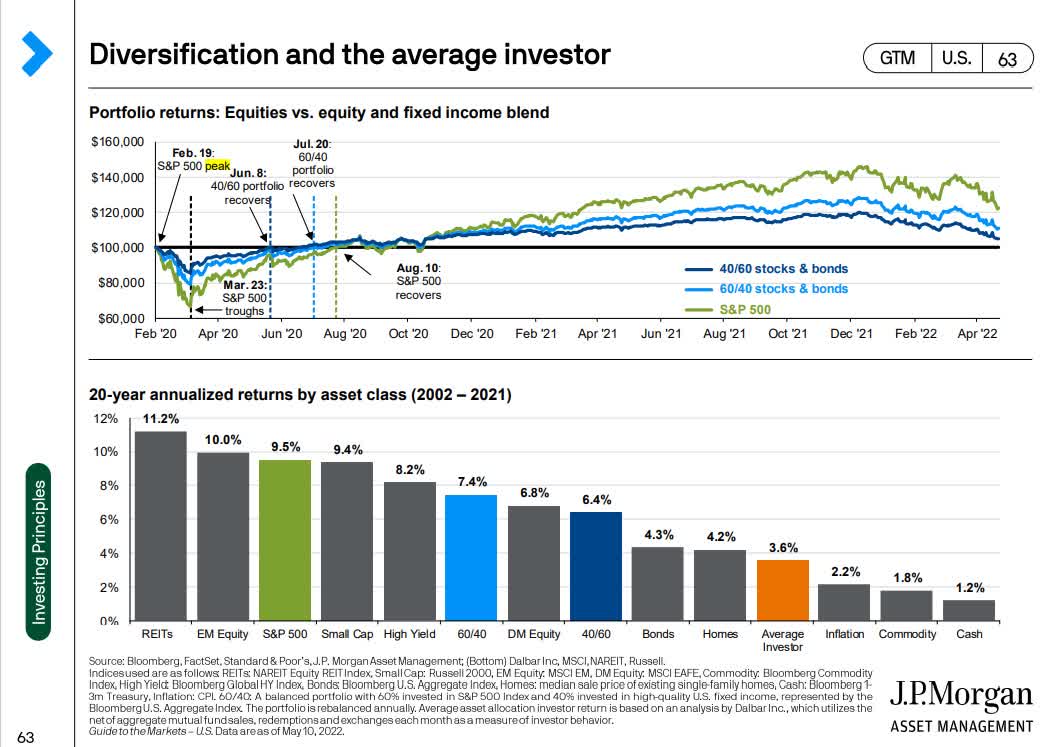
This is what market timing gets you, significantly lower returns than just riding out these inevitable bear markets.
Altria is a great example of how defensive, recession-resistant dividend kings can help minimize the pain during bear markets.
- MO is flat in 2022 vs the S&P’s 23% decline
Don’t get me wrong, I’m not saying that MO is going to soar in the short-term.
With credit markets starting to crack, and recession risk rising steadily with each passing month, few things are going to actually go up if stocks keep selling off.
- oil is falling
- commodities are falling
- bonds (for the moment) are falling
- gold and silver are falling
- blue-chips are falling
- crypto is crashing
It’s a risk-off environment and that might continue for a few more weeks or even months.
But always remember that bear markets don’t bottom because bad news stops coming, but when stocks fall low enough to price in all the bad news that’s likely coming down the road.
And here’s what I can tell you about MO with high confidence.
- MO is one of the world’s safest, most dependable, and highest quality companies
- 7.9% very safe yield = 4X more than the S&P 500
- 8.5% yield with the August dividend hike coming (7% consensus hike)
- 13.9% CAGR long-term consensus return potential (more than aristocrats and S&P)
- 33% discount to fair value = potential very strong buy
- 8.5X cash-adjusted PE, anti-bubble blue-chip
- 140% total return potential over the next five years, 3X the S&P 500
- about 162% of the risk-adjusted expected returns of the S&P 500 over the next five years
- the market might sell off hard through June 21st, so be ready to buy (or at least not panic) either MO or any blue-chip bargain on your correction list
Altria is the best-performing stock in history, and anyone buying today has a realistic chance of doubling their money in the next three years.
More importantly, if analysts are right, and MO hikes its dividend 7% in August, that’s an 8.5% very safe yield you’re locking in, along with nearly 14% long-term return potential.
That’s not just a mouth-watering yield that can help pay the bills today, it’s also the kind of long-term returns that rich retirement dreams are made of.
This is why, for the five reasons outlined in this article, MO is an 8% yielding table-pounding great dividend aristocrat buy.
Be the first to comment