

Urupong
In Q2 2022, the Alta Fox Opportunities Fund (“the Fund”) produced a gross return of -8.46% and a net return of -8.66%. The Fund’s average net exposure during the quarter was 73%. Since inception in April 2018, the Fund has produced a gross return of 505.72% and a net return of 330.36% compared to the S&P 500’s return of 54.52% and the Russell 2000’s return of 17.91%.
|
Alta Fox Opportunities Fund, LP |
Relevant Index Returns |
|||
|
Gross Return |
Net Return |
S&P 500 (SPY) |
Russell 2000 (IWM) |
|
|
Q2 2022 |
-8.46% |
-8.66% |
-16.10% |
-17.20% |
|
YTD |
-19.18% |
-19.53% |
-19.96% |
-23.43% |
|
Since Inception |
505.72% |
330.36% |
54.52% |
17.91% |
|
Annualized |
52.78% |
40.97% |
10.78% |
3.95% |
Alta Fox Opportunities Fund, LP: Net Performance

As always, Alta Fox strives to ignore short-term price fluctuations and instead focus on the intrinsic value growth in our portfolio holdings, which should converge with portfolio performance over time. We encourage limited partners to do the same both in times of outperformance and underperformance. I firmly believe that in the long run, our strategy of buying high-quality and underfollowed businesses at cheap prices will deliver attractive absolute and relative returns. Most importantly, our process remains disciplined with strict risk controls, minimal gross leverage, and a sound research process.
Market Commentary and Alta Fox Historical Upside/Downside Capture
With a ~20% decline, the first half of 2022 marked the worst first half of a calendar year for the S&P 500 since 1970. In the first half of this year, there have been few places to hide as every S&P 500 subsector, except for energy, produced negative returns. Technology and consumer discretionary stocks were hit particularly hard, with those sectors declining roughly 30% during the same period.
As a long-biased strategy with meaningful consumer and technology exposure, it is not surprising that Alta Fox also had a difficult first half of 2022 in such a difficult macro-driven market. We will never be content with losing money, but we believe that in this type of market, it is critical to limit mistakes, stick to our process, and prevent outsized and permanent losses of capital. We remain carefully optimistic by reminding ourselves that market drawdowns and volatility help create exceptional long-term idiosyncratic opportunities for patient and selective investors.
As a reminder, the Alta Fox Opportunities Fund’s strategy is not designed to make money in all market environments but instead aims to outperform broader indices over the long term. The chart below displays the Alta Fox Opportunities Fund’s monthly net returns (x-axis) and the S&P 500’s monthly total returns (y-axis) since the Fund’s inception. A data point on the chart lying on the 45degree dashed line indicates a month where the Fund’s performance was in-line with that of the S&P 500. As one can see, since inception, the Fund has generally lost less than market indices in negative months and returned significantly more in positive months. It is difficult to deny that a strategy that limits downside capture during negative periods and outperforms during positive periods is a recipe for long-term success.
Monthly Gross Return Since Inception Alta Fox Opportunities Fund, LP (y-axis) vs. S&P 500 (x-axis)
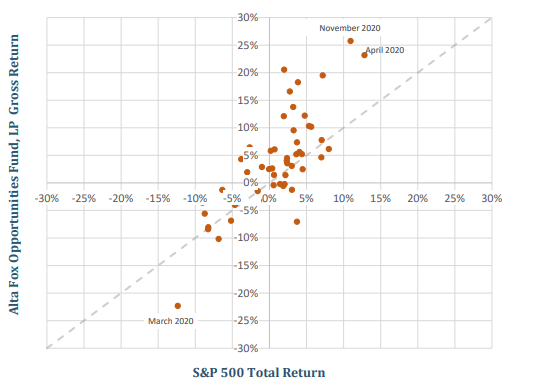
Note: The S&P 500 is a U.S. only equity index and is compared to Fund performance for informational purposes only. Returns for the indices are total returns which includes dividends and do not reflect the deduction of any fees or expenses which would reduce returns. Alta Fox chose to display the upside/downside capture relative to the S&P because it has outperformed the Russell 2000, acting as a more difficult benchmark over the relevant time period. A similar analysis was performed against the Russell 2000 and findings are available upon request.
As summarized in the table below, the Alta Fox Opportunities Fund has historically outperformed the S&P 500 in both up and down markets since inception in overall magnitude (displayed as capture) and frequency. We attribute this outperformance to a strong research process that has had significant alpha on the long and short sides of the portfolio combined with a conservative approach to portfolio management. Since inception, our average gross exposure has been less than 100% and we are comfortable holding cash if we are not finding attractive securities that meet our underwriting standards.
|
Alta Fox Opportunities Fund, LP (AFOF, LP) | Inception to Date Capture Ratios |
|||
|
Positive Months |
Negative Months |
Total |
|
|
Gross Return Capture |
190% |
73% |
– |
|
Net Return Capture |
162% |
72% |
– |
|
# of Months |
35 |
16 |
51 |
|
# of Months: AFOF, LP > S&P 500 |
22 |
11 |
33 |
|
# of Months: AFOF, LP < S&P 500 |
13 |
5 |
18 |
|
% of Total: AFOF, LP > S&P 500 |
63% |
69% |
65% |
|
Note: Upside/Downside capture ratios presented are inception to date and are calculated by dividing the geometric average return for the Fund by the geometric average return for the S&P 500 for the positive and negative months, respectively. Positive Month periods are determined as months where the S&P 500 produced a positive return. Negative Month periods are determined as months where the S&P 500 produced a negative return. Alta Fox chose to display the upside/downside capture relative to the S&P because it has outperformed the Russell 2000, acting as a more difficult benchmark, over the relevant time period. A similar analysis was performed against the Russell 2000 and showed that in Positive Months, Gross and Net Return Capture have been 174% and 149%, respectively. In Russell 2000 Negative Months, Gross and Net Return Capture were each 48%. |
|||
While reviewing and analyzing performance data is helpful and especially important in a challenging market, we prefer to take a multi-year view of performance while independently assessing our process in the short run. This approach helps us avoid overly focusing on short-term performance and should result in better long-term decision-making.
Year to Date Process Review
Coming into 2022, we had a cautious view of overall market conditions. Despite this view, we had a very high level of net exposure and an inadequate short book. This was a mistake in portfolio management for which we have no adequate explanation besides the fact that we believed that our collection of profitable, competitively advantaged businesses would be able to buck even a weak market and deliver strong performance.
Year to date, the fundamentals of our portfolio companies have generally performed in line with our expectations, and we have avoided the frothiest areas of the market. Unfortunately, this has not been enough to offset significant broader market pressure. We believe an objective review of our process (attempting to remove any hindsight bias) would conclude that we should have had meaningfully lower net exposure with a larger short book heading into the year.
This positioning would have more accurately depicted our cautious market view described in our Q4 2021 letter. Even in that scenario, we would have lost money in this market environment but likely could have limited losses to single digits instead of nearly 20%.
While we are, of course, reviewing the various things we could have done differently to generate better results in the first half of the year, we are also proud of our strong and repeatable research process that we have not deviated from despite a difficult market. So far this year, Alta Fox’s research team has done a great job of identifying many attractive and idiosyncratic theses. Some of these have paid off already and many have reached what we believe are extremely attractive prices.
Heading into Q3, we are increasingly confident that our portfolio companies are poised to generate strong forward IRR’s and believe now is an attractive time to deploy capital with a medium to long-term time horizon.
Notable YTD Contributor and Detractor
Our most notable winner year to date has been LeoVegas (OTCQX:LEOVF), a leading online gambling company in Sweden. We identified the company as a highly strategic asset in an attractive market growing organic revenue low double digits with significant margin upside while trading at an approximate 8% free cash flow yield. In addition, the company was returning cash to shareholders via a significant dividend and share buybacks. We quickly became a top three shareholder and began to explore a variety of value-creation opportunities.
Subsequently, MGM made an offer to purchase the entire business at a 47% premium to the latest trading price. While this was a nice contribution to the Fund, it was also bittersweet as we believed that LeoVegas still had many excellent years of value creation ahead as a standalone business.
Hasbro (HAS) is the most frustrating detractor of 2022 year to date. Alta Fox has done exhaustive diligence on all segments of the company’s operations. We ran an activist campaign to unlock the company’s significant hidden value and improve capital allocation and governance. Rather than embrace an enthusiastic shareholder’s views and use it as an opportunity to highlight the value in their Wizards of the Coast segment, Hasbro’s Board decided to aggressively downplay the value of its key asset to maintain the status quo conglomerate structure that has failed shareholders for over half a decade.
This was a disappointing decision by a Board that is supposed to act in shareholders’ best interests and the stock has drifted back to five-year lows after the disappointing proxy contest result.
With an aggressive and self-defeating defense, Hasbro’s Board entrenched itself and bought themselves another year primarily due to the recent appointment of a new CEO, Chris Cocks. We are supportive of the new CEO and hope the company can meaningfully reverse the underperformance experienced by investors over the last five years. We are confident that even though our activism has not immediately generated the board turnover we wanted, it has still led to positive change andbenefited all shareholders.
Moreover, at this point, the company needs to show meaningful total shareholder return improvement over the next year or investors are likely to demand a change to the status quo. We continue to believe that Hasbro has an incredible collection of assets that are underappreciated by the current market and with the right incentives and decisions by leadership, the company is worth meaningfully more than the current stock price implies. We look forward to continuing to engage with the Board and management team to drive focus on value creation over the coming year
Opportunity Set Going Forward
Our general market view remains unchanged from our Q1 2022 commentary. We continue to believe that there were several bubbles that formed last year, and many have violently popped this year. Technology companies (and particularly unprofitable ones) have been hit particularly hard with many stocks down 80%+ year-to-date. Many of these beaten down companies have unproven business models and are still completely uninvestable by Alta Fox standards.
However, others have excellent business models that we have long admired but have not been able to justify owning them on an IRR-basis due to frothy valuations. Some of these companies now look quite interesting because, at current prices, we can underwrite to attractive IRR’s on a medium-term basis even while using traditional profitability multiples (rather than revenue multiples, which we are rarely fond of).
Our research process and objective also remain unchanged: we are looking for the highest-quality businesses at prices supporting IRRs of 20%+ on a medium-term basis with reasonable to conservative underlying assumptions. The recent market decline has significantly expanded our potential investable universe because valuation multiples have now come down to reasonable levels for more great businesses.
On the short side of the portfolio, we have been growing a modest short book composed mostly of low-quality businesses that have destroyed value over long periods of time but have risen to frothy prices recently due to unsustainable supply/demand imbalances. The market’s enthusiasm in underwriting elevated multiples on what likely represents peak earnings power presents attractive short opportunities in the current market. As always, we are very risk averse on the short side and typically avoid “crowded shorts” with high short interest.
The market’s 1H22 selloff has allowed us to revisit businesses and industries that we know extremely well at compelling valuations. Throughout most of our portfolio, our forward earnings estimates have been roughly in-line with expectations while the multiple has been reduced significantly. We have adjusted exit multiple assumptions to be in-line with market conditions, but despite this, most of our portfolio companies still have very strong forward IRR estimates. A few examples of the strong businesses that we own and are excited about right now are below.
Everbridge Inc (EVBG)
Everbridge is an enterprise SaaS business that provides mass notification and critical event management (CEM) software in a world with increasing risks (natural disasters/weather, civil unrest, pandemic, active shooters, etc). The software allows large corporates to better manage employees and assets during times of disruption. Everbridge serves 47 of the Fortune 50, has 110%+ net revenue retention, gross margins approaching 80%, and EBITDA margins that are beginning to meaningfully inflect higher. This is a great business.
However, the stock has always been far too expensive for us to underwrite to acceptable IRR thresholds within a reasonable valuation framework. As recently as late last year, investors were willing to pay ~14x forward revenue for Everbridge as the stock price topped out at ~$160/share. The sudden departure of the company’s CEO in December 2021 as well as forward guidance below the Street’s lofty expectations, prompted a precipitous fall in EVBG’s share price.
In December, when Everbridge’s former CEO left to take the CEO role at a large PE-backed cloud business, he likely knew that EVBG trading at 14x revenue with slowing growth meant limited upside ahead (and limited personal wealth creation).
Since the CEO’s departure and decline in stock price, a prominent activist investor has taken a stake in the business and is advocating that the board initiate a process to sell the business. Given investors have lost confidence in the management team and board’s ability to create long-term value in the public markets, we agree that the company should immediately pursue a sale.
We believe the quality of the business along with the upside potential for profit margins and the current valuation make Everbridge an extremely attractive target for private equity buyers who are currently sitting on substantial amounts of dry powder. Orlando Bravo, the co-founder of tech PE giant Thoma Bravo said it best during his appearance on CNBC on May 24: “For us in private equity, as a buyer and operator of software companies, this environment of five times forward revenue is the buying opportunity of a lifetime.”
We believe the CEO departure, two disappointing 2022 guides, and broader market volatility have put Everbridge into the penalty box. Current sell-side expectations appear far too low, as consensus assumes the company will grow revenue 16% in 2023 and EBITDA margins will expand to 12.5%.
The company’s Co-CEO clearly believes the business will perform better than sell side expectations, as he stated the following at an investor conference in May: “Wouldn’t be surprised if next year, there’s a quarter where adjusted EBITDA margin starts with a two and ultimately, we’ll see where that top line growth rate shakes out. If it looks like we’re going to be growing in the mid-teens, then we will drive adjusted EBITDA towards mid-20s, maybe even 30%.”
Today, EVBG is valued at ~3x consensus 2023 revenue (which appears low) with the stock at ~$30/share, down more than 80% from its 2021 highs. At ~3x forward revenue, investors can buy a high-quality enterprise software business with sticky and recurring revenue, inflecting margins, and a potential take-private catalyst. While we believe a sale of the company is in the best interest of all stakeholders, even if the company stays public, we estimate investors can achieve a ~30% IRR over the next several years as Everbridge’s EBITDA margins expand to the mid-30s and assuming a modest 13x EBITDA multiple.
XPEL Inc. (XPEL) and NeoGames SA (NGMS) – Returning to Past Winners
XPEL and NGMS are businesses that Alta Fox has followed and owned for years. In mid-2021, we reduced our positions in both on valuation concerns but have since added to our positions significantly in 2022. Compared to mid-2021, we believe each idiosyncratic growth thesis is largely unchanged (if not improved), yet our view of valuation has gone from extremely expensive to extremely cheap. Remaining disciplined on valuation is a key tenant of our investment strategy and has allowed us to add with confidence to both businesses in 2022 despite macro noise.
XPEL, Inc.
Our conviction in the improving availability of semiconductors for auto OEMs has only increased since Q1, as demand for semis from other industries has declined considerably on the back of weakening consumer demand for electronics and prolonged recession fears. Unlike previous recessions, we believe that this time around auto vehicles sales will increase meaningfully over the prior period due to all-time-low dealer inventories and backlogged consumer demand for new cars – a significant tailwind to accelerate XPEL’s sales and earnings growth in the 2H 2022 and into 2023.[1]
We believe XPEL is an excellent business trading at close to trough multiples on consensus numbers that we believe are too conservative.
NeoGames SA
Since Q1 of this year, several improvements to the fundamental thesis have emerged. Over the last twelve months, NGMS had a significant headwind as their largest market, Michigan, showed monthly revenue declines after more competitors entered the iCasino market. However, our channel checks suggest that Michigan’s iLottery sales have returned to a position of growth in Q2 and we believe this headwind now provides easy comparisons for the next year.
NeoGames also recently announced its first full-service iLottery & sports betting contract win in Brazil and will be supporting the Loteria Mineira, the official state lottery of Minas Gerais, Brazil’s second largest state with a population of ~21M.[2] Our preliminary estimates suggest this contract could represent more than 75% of the value of the Michigan contract at maturity which we estimate would translate into a >15% uplift to 2021’s pro forma EBITDA number. While it will take time for this contract to reach maturity, the win increases NGMS’ strategic value as the dominant and best-in-class iLottery provider globally.
The ability to buy a stake in the leading global digital lottery provider with 20% organic revenue growth, EBITDA leverage, and significant insider ownership at less than 7x our 2024 earnings per share estimate seems extremely attractive.
Business Updates
In Q2 2022, we welcomed new colleagues to the Alta Fox team, including Alec Lucente (Analyst) and Garrett Parker (Senior Controller), adding to our capabilities on both the research and operations teams. Alta Fox has historically been very transparent in the sharing of our public letters. However, given our increased level of engagement with both public and private companies, it is likely that future quarterly letters will not be publicly available.
Conclusion
We are humbled that you have elected to invest a portion of your assets with Alta Fox. We continue to strive to improve all aspects of our research and operational processes in our pursuit of building a world-class investment firm.
Sincerely,
Connor Haley
APPENDIX: HISTORICAL PERFORMANCE FIGURES
|
Alta Fox Gross Return |
Alta Fox Net Return |
Alta Fox Net Exposure (Avg) |
|
|
Q2-2018 |
7.82% |
6.05% |
79.31% |
|
Q3-2018 |
17.12% |
13.68% |
85.44% |
|
Q4-2018 |
-13.57% |
-11.52% |
77.23% |
|
2018 |
9.13% |
6.67% |
80.66% |
|
Q1-2019 |
35.41% |
28.10% |
83.00% |
|
Q2-2019 |
12.39% |
10.23% |
83.45% |
|
Q3-2019 |
-2.21% |
-2.10% |
79.07% |
|
Q4-2019 |
9.96% |
8.29% |
77.86% |
|
2019 |
63.63% |
49.70% |
80.84% |
|
Q1-2020 |
-26.77% |
-26.98% |
75.12% |
|
Q2-2020 |
66.65% |
60.47% |
75.17% |
|
Q3-2020 |
37.38% |
30.77% |
85.36% |
|
Q4-2020 |
58.32% |
50.44% |
85.86% |
|
2020 |
165.41% |
130.52% |
80.37% |
|
Q1-2021 |
26.24% |
20.78% |
93.70% |
|
Q2-2021 |
21.75% |
17.93% |
83.75% |
|
Q3-2021 |
-0.91% |
-0.99% |
75.58% |
|
Q4-2021 |
3.82% |
3.04% |
76.48% |
|
2021 |
58.11% |
45.30% |
82.38% |
|
Q1-2022 |
-11.71% |
-11.91% |
79.83% |
|
Q2-2022 |
-8.46% |
-8.66% |
73.18% |
|
YTD 2022 |
-19.18% |
-19.53% |
76.50% |
Footnotes
Editor’s Note: The summary bullets for this article were chosen by Seeking Alpha editors.
Be the first to comment