

maybefalse
Q3 recap and investment thesis
Alibaba (NYSE:BABA) just released its Q3 2022 earnings report (“ER”). Note that its fiscal quarter is shifted from the calendar quarter (so it is its FY Q2). And in the remainder of this article, I will refer to the calendar quarter consistently. By this time, many of the aspects of its Q3 ER have been detailed by other SA authors already. As a result, I will only provide a brief recap of its Q3 results. Then I will quickly zoom in on three things that are less discussed so far in other SA articles.
Overall, I view the results as solid, especially considering the challenging operating environments in the past quarter. Its Non-GAAP EPS (referred to on a per ADS basis hereafter) dialed in at $1.82, exceeding consensus estimates by $0.17. Topline came in at $29.12B, representing a +3.0% YoY growth but missing consensus estimates slightly by $490M (about 1.6% on a relative basis). Notably, its cloud segment grew 4% YOY and now represents 10% of the total revenue.
Source: BABA Q3 ER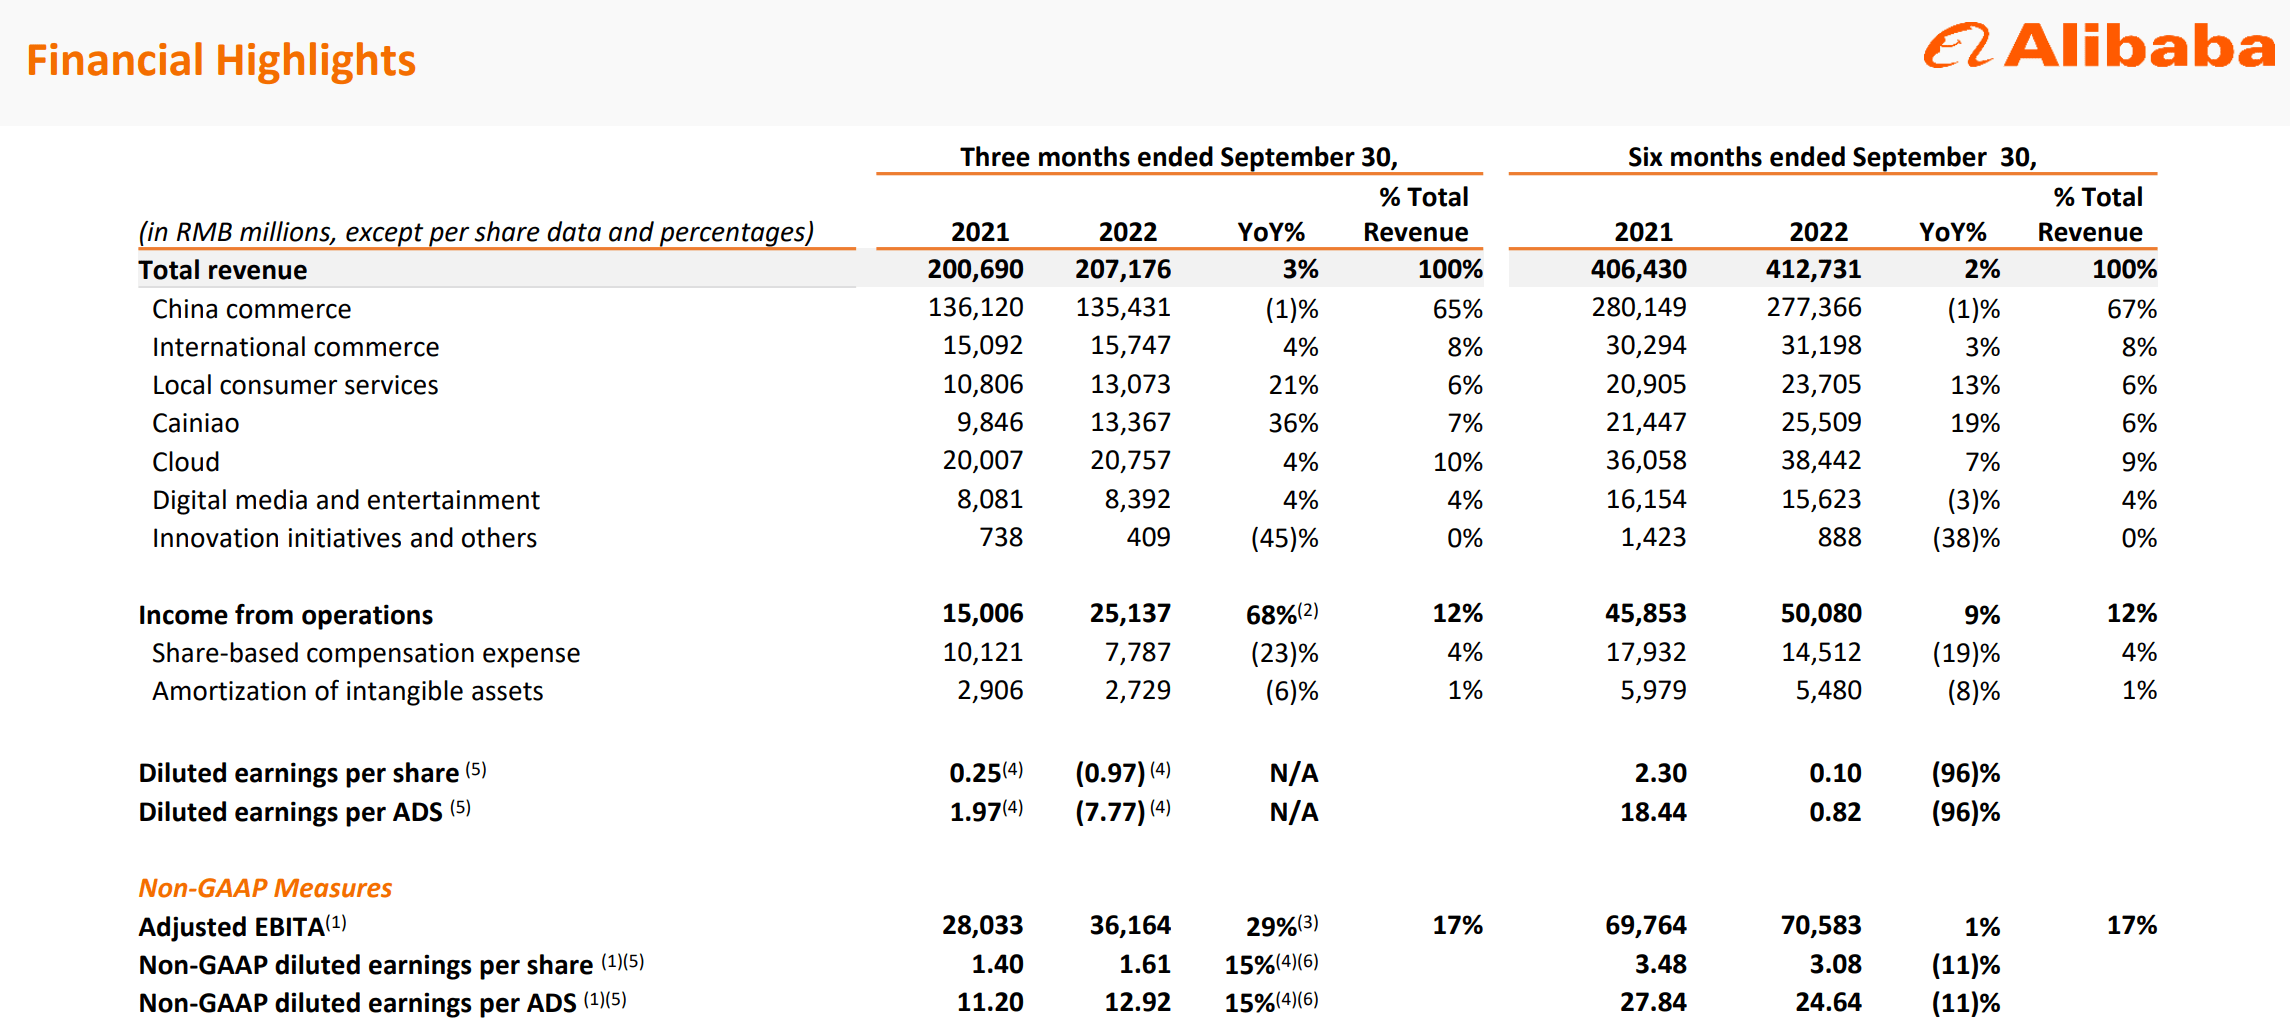
The remainder of this article will concentrate on 3 things from its Q3 ER that are less discussed in other articles. Firstly, I will examine its profitability as measured by ROCE (return on capital employed). You will see that its profitability indeed has suffered strong headwinds due to ongoing macro challenges, but still remains at a highly competitive level even when benchmarked against the FAAMG group. Secondly, I will examine its capital allocation. And the picture is similar here. Admittedly, it simply does not enjoy the flexibility it used to even compared to the beginning of the year. But overall, it is still in a strong financial position and can sustainably fund its various growth initiatives. And finally, the valuation is too compressed to ignore in my view.
Before we dive in, note that the Daily Journal Corp. recently also disclosed its 13F filing. And as shown in the chart below, Alibaba remains as the 3rd largest position, representing 14.6% of its equity portfolio. And I can see why Munger remains unfazed after we examine the financials more closely next.
Source: Dataroma.com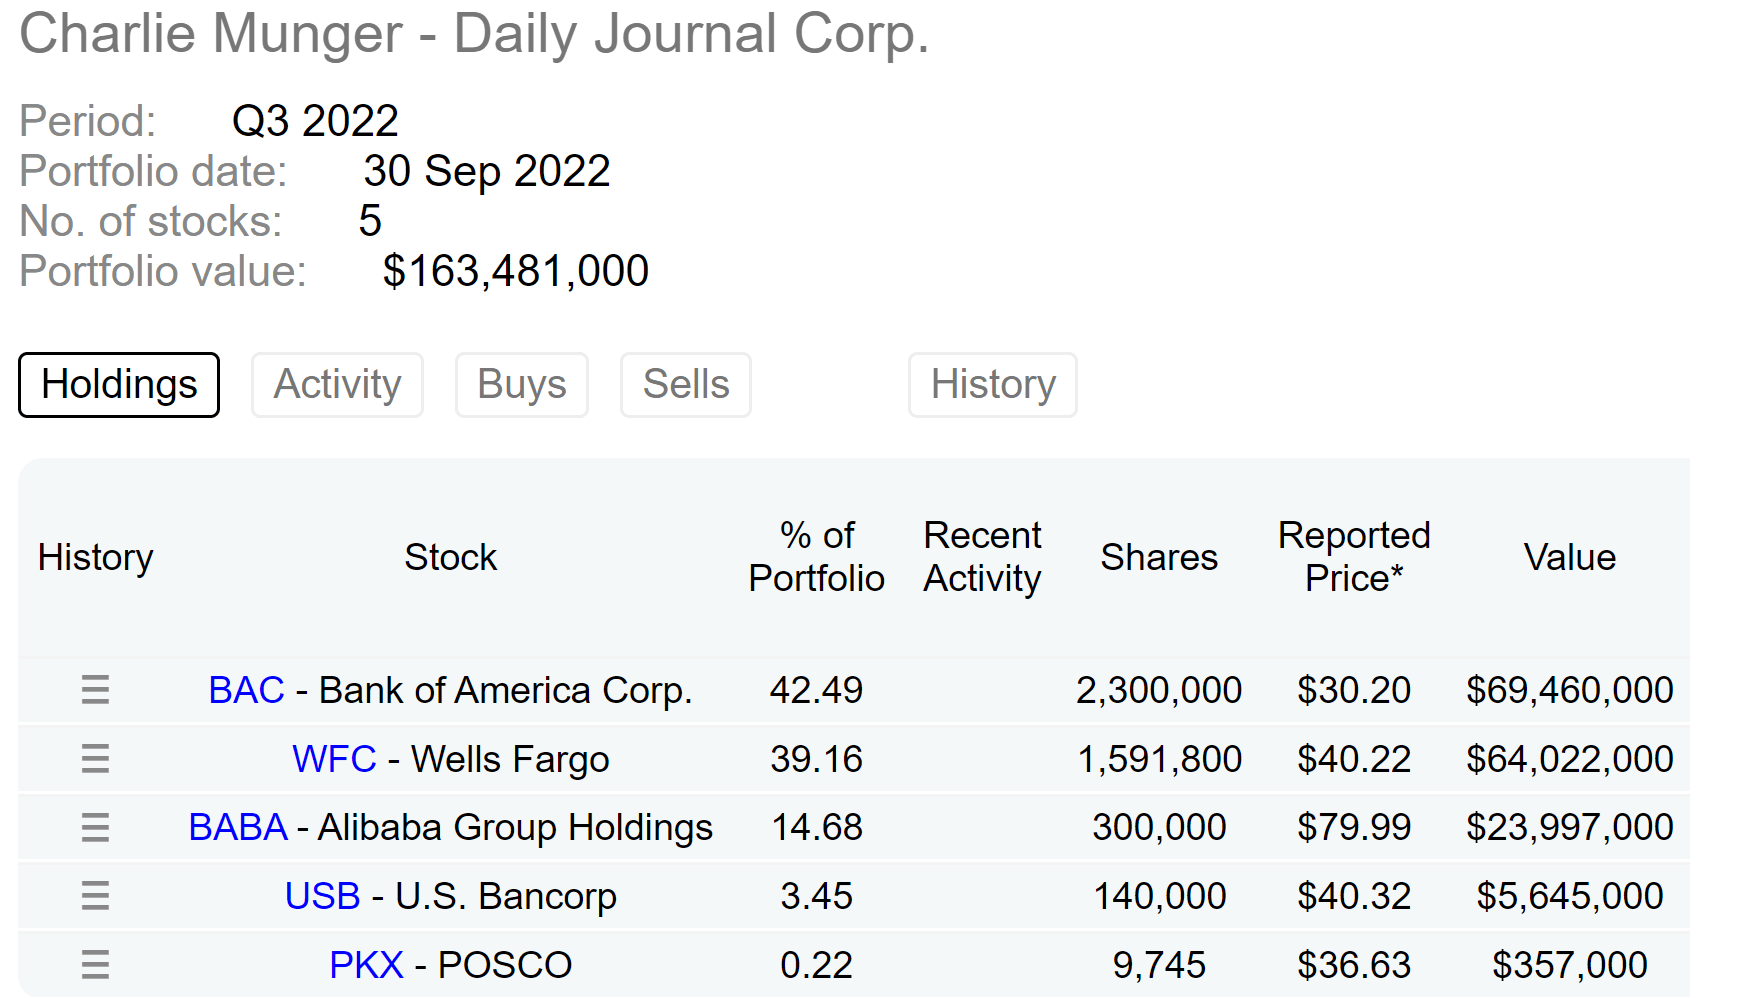
Profitability remains competitive
As detailed in my blog article, for a long-term business owner, return on capital employed (“ROCE”) is the most important metric in my mind. And BABA’s ROCE is shown below. The chart plots its ROCE dating back to 2014 and specifically highlights the changes in its ROCE in 2022 (the last two data points on this chart). As you can see, its profitability indeed has suffered strong headwinds due to ongoing macro challenges. To wit, even as recent as Q1 2022, its ROCE hovered around 97% based on quarterly TTM financials. But due to the various headwinds (both macroeconomic and regulatory as to be elaborated later), its ROCE has contracted substantially to the current level of 62.4% based on the Q3 TTM financials.
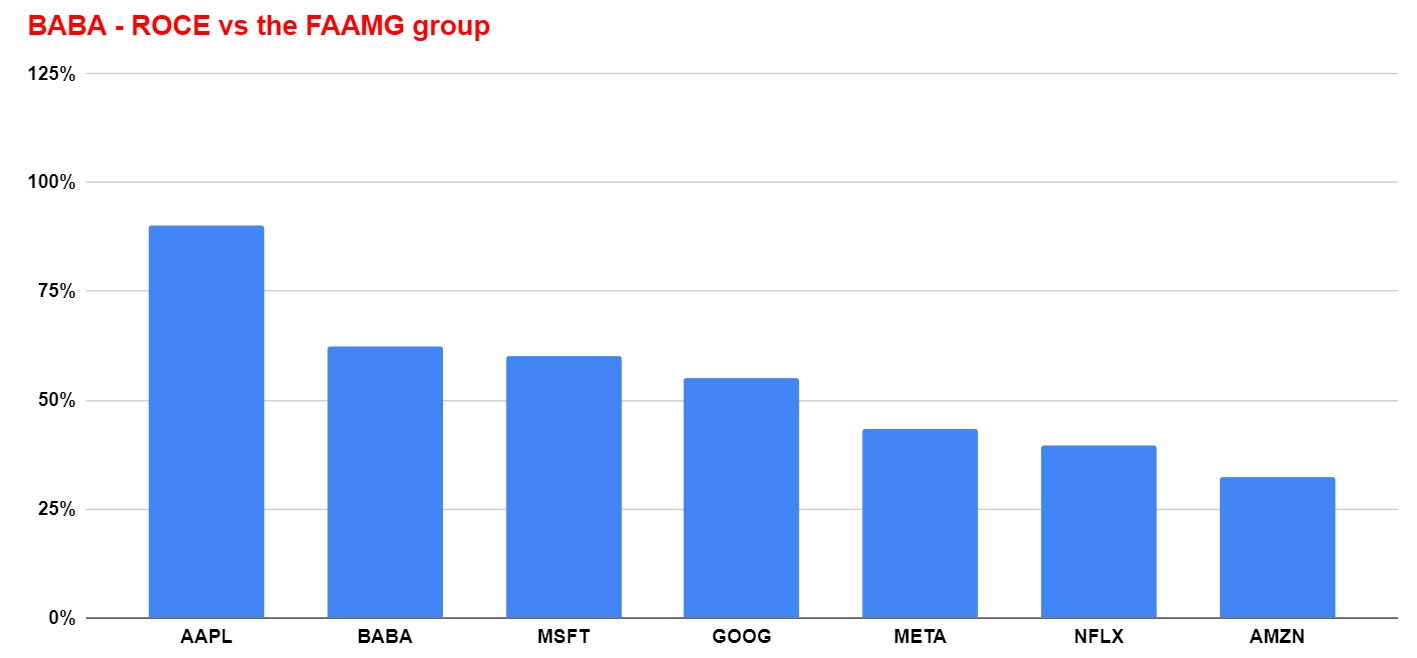
However, BABA’s current ROCE still remains at a highly competitive level even when benchmarked against the FAAMG group as you can see from the second following chart below. As a matter of fact, its current ROCE is only behind Apple (AAPL) in this group.
Source: author and Seeking Alpha. Source: author and Seeking Alpha.
Capital allocation flexibility remains strong too
BABA has always been in a strong financial position. Its financial position may be a bit weaker than it used to be due to its commitment to the common prosperity funds, high tax rates, and regulatory changes. To wit, BABA made a pledge of about $15.5B to the Chinese common prosperity fund in the next five years (so about $3.1B per year). At the same time, its TTM operating cash was more than $30.5B as of Q1 2022. And its operating cash flow has decreased to about $20.1B as of TTM Q3, a decrease of more than $10B.
However, under the overall scheme of things, it is still in a quite strong position. It is effectively debt-free (total interest expenses are only about $500M), it does not pay a dividend, and its maintenance CAPEX is really low (total depreciation is only about 10% of its operating income). And it carries a sizeable net cash position (about $10.1 per share) as shown in the table below, by far the highest level relative to a few other stocks (I will explain why I picked this set of stocks next).
And this is a good point to move onto its valuation, particularly the impact of the net cash position on its valuation.
Source: author and Seeking Alpha data.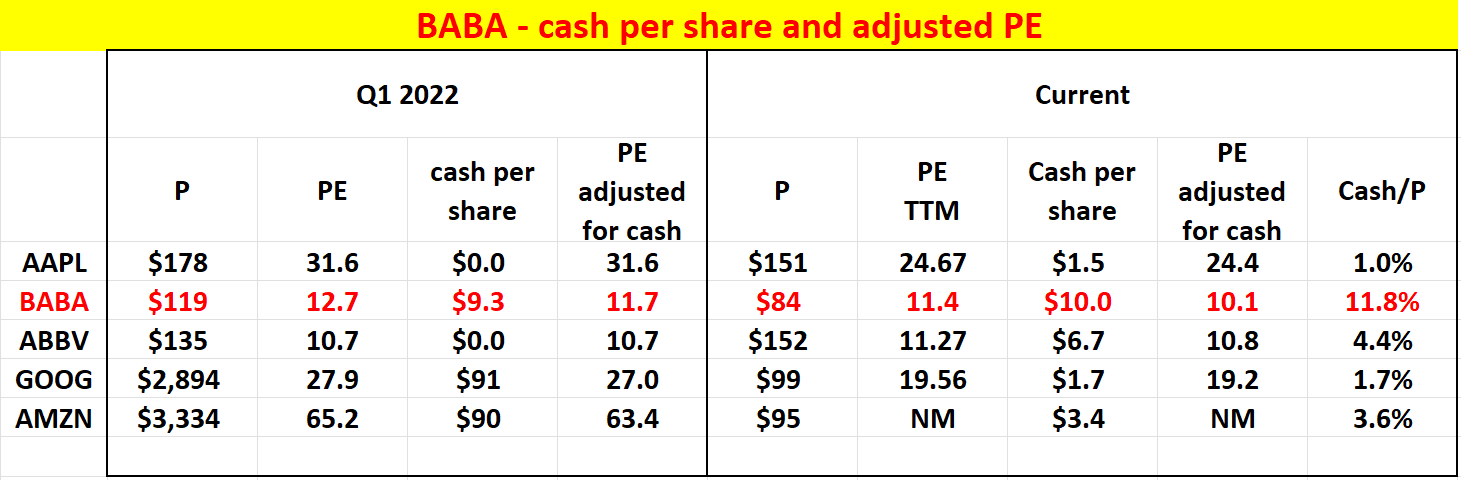
Valuation is even cheaper when adjusted for ROCE
The chart above shows that BABA’s PE is about 11.4x at its current price. Also as aforementioned, there is about $10.0 of cash behind each BABA share, translating into ~11.8% of the current share price. The cash position is actually higher than in Q1 (about $9.3 per share at that time). And adjusted for the cash position, its current PE is only about 10.1x, actually lower than the 11.7x multiple in Q1 despite the decrease in earnings.
Readers familiar with our approach know that valuation shouldn’t be looked at in isolation. It should be always interpreted together with the quality of the business. And that is what the next chart intends to do. These seemingly random stocks picked for this chart represent some of the largest Berkshire (BRK.A) (BRK.B) holdings, and hence, the green dotted line is what I call a Buffett value line. As detailed in my earlier article:
The Buffett’s value line is a line linking A) the origin (a business that has 0 ROCE should worth O PE), and B) Buffett’s largest holding AAPL (which happens to have the highest ROCE among this group of stocks).
Since you always have the choice to buy AAPL, it makes little sense to buy stocks above this line (except for the need for diversification). As seen, BABA now lies below this line (right next to AbbVie (ABBV), another stock we also hold) by a good margin, suggesting a valuation that is more compressed when adjusted for ROCE than on the surface.
Source: author and Seeking Alpha data.
Risks and final thoughts
BABA faces many risks. Potential investors should be cautious of the extreme uncertainties here. As detailed by many SA authors (ourselves included), some risks could lead to 100% loss (such as VIE) or large losses (such as delisting). Here, I will limit my discussions to the risks that are more relevant to business fundamentals and operations. I am cautiously optimistic about the company’s business operation outlook in the next 1 or 2 years. The impact of the COVID-19 restrictions in China remains the largest risk in my view. With China’s Zero COVID policy still in place, customer growth in its China Commerce division (TaoBao and Tmall, to name a few) faces an uncertain recovery path. And so do the overall economic conditions in the country.
To conclude, this article focused on 3 things in BABA’s Q3 ER that are less discussed by other SA authors so far. Its profitability, as measured by ROCE, indeed has suffered strong headwinds, shrinking from ~100% in Q1 to the current 62%. But a ROCE of around 62% is still highly competitive even compared to the FAAMG stocks. Such a robust ROCE, when combined with its capital allocation flexibility, offers healthy growth prospects. For example, its International Commerce Retail segment, including Lazada and AliExpress, offers plenty of upsides. And finally, the valuation, especially when adjusted for its ROCE and sizable cash position, is simply too compressed to make sense the way I see it.
Be the first to comment