

Dan Kitwood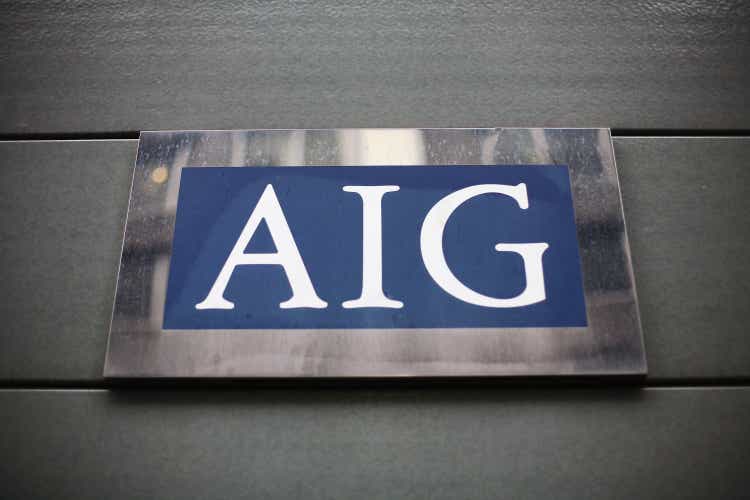
American International Group (NYSE:AIG) reported Q3 results after the market close on November 1, 2022, beating expectations on earnings and revenues. The shares closed at $57.07 on that date, having risen substantially from the 12-month low closing price of $47.48 on September 30th. Since the earnings release, AIG has gained 3.9% and currently trades at $59.31. AIG has returned 6.9% over the past year, as compared to 7.4% for the Diversified Insurance industry group (as defined by Morningstar) and -14.5% for the S&P 500 (SPY).
Seeking Alpha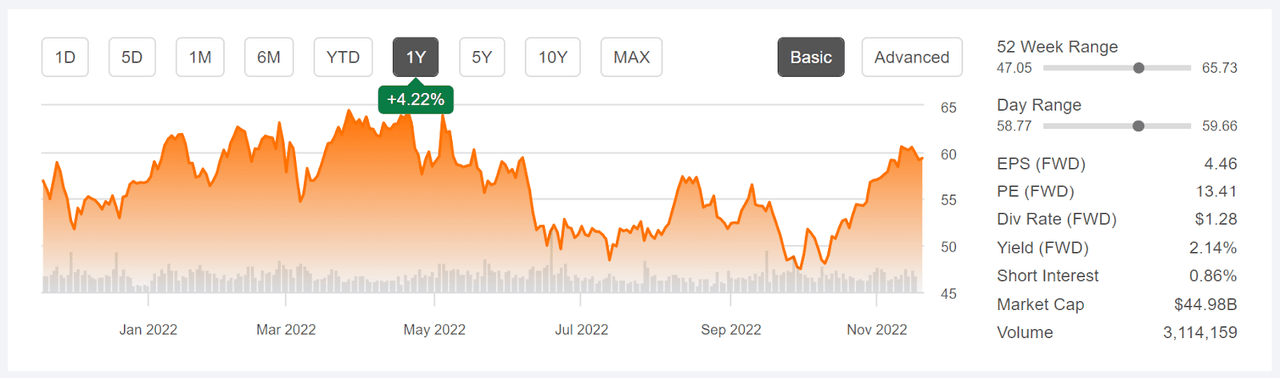
12-Month price history and basic statistics for AIG (Source: Seeking Alpha)
AIG spun out its life insurance and retirement division in an IPO in mid-September of 2022. The new company, Corebridge (CRBG), sells annuities, life insurance, employer retirement plans, and a range of institutional products and services. AIG will now focus on property and casualty insurance lines.
AIG’s Q3 earnings were reduced by the insured losses from natural catastrophes (with Hurricane Ian costing AIG $450 million). Even so, Q3 earnings were well above expectations. A solid upward trend is evident in quarterly earnings over recent years. The consensus outlook for earnings growth is 10% per year over the next 3 to 5 years.
ETrade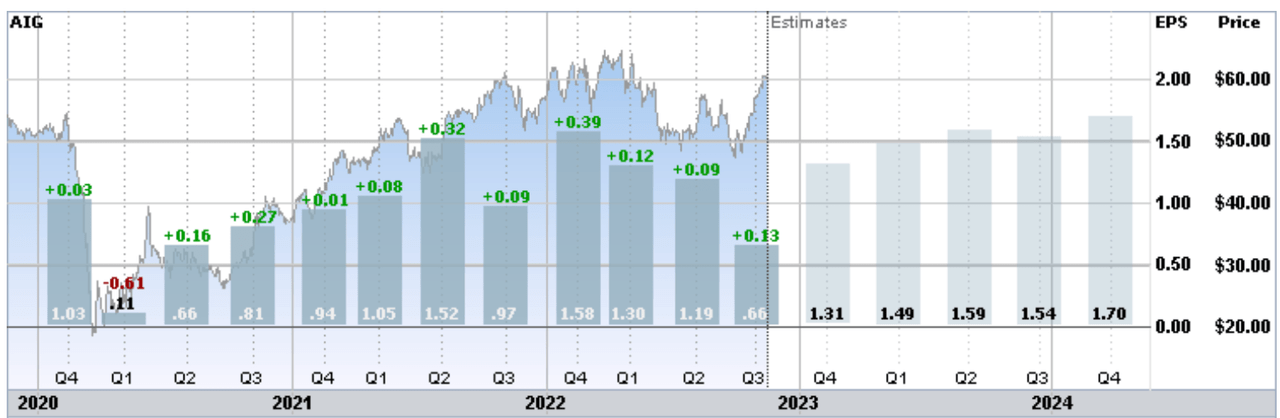
Trailing (3 years) and estimated future quarterly EPS for AIG. Green (red) values are amounts by which EPS beat (missed) the consensus expected value (Source: ETrade)
AIG plans to use some of the proceeds from the Corebridge spin out to fund share buybacks. The company has been consistently buying back shares in recent years, with an authorization for $6.5 Billion in buybacks for 2022 and total buybacks of $6 Billion in 2021.
Insurance companies tend to benefit from rising rates. Increasing interest rates correspond to higher discount rates, reducing the net present value of future liabilities. In addition, rising interest rates make annuities more attractive to consumers. While it is very hard to estimate an insurer’s interest rate exposure from its balance sheet, a research paper from the Chicago Fed (see previous link) notes that “the correlation between changes in an insurer’s stock price and changes in interest rates is an estimate of the interest rate risk faced by the firm.” I have calculated the rolling correlations between total return on AIG and the percentage change in 10-year Treasury yield for the last 2-, 5-, and 10-year periods. The correlation between AIG’s 3-month return and the 3-month change in 10-year Treasury yields, using the last 5 years of data, is 44%, for example.
Geoff Considine
Correlation between total return on AIG and percentage change in 10-year Treasury yield for rolling 1-, 3-, and 6-month periods over the last 2, 5, and 10 years (Source: Author’s calculations using stock price and Treasury yield data from Yahoo! Finance)
These results show that rising bond yields tend to correspond to positive returns for AIG, with the correlation increasing with the return period. The correlation between return and change in bond yield is higher for rolling 6-month returns than rolling 3-month returns. This is consistent with the relationship between yield and return not manifesting instantaneously, which makes sense. The spin out of Corebridge raises the question of whether these results will be representative of AIG’s future performance, of course.
I last wrote about AIG on May 25, 2022, about 5 ¾ months ago, at which time I assigned a buy rating. At that time, prior to the Corebridge spin out, the fundamentals looked reasonable. Rising interest rates were favorable for AIG. The Wall Street consensus rating for AIG was a buy and the consensus 12-month price target corresponded to expected total return of 24% over the next year. The market-implied outlook, a probabilistic price forecast that represents the consensus view from the options market, was neutral with a bullish tilt to mid-January of 2023. The expected volatility calculated from the market-implied outlook was 37% (annualized). As a rule of thumb for a buy rating, I want to see an expected 12-month total return that is at least ½ the expected volatility. Taking the Wall Street consensus at face value, AIG considerably above this threshold.
Seeking Alpha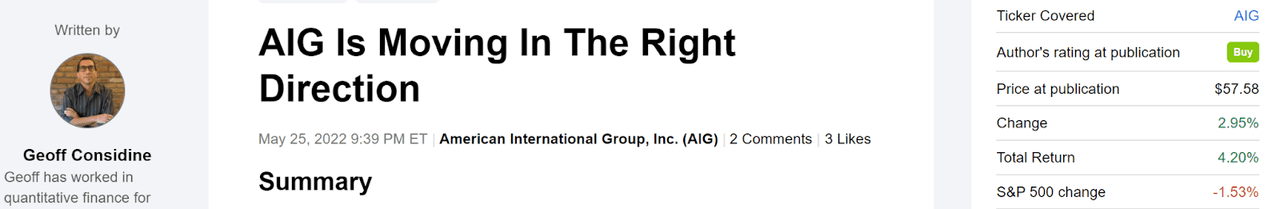
Previous post on AIG and subsequent performance vs. the S&P 500 (Source: Seeking Alpha)
For readers who are unfamiliar with the market-implied outlook, a brief explanation is needed. The price of an option on a stock is largely determined by the market’s consensus estimate of the probability that the stock price will rise above (call option) or fall below (put option) a specific level (the option strike price) between now and when the option expires. By analyzing the prices of call and put options at a range of strike prices, all with the same expiration date, it is possible to calculate a probabilistic price forecast that reconciles the options prices. This is the market-implied outlook. For a deeper explanation and background, I recommend this monograph published by the CFA Institute.
With almost six months since my last analysis, during which AIG reported 2 quarters of results and completed the spin out of Corebridge, I am revisiting my rating. I have calculated updated market-implied outlooks for AIG and compared these with the current Wall Street consensus outlook, as in my previous post.
Wall Street Consensus Outlook for AIG
ETrade calculates the Wall Street consensus outlook for AIG using the views of 11 ranked analysts who have published ratings and price targets within the past 3 months. The consensus rating is a buy and the consensus 12-month price target is 9.66% above the current share price. The consensus rating has been a buy for almost all of the past 12 months.
ETrade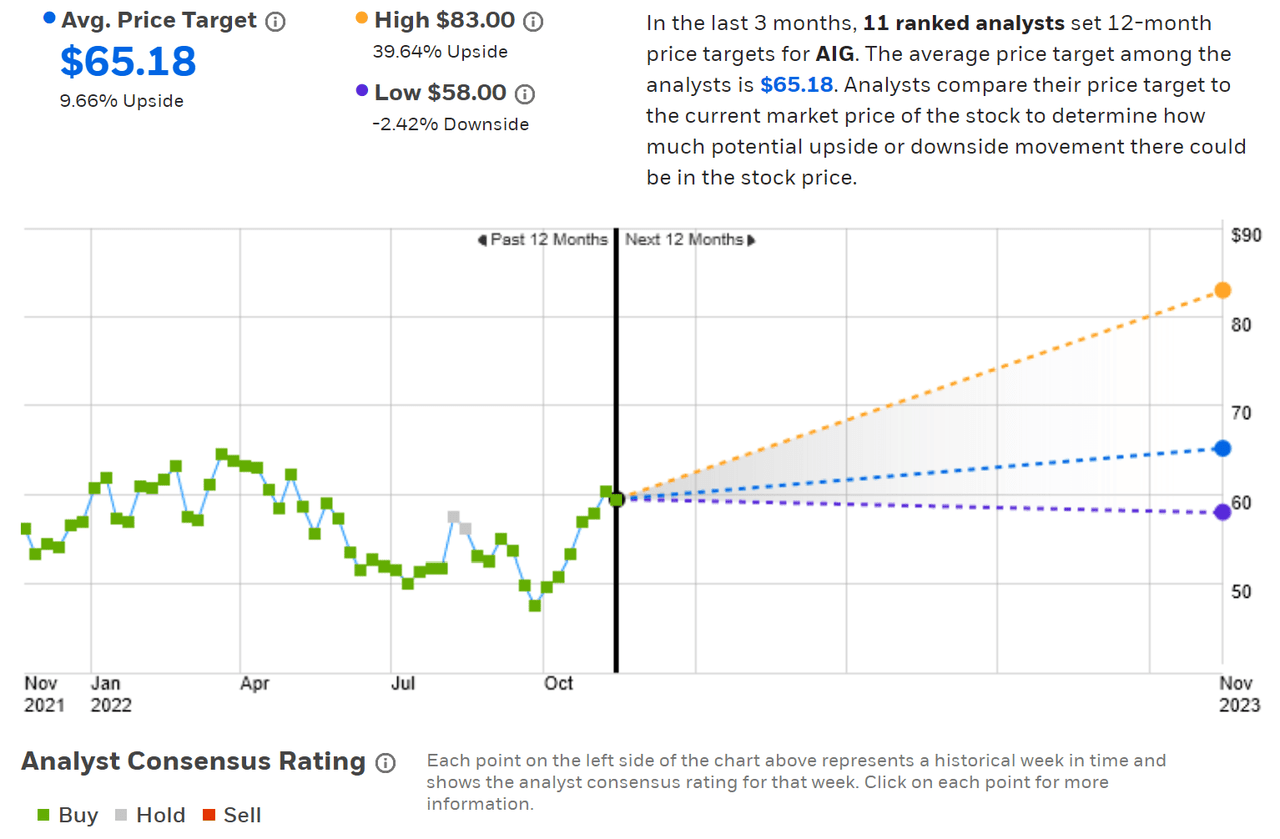
Wall Street analyst consensus rating and 12-month price target for AIG (Source: ETrade)
Seeking Alpha’s version of the Wall Street consensus outlook is calculated using ratings and price targets published by 17 analysts over the past 90 days. The consensus rating is a buy, as it has been for all of the past year, and the consensus 12-month price target is 12.95% above the current share price.
Seeking Alpha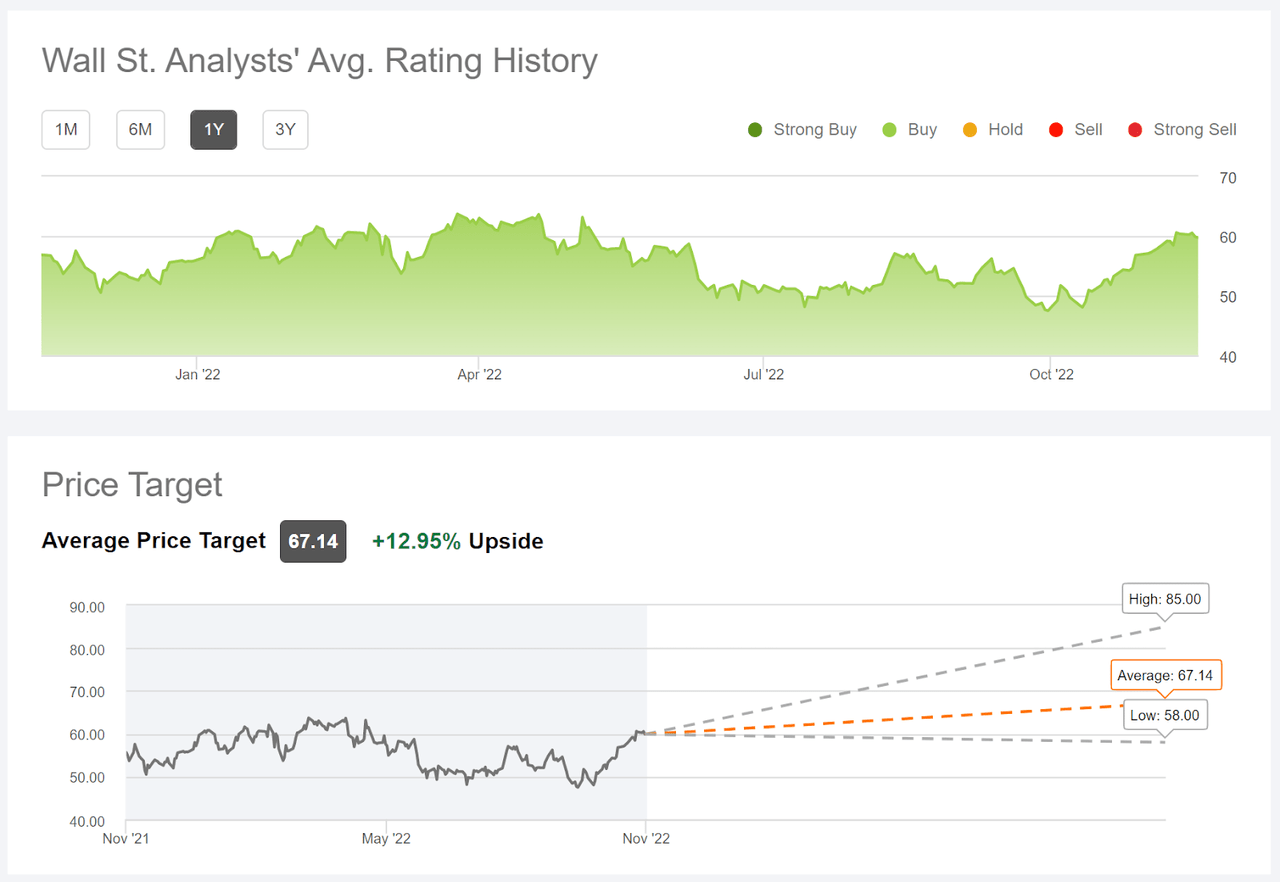
Wall Street analyst consensus rating and 12-month price target for AIG (Source: Seeking Alpha)
In my post in late May, the consensus rating for AIG was a buy, but the consensus price target implied considerably higher returns than is the case today. Averaging the consensus price targets from ETrade and Seeking Alpha, the expected total return for AIG over the next year is 13.4%, as compared to 24% in late May. AIG’s price gains over this period explains part of the difference, with the rest being due to the reductions in the analyst price targets.
Market-Implied Outlook for AIG
I have calculated the market-implied outlook for AIG for the 6.9-month period from now until June 16, 2023 and for the 14-month period from now until January 19, 2024, using the prices of call and put options that expire on these dates. I selected these two dates to provide a view to the middle of 2023 and to the start of 2024.
The standard presentation of the market-implied outlook is a probability distribution of price return, with probability on the vertical axis and return on the horizontal.
Geoff Considine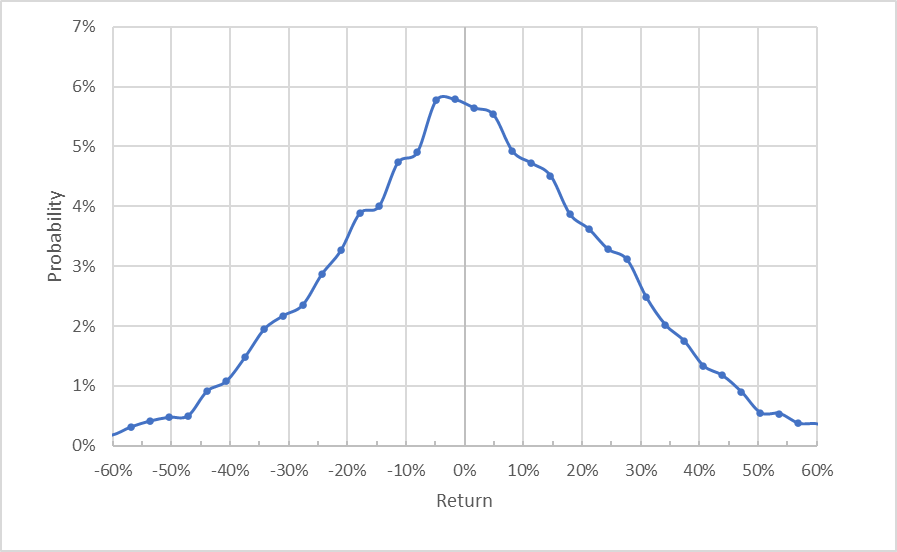
Market-implied price return probabilities for AIG for the 6.9-month period from now until June 16, 2023 (Source: Author’s calculations using options quotes from ETrade)
The market-implied outlook to the middle of 2023 is quite symmetric, with similar probabilities of positive and negative returns of the same magnitude. The expected volatility calculated from this distribution is 33.4%, slightly lower than the value I calculated in late May.
To make it easier to compare the relative probabilities of positive and negative returns, I rotate the negative return side of the distribution about the vertical axis (see chart below).
Geoff Considine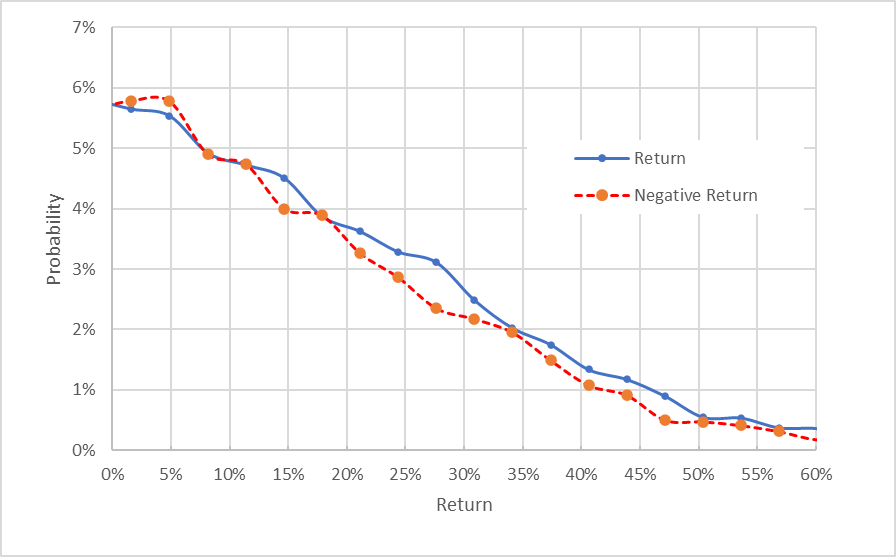
Market-implied price return probabilities for AIG for the 6.9-month period from now until June 16, 2023. The negative return side of the distribution has been rotated about the vertical axis (Source: Author’s calculations using options quotes from ETrade)
This view shows that the probabilities of positive returns tend to be slightly higher than for negative returns of the same size, across a wide range of outcomes (the solid blue line is at or above the dashed red line over almost all of the chart above). This suggests a slightly bullish tilt.
Theory indicates that the market-implied outlook is expected to have a negative bias because investors, in aggregate, are risk averse and thus tend to pay more than fair value for downside protection. There is no way to measure the magnitude of this bias, or whether it is even present, however. Considering this potential bias reinforces the interpretation of the market-implied outlook as slightly bullish.
The market-implied outlook for the next 14 months has slightly elevated probabilities of negative returns for a range of the most-probable outcomes (the dashed red line is above the solid blue line over the left quarter of the chart below), but the probabilities of positive returns are higher for larger-magnitude / less-probable outcomes (the right ⅔ of the chart below). Given the expectation of a negative bias, I interpret this outlook as neutral. The expected volatility is 33.7% (annualized).
Geoff Considine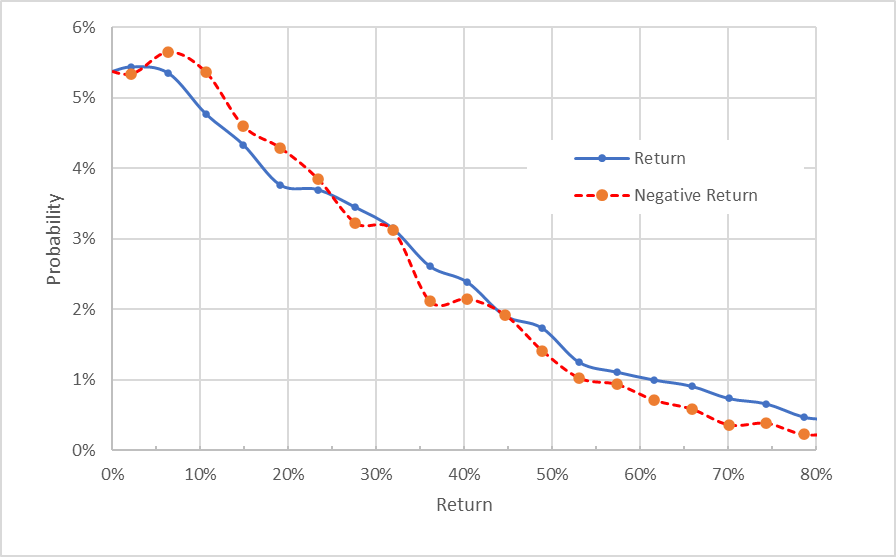
Market-implied price return probabilities for AIG for the 14-month period from now until January 19, 2024. The negative return side of the distribution has been rotated about the vertical axis (Source: Author’s calculations using options quotes from ETrade)
At the end of May of 2022, the market-implied outlook for the 7.8-month period to mid-January of 2023 was neutral. Today, the market-implied outlook for the 6.9-month period to mid-June is 2023 is slightly bullish. The difference is noticeable but not dramatic. The outlook to January of 2024 is neutral. The expected volatilities calculated from the outlooks to mid-June of 2023 and to mid-January of 2024 are very similar, about 34.5%.
Summary
AIG management has delivered solid earnings, above expectations, for 10 consecutive quarters. The Corebridge IPO was well-received and allows AIG to consolidate and simplify its focus. The Wall Street consensus rating is a buy and the consensus 12-month price target corresponds to expected total return of 13.4% over the next year. This is not a lot of upside and does not meet my buy criterion of being at least ½ the expected volatility (34.5%). The consensus outlook on earnings growth is acceptable, if not exciting. The market-implied outlook to the middle of 2023 is slightly bullish, an improvement from the outlook I calculated in late May. The market-implied outlook to the start of 2024 is neutral. I am maintaining my buy rating on AIG for the time being.
Be the first to comment