

Gold Talking Points:
- Gold prices have pulled back from last week’s breakout.
- The bigger picture trend remains on hold in Gold as the bull flag is unfettered. The Fed meets next week for the highly expected taper announcement and Gold’s behavior around that can be telling for trends in the future months.
- The analysis contained in article relies on price action and chart formations. To learn more about price action or chart patterns, check out our DailyFX Education section.
There was a quick flare of excitement to finish last week, and it even carried over into this week as Gold prices started to threaten a bullish breakout. But as has happened so many times over the past year, that breakout couldn’t hold, bulls pulled back and prices slid right back to where they were before the whole episode started.
Taking a look at the longer-term chart and it becomes obvious why so many are waiting on that smooth trend side move to avail itself: There seems to be significant potential if/when it does happen. On the fundamental front, there’s a lot of talk about stagflation lately and that’s an environment in which metals have traditionally outperformed. If we go back to the 1970’s when stagflation was running rampant in the US, stock markets heavily underperformed Gold, 77% v/s 1,426.75%.
This is also one of the reasons that so many were so bullish on Gold after the Central Bank response to the Global Financial Collapse, the prospect of strong inflation numbers coming in while growth remained stagnant. The only problem – those strong inflation numbers never really showed up, at least not in the data, but it’s starting to show now.
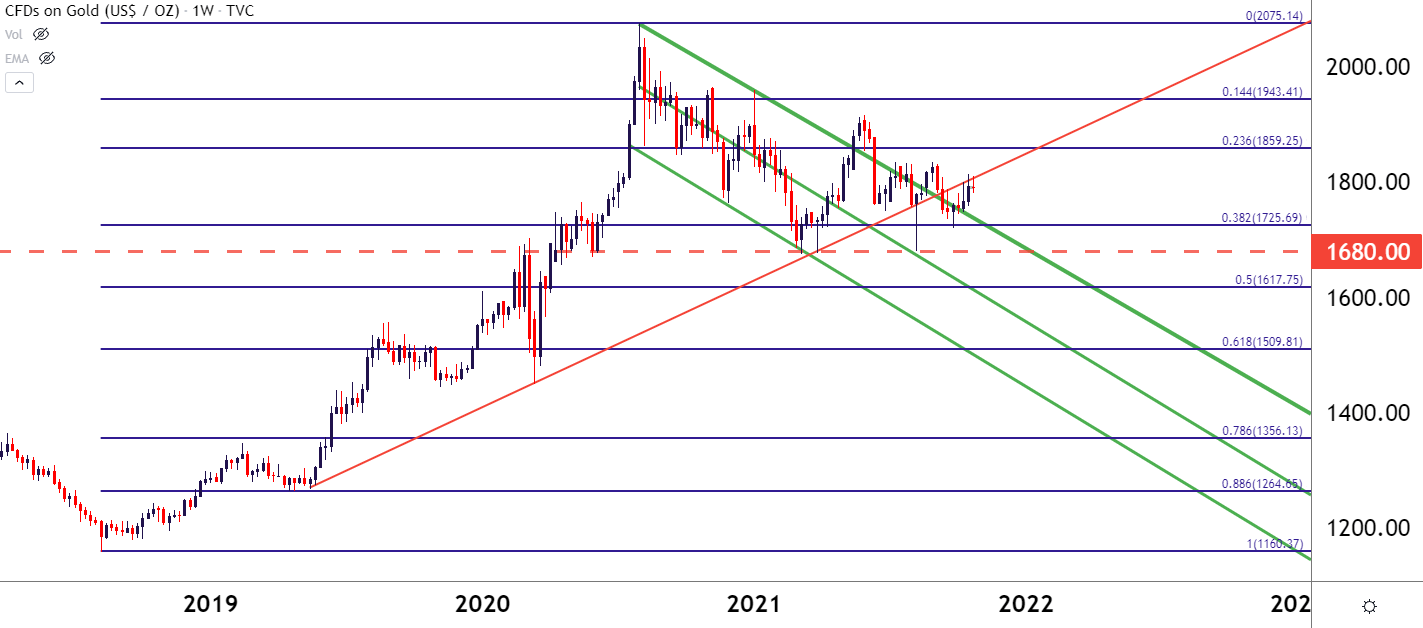
From the technical point of view, there’s a harboring bullish outlook there, as well. When the Fed began to shift from a hiking cycle and back into a cutting phase in 2018/2019, Gold prices began the bullish trend that ran all the way up to a fresh all-time-high last August 7th. And for the year and two months since, Gold prices have held a bearish channel, making up a bull flag formation. This formation remains today but, bulls have been hit by a constant series of false breaks.
To learn more about bull flags, check out DailyFX Education
Gold Weekly Price Chart
Chart prepared by James Stanley; Gold on Tradingview
Gold: Another Formation Appears
Inside of the past few months of digestion, another formation had appeared last week and this started to carry some bullish connotations, as prices pushed above the 1800 level and set a fresh six-week-high. On Friday, Gold gave back a large chunk of that topside push but that ground was re-claimed on Monday trade. Buyers were unable to push up to a fresh high yesterday and price action has since sunk back below the 1800 handle.
At this point, there appears to be some support showing around prior resistance as taken from the symmetrical wedge that I had looked at last week. This could keep the door open for topside potential, but traders would likely want to be very careful considering the number of false topside breakouts that have shown in Gold of recent.
To learn more about the symmetrical triangle, check out DailyFX Education
Gold Four-Hour Price Chart
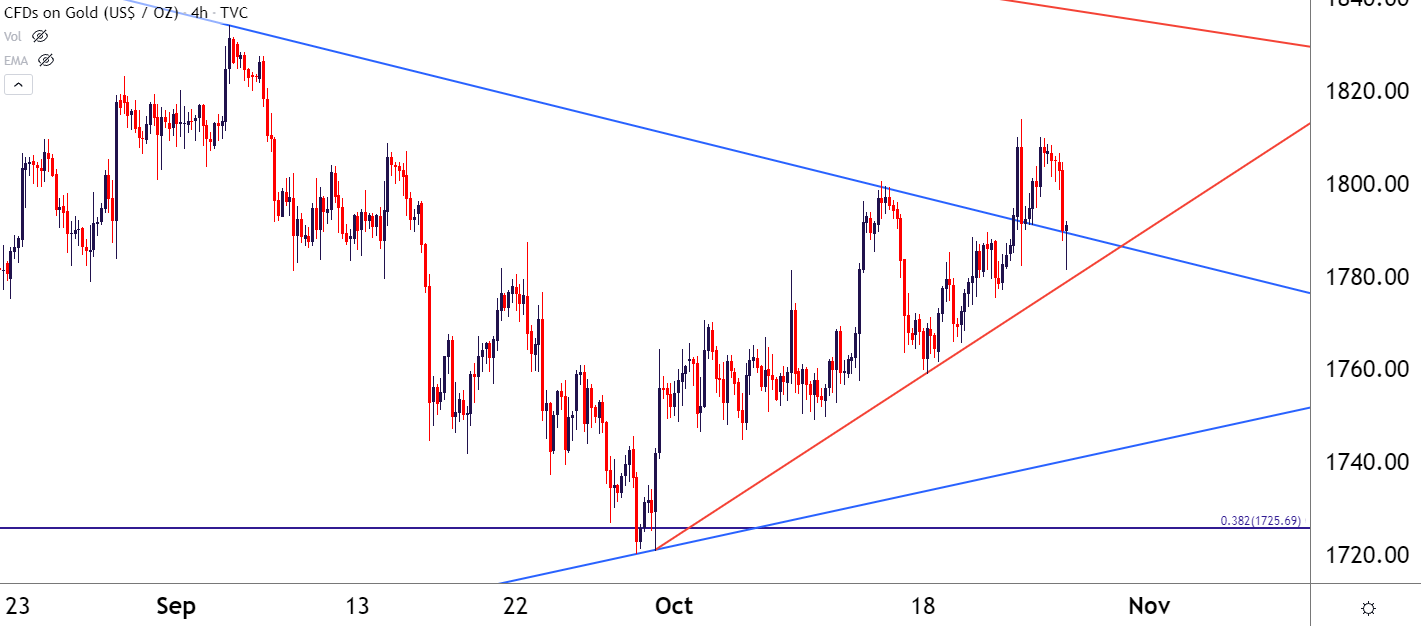
Chart prepared by James Stanley; Gold on Tradingview
Gold Strategy: Near Term
At this point the fundamentals are the focal point: If the bullish trend is going to come back in Gold then we’re likely going to need more items indicating stagflation or a similar environment may be approaching. One thing that could really charge this argument is the Fed backing down from rate hikes, which seems a distant prospect at the moment.
But – it was the drive for expansionary monetary policy in the 1970’s that rooted the stagflation environment and while there’s little argument that the Fed has been deep in the well with expansionary policy, the game may be changing with inflation picking up.
On a short-term basis, a hold of support around the trendline projection can keep the door open for topside strategies, hypothesizing that the recent series of higher-highs and higher-lows may be signaling future strength.
— Written by James Stanley, Senior Strategist for DailyFX.com
Contact and follow James on Twitter: @JStanleyFX
Be the first to comment