enot-poloskun
Investment thesis
Agilent Technologies (NYSE:NYSE:A) lost about 37% of its value since its stock all-time high (ATH) at $179.57 on September 3, 2021, bottoming at $112.52 on June 22, 2022, showing significant relative strength since the beginning of May and increasing strong buy-side volume during the bottoming phase. The stock reached the price target I suggested in my first analysis and is now showing significant strength after a retracement to its most strong support levels. My most likely price target is set at $160, with 14% upside potential from its latest closing price.
A quick look at the big picture
The healthcare sector in the US is among the winners in the last 3 months, led by a rebound in biotechnology stocks, followed by companies in the diagnostics and research industry.
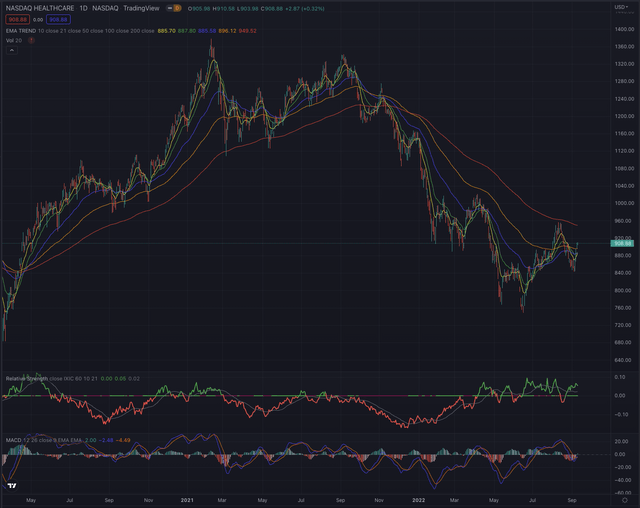
The NASDAQ Health Care Index (IXHC) bottomed on June 16 and mostly showed relative strength since, when compared to the main index, while recently consolidating after reaching its EMA200.
Looking back even further, Agilent significantly outperformed its main reference indexes and funds, reporting 113.74% performance over the past 5 years, almost seven times the performance of the IXHC and more than double of the Health Care Select Sector SPDR (NYSEARCA:XLV).
Author, using SeekingAlpha.com
Where are we now?
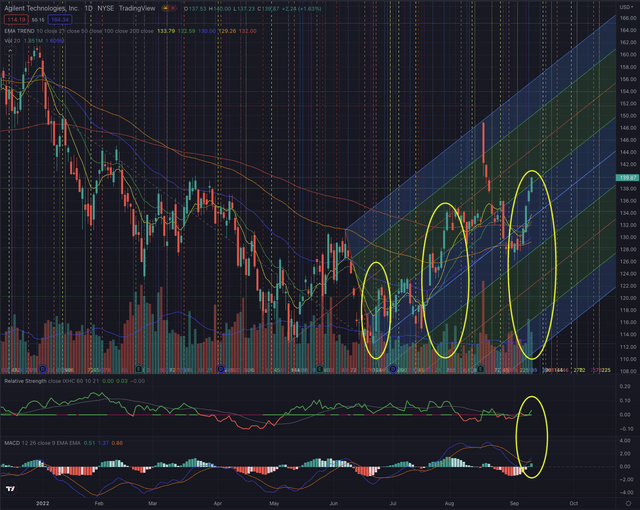
Since my last article ‘Agilent: A Strong Leader With Great Opportunities’, the stock broke the mentioned supports at $123 and further at $120, with a significant gap down on June 13, just before confirming its bottom on June 15. The stock has since formed a short-term reversal, confirming its price level over the EMA50, reaching the price target I set on April 15, and recently even confirming its level over the EMA200, while the latter is giving signs of flattening, which could confirm that the stock has formed a sound base from which continuing in its medium-term uptrend.
Each important resistance has been overcome with conviction on higher volume, confirming the stock’s relative strength, which seems now set for further strength, and may be confirmed by the MACD, which just crossed its signal line, pointing to positive momentum in the stock price action. The actual most important support level is set by the EMA200, while minor support can also be found at the recent overcome retracement level at $138.13 and $134.33. Further resistances are now located at $146.04 and the recent peak at $149.
What is coming next
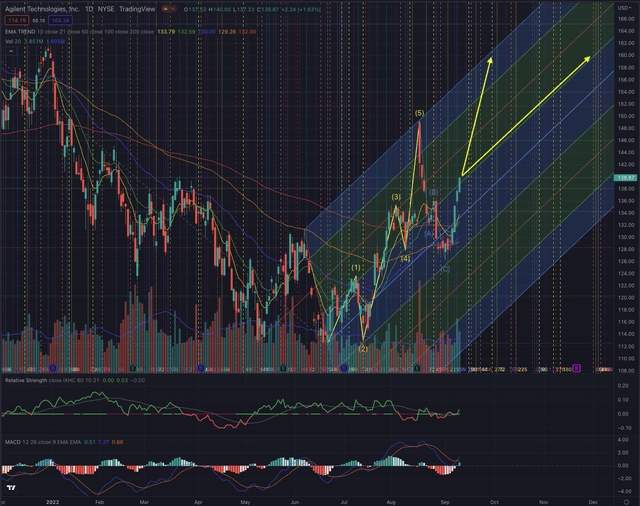
I expect the stock to continue in its recent run, as the favorable momentum in its industry seems to be confirmed and the stock could attempt to overcome its recent highs.
Source: Author, using TradingView
The stock just completed its corrective phase, a new uptrend based on an Elliott motive phase has likely begun and is supported by the strong trend, set since the end of June. My calculations based on Fibonacci’s theory, suggest the most likely price target at $160, as the first target at $139 has already been reached.
Investors should observe the price action and how the stock behaves at the next resistance levels, and how a pull-back is confirmed or rejected, based on the trading volume and the relevant support levels. As the breakout over the EMA200 seems definitely to be confirmed in the short term, I don’t see a significant risk for the stock to fall under that level but would set my stop-loss accordingly, and further use the EMA50 as a trailing stop, to protect from eventual pullbacks.
The bottom line
I consider techniques based on the Elliott Wave Theory, as well as likely outcomes based on Fibonacci’s principles, by confirming the likelihood of an outcome contingent on time-based probabilities. The purpose of my technical analysis is to confirm an entry point in the stock, by observing its sector and industry, and most of all its price action. I then analyze the situation of that stock and calculate likely outcomes based on the mentioned theories. Agilent has many elements that indicate the stock is an actual leader in its industry, and its recent price action is suggesting this trend is likely not over yet. I see the stock likely reaching $160 in the near term, but I am aware of the significant actual volatility and would particularly put attention on managing the downside risk.


Be the first to comment